GO INTO THE LIGHT 走进光明
The BEST & WORST opportunities on my screens (2ND EDITION).
我屏幕上的最佳和最差机会(第二版)。
A month ago in the 1ST EDITION of this Series, I presented the case for Max Overweight/LONG Bitcoin vs. Max Underweight/SELL Semiconductors.
一个月前在本系列的第一版中,我提出了支持最大超重/做多比特币 vs. 最大轻仓/卖出半导体的案例。
This framework served extremely well — Bitcoin has charged higher, leading Global Markets and stoking “Animal Spirits” with it. (*And I still like it here…)
这个框架表现得非常好——比特币上涨,领先全球市场,并激发了“动物精神”。(*我依然喜欢这里…)
In the same report, I presented the case to Max Underweight/SELL the Semiconductor space.
在同一报告中,我向马克斯展示了对半导体领域的减持/卖出意见。
Since then, nearly all Semiconductor Stocks are down double digits or more. Worse, many have completed Major Tops and broke down — which we highlighted along the way.
自那时起,几乎所有半导体股票均下跌了两位数或更多。更糟的是,许多股票已经形成了主要顶部并下跌——我们在此过程中对此进行了强调。
Short-term, while the world hinges on the next NVDA earnings, I think the bigger picture is stunning…
短期内,虽然世界在关注下一个 NVDA 财报,但我认为更大的图景令人惊叹……
Despite overwhelming evidence that this key Industry Group has long passed its cyclical expiration date, no one seems to care… and even a cautious view is still considered contrarian.
尽管有压倒性的证据表明这个关键行业集团早已过了其周期性过期日期,但似乎没有人关心……即使是谨慎的观点仍然被视为反常。
We’ll see what the next months and 2025 bring…
我们会看看接下来的几个月和 2025 年会带来什么…
LOOKING AHEAD 展望未来
In this 2ND EDITION: 在第二版中:
We’ll introduce a NEW CORE FRAMEWORK I’m developing — potentially driving Markets over the next 6-12 months (or longer).
我们将介绍我正在开发的一个全新核心框架 — 可能在接下来的 6-12 个月(或更长时间)推动市场。As promised in “Onwards and Upwards”, today we’ll also introduce several NEW DATASETS & INDICATORS we’re adding to our arsenal.
正如在“向前迈进”中承诺的, 今天我们还将介绍几个 新数据集和指标,我们将把它们添加到我们的工具库中。I’ve long wanted to build these — get ready for more unique, “never-before-seen” charts in the classic “MC STYLE”.
我早就想要制作这些了——准备好迎接更多独特的“前所未见”的经典“MC 风格”图表吧。And there’s even more to come…
还有更多精彩内容即将到来……
CORE FRAMEWORK 核心框架
We’ll focus on equal parts, as we did in the last edition:
我们将专注于相等的部分,就像在上一个版本中一样:
The Best opportunities in Markets (a strong OFFENSE).
市场上的最佳机会(强劲的进攻)。Avoiding crowded/classic Traps (a strong DEFENSE).
避免拥挤/经典陷阱(强大的防御)。
It’s been a strong year for opportunistic, global investing — and I think 2025 will be even more rewarding (AND challenging).
这是一个有利可图的全球投资的强劲年份——我认为 2025 年将更加丰厚(而且具有挑战性).
Let’s get started: 让我们开始吧:
RISK FRAMEWORK 风险框架
We need to start with the risks this time.
这次我们需要从风险开始。
The two main risks in Investing:
投资中的两个主要风险:
Buying something that significantly underperforms (opportunity cost).
购买某些表现明显不佳的东西(机会成本)。Buying something that loses a lot of money (capital impairment + opportunity cost).
购买会损失大量资金的东西(资本损失 + 机会成本)。
Let’s run the Charts — and gauge the risks that may be ahead.
让我们运行图表——评估可能出现的风险。
INSIDER SELLING 内部交易
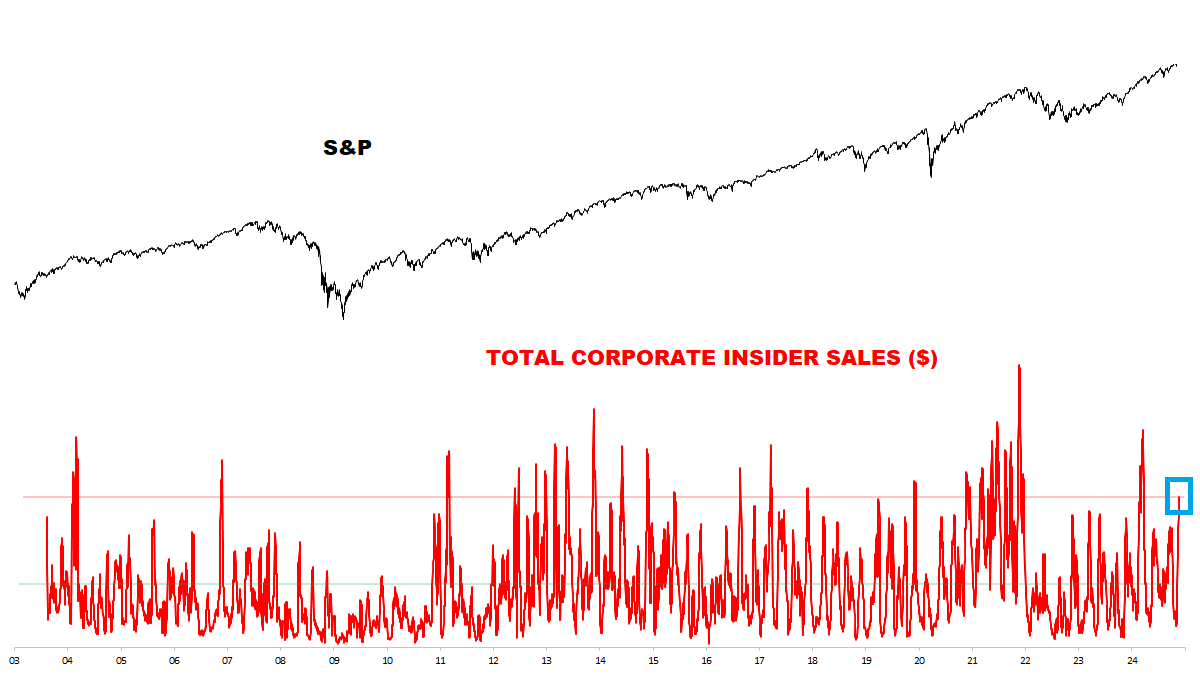
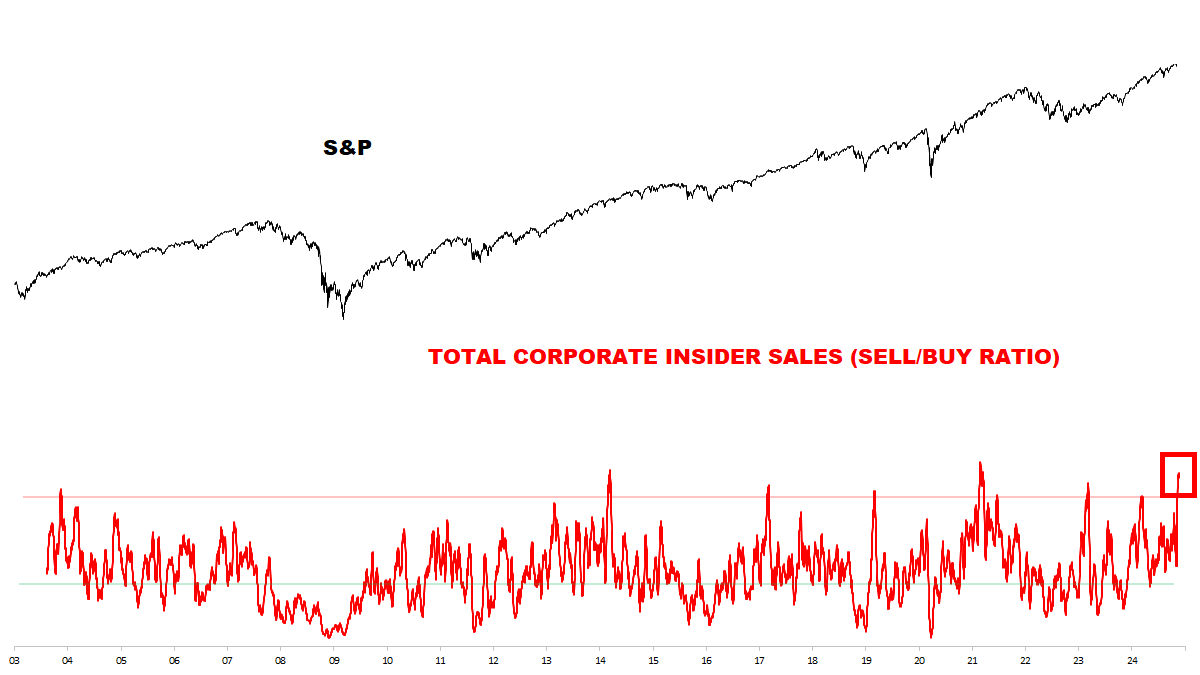
Introducing two of the many NEW Insider Flow Indicators we’ll be tracking going forward:
介绍我们将继续跟踪的众多新内部流动指标中的两个:
Despite the growing economic optimism post-Election, Insiders are rapidly escalating their Stock Sales.
尽管选举后的经济乐观情绪日益高涨,内部人士正在快速升高他们的股票销售。CHART 1: in Dollar terms, Selling is not extreme YET — but is on pace for one of the biggest spikes ever.
图表 1: 从美元的角度来看,销售尚未极端——但正处于历史上最大涨幅之一的步伐中。CHART 2: as a Ratio, Selling vastly outnumbers Buying here — already a historic extreme.
图表 2:作为比例,这里的卖出数量远远超过买入——已经是历史极限。Important to emphasize this is not an immediate Sell signal — but could set the tone for a more difficult environment in 2025.
重要的是要强调,这不是一个立即的卖出信号——但可能为 2025 年更加困难的环境定下基调。For example — note the spikes in 2014, 2017, 2019 and 2021 led to difficult years in Stocks — 2015, 2018, 2020, 2022 all experienced drawdowns.
例如 — 注意 2014 年、2017 年、2019 年和 2021 年的尖峰导致股票市场的困难年份 — 2015 年、2018 年、2020 年和 2022 年都经历了下跌。
We’ll update as these signals evolve…
随着这些信号的发展,我们会进行更新……
EASY TIMES… CREATE HARD TIMES
轻松时期……创造困难时期
For new readers, a recent chart and discussion worth emphasizing:
对于新读者,一张最近的图表和讨论值得强调:
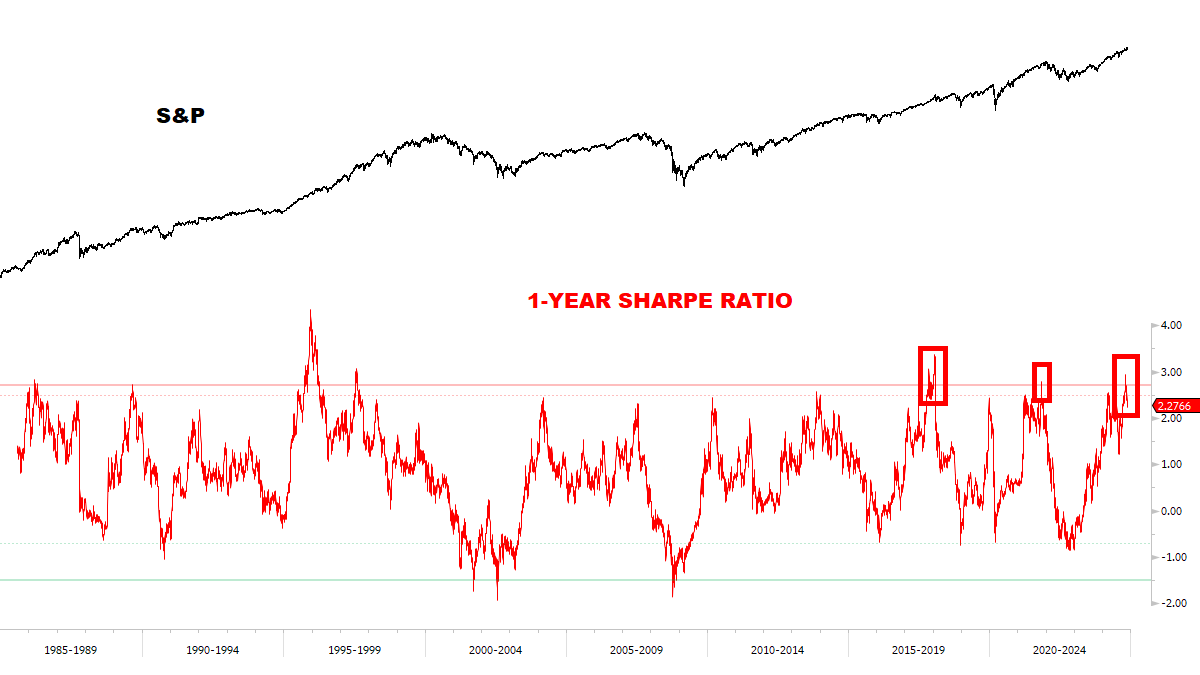
U.S. Stocks have just delivered one of the best runs in the modern era — a rare combination of extremely high Returns with low Volatility.
美国股票刚刚实现了现代时代最佳表现之一——高回报和低波动性罕见结合。Post-2000, particularly in late 2017-2018, late 2019 and late 2021 — when this happened, Markets went through difficult times.
2000 年后,特别是在 2017 年末至 2018 年,2019 年末和 2021 年末——当时,市场经历了艰难时期。As I wrote before, my growing feeling is that 2025 won’t be as easy as many Investors expect.
正如我之前所写,我越来越觉得 2025 年不会像许多投资者所期待的那样容易。
EVERYONE IN THE POOL 每个人都在泳池里
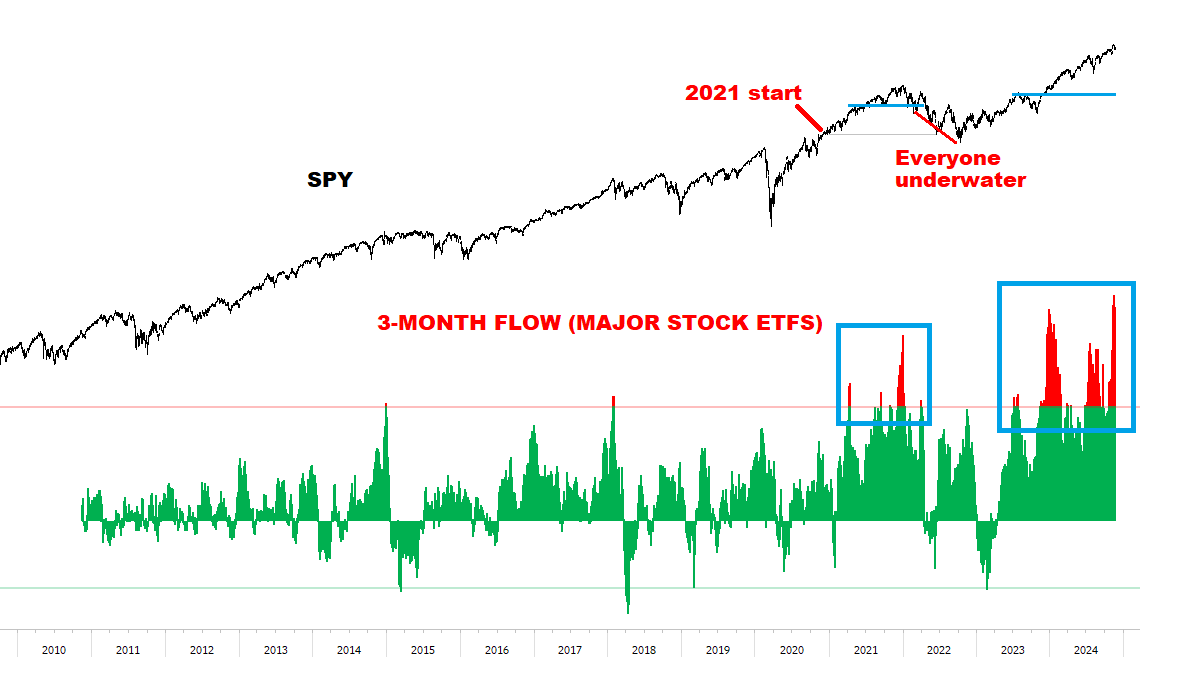
To complicate things further, nearly all Flows we measure are at new records:
进一步复杂化的是,我们测量的几乎所有流量都达到了新的记录:
This is an important concept to illustrate the “MAX PAIN” scenario.
这是一个重要的概念,用于说明“最大痛苦”场景。See the BLUE BOX in 2021 — a relentless buying spree which lasted the whole year.
查看 2021 年的蓝色盒子——一场持续整整一年的无情购入狂潮。When the buying ended, the Market erased ALL of 2021’s gains and put everyone underwater.
当购买结束时,市场抹去了 2021 年所有的收益,使每个人都陷入亏损。Today, IF the Market wants to hurt the maximum number of participants:
今天,如果市场想要伤害最多的参与者:The equivalent would be S&P correcting down to ~4500 in the next 12-18 months — effectively wiping out 2024 returns, and putting all buyers underwater.
相当于标准普尔在接下来的 12-18 个月内下调至约 4500 点——实际上抹去了 2024 年的回报,并使所有买家处于亏损状态。Could history repeat this MAX PAIN scenario? We’ll see.
历史会重演这个最大痛苦的场景吗?我们拭目以待。
For now: important to take it one day at a time — monitoring for evidence of a topping structure and negative Momentum. (We’re not there yet.)
目前:重要的是一天一天地来——监测顶部结构和负动量的证据。(我们还没有到达那里。)
Extreme positioning is everywhere…
极端定位无处不在…
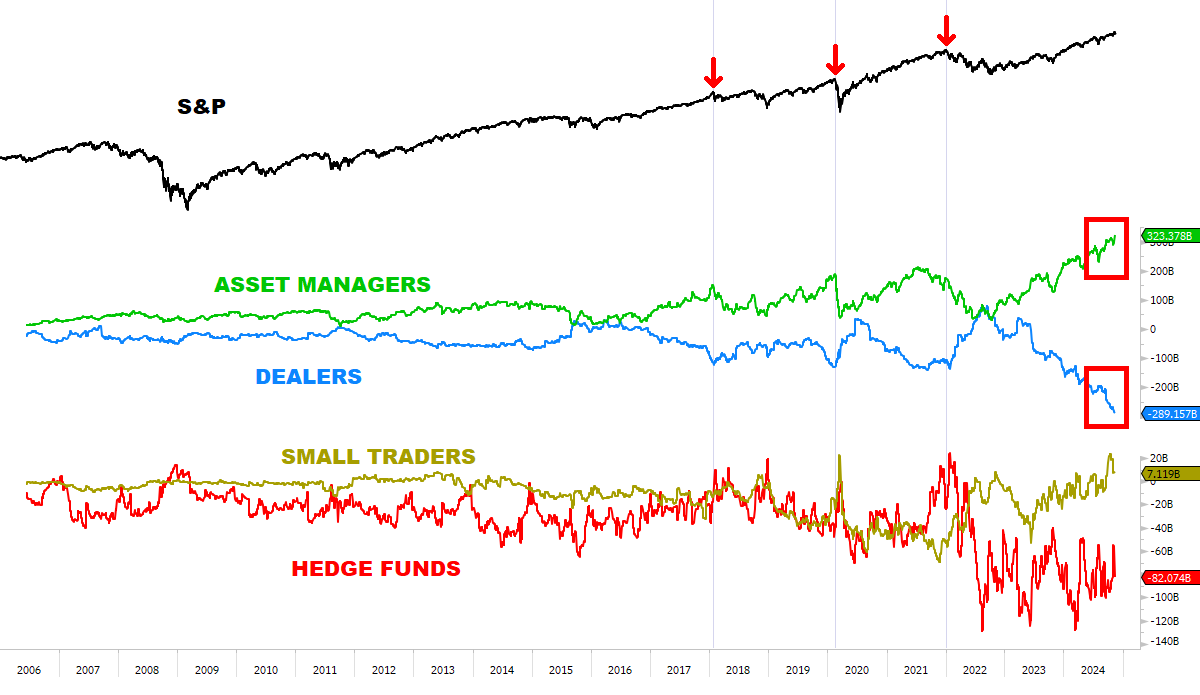
Here’s a look at S&P Futures — and this is happening across the major Indexes:
这是对标准普尔期货的观察——这正发生在主要指数上:
Asset Managers are currently holding the largest NET LONG S&P position in history, at +$323 Billion.
资产管理公司目前持有历史上最大的净多头 S&P 头寸,为+$3230 亿。Dealers are currently holding the largest NET SHORT S&P position in history, at -$289 Billion.
经销商 当前持有历史上最大的 S&P 净空头头寸,达到-2890 亿美元。Highlighted below: see the Asset Manager VS. Dealer positioning at the last three big Tops — 2018, 2020, 2021.
突出显示:请参见资产管理者与经销商在最后三个大顶峰——2018 年、2020 年、2021 年的定位。Do we want to be cautious and side with the Dealers here?
我们是否想要小心谨慎,站在经销商这一边呢?What’s stunning is — the S&P is up +4% since July, meanwhile Dealers increased their Net Short by $100 Billion (a 50% increase from what was already a record Net Short position back in the summer).
令人惊讶的是,自七月以来,标准普尔指数上涨了 4%,与此同时,交易商将他们的净空头增加了 1000 亿美元(比已经创纪录的净空头头寸增加了 50%)。Sooner or later, this imbalance should clear — and when it does, Volatility could make a big comeback as it did before.
迟早,这种失衡将被纠正——而当它纠正时,波动性可能会像之前一样大幅反弹。
ANOTHER SMALL-TRAP? 另一个小陷阱?
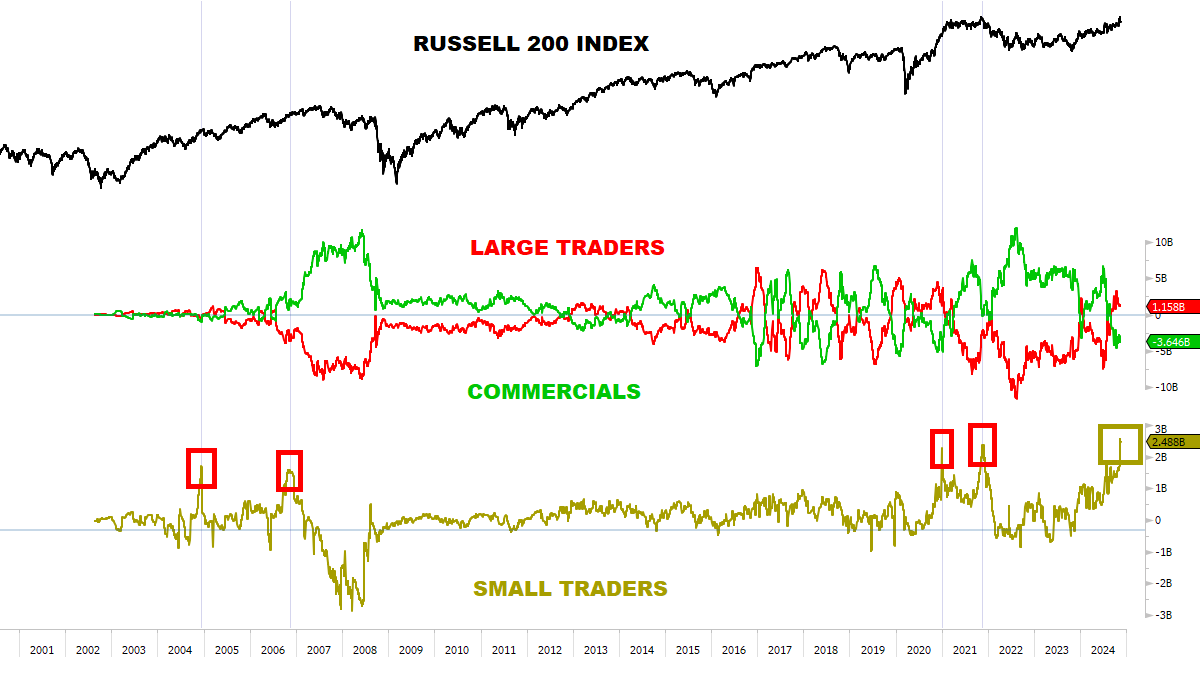
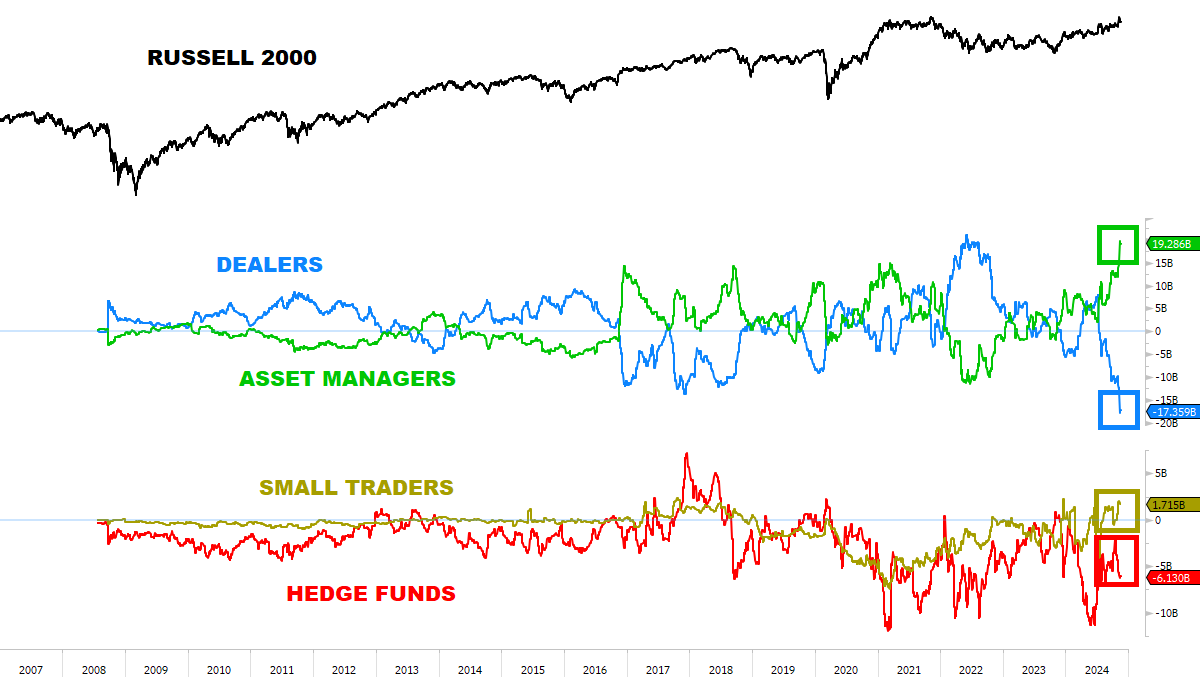
The post-Election move has led Russell positioning to the most crowded level in history.
选举后的举动使拉塞尔的头寸达到了历史上最拥挤的水平。
It may be time to seriously question the medium-term sustainability of the Small-Cap / Rotation Trade:
可能是时候认真质疑小型股/轮动交易的中期可持续性了:
Small Traders and Asset Managers are both holding RECORD LONG positions.
小型交易者和资产管理者都持有创纪录的多头头寸。Dealers are holding RECORD SHORT positions.
交易商 正在持有创纪录的空头头寸。Historically, this combination tended to precede extremely rough times for Small-Caps over the next 12-24 months (and broad Indexes in general — consistent with the prior charts already discussed).
历史上,这种组合往往会在接下来的 12-24 个月中 极其艰难的时刻之前出现(以及一般的大型指数——与之前讨论的图表一致)。
Again, this isn’t an immediate Sell signal — and the Russell COULD still retest its 2021 high into year-end as part of a Major Top (as I’ve written about before) — but for me personally, the upside isn’t worth the risk.
再说一次,这并不是一个立即卖出的信号——而罗素可能仍会在年末测试其 2021 年的高点,作为一个主要顶部(正如我之前所写的)——但对我个人而言,向上潜力不值得冒这个风险。
*By the way — this also goes for many RELATED securities which were caught in the post Election rush, reached extreme overbought levels, and are at risk of a potential consolidation / correction — for instance: ARKK, TSLA, KRE, which we highlighted in the most recent Weekly Review here.
*顺便提一下——这也适用于许多相关证券,这些证券在选后冲击中被捕,达到了极度超买水平,并面临潜在的整固/修正风险——例如:ARKK、TSLA、KRE,我们在最近的 每周回顾中强调过.
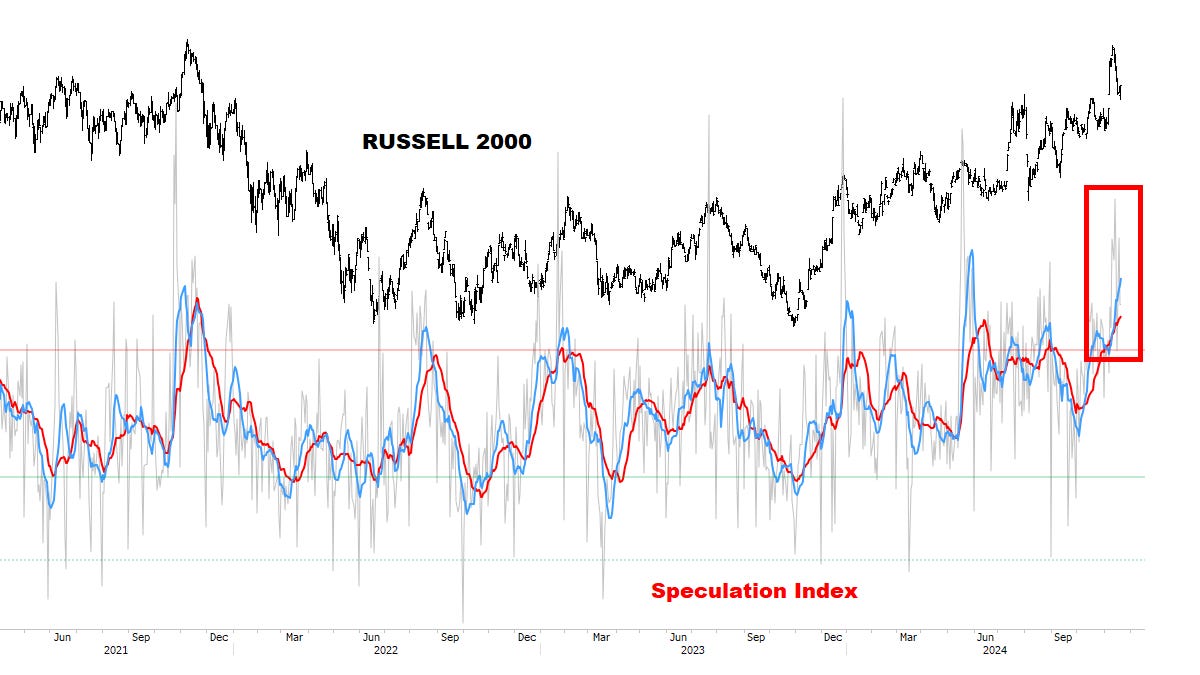
Further, also from the Weekly Review, the extreme level of the Speculation Index could lead to an extended correction / consolidation — and one can’t rule out the possibility that the Russell MAY have already put in a bigger Top:
此外,来自每周回顾,投机指数的极端水平可能导致延长的调整/盘整——而且不能排除罗素可能已经形成更大顶点的可能性:
It gets worse… 情况变得更糟……
Historically, extreme buying of IWM led to opportunity costs (sideways for nine months in 2017) or even BIG losses (many times):
历史上,IWM 的极端购买导致了机会成本(2017 年横盘九个月)甚至是巨额亏损(多次):
*Maybe this time is different, but I’m not interested in being Long something which had such negative outcomes from similar conditions.
*也许这次不同,但我对在类似条件下有如此负面结果的事情不感兴趣。
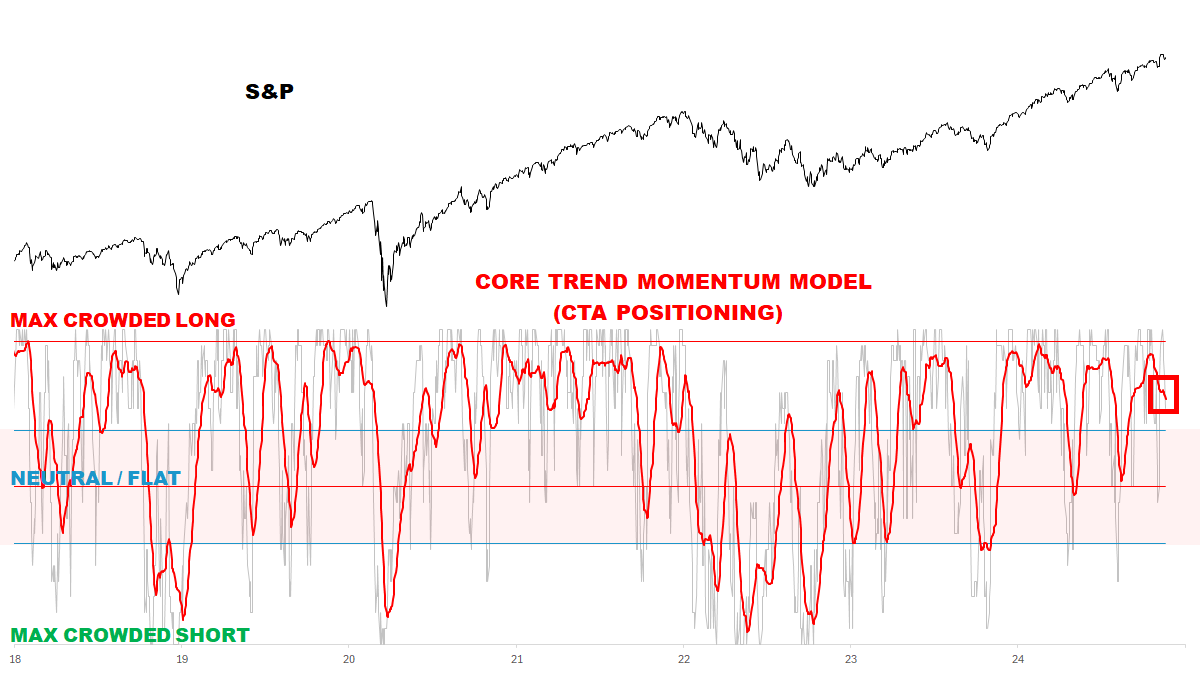
CORE TREND MOMENTUM MODEL (CTA POSITIONING)
核心趋势动量模型(CTA 定位)
Introducing one of several NEW tracking Models we’ll be running for CTA positioning:
介绍我们将用于 CTA 定位的几种新跟踪模型之一:
Below, Momentum is currently rolling over from a high range — which typically continued to deteriorate lower in the near-term.
下面,动量目前正从一个高范围回落——这通常意味着在短期内会继续恶化。CTA Positioning approached Max-Long recently, and they’re at risk of cutting exposure rapidly if conditions worsen — adding fuel to the selling of crowded Long positions already discussed.
CTA 定位最近接触了 Max-Long,如果情况恶化,他们有迅速减少风险敞口的风险——这进一步加剧了之前讨论过的拥挤的多头仓位的抛售。We’ll be updating this Model regularly going forward — (for all Asset Classes).
我们将定期更新此模型——(适用于所有资产类别)。
DEFENSIVE FRAMEWORK — A SUMMARY:
防御框架 — 摘要:
Stocks could extend higher into year-end, but a runaway melt-up environment for 2025 seems unlikely.
股票可能在年末进一步上涨,但 2025 年出现失控的暴涨环境似乎不太可能。As such, my plan is to avoid unnecessary overweight exposure at the INDEX level whenever possible.
因此,我的计划是在可能的情况下避免在指数层面上产生不必要的过重敞口。My focus will be on Tactical Bets: SELL Overbought / crowded areas, BUY Oversold / capitulation areas. (Tactical bets usually for a 2-4 month horizon, or longer depending on the opportunity set.)
我的重点将放在战术押注上:卖出超买/人满为患的区域,买入超卖/投降的区域。(战术押注通常持续 2-4 个月,或者根据机会的不同而更长。)The KEY is — size right, sit tight, control risk and stay flexible.
关键是——调整大小,保持稳定,控制风险并保持灵活。Most importantly — don’t fall into *narrative traps*.
最重要的是——不要陷入*叙事陷阱*。
The last two points are critical as we move to the next section!!
最后两点在我们进入下一部分时至关重要!!
TACTICAL OFFENSE 战术进攻
With the risks out in the open, and armed with a framework for conscious risk-taking, let’s cover the most interesting Tactical opportunities potentially in play here:
考虑到风险已公开,并且具备了有意识的冒险框架,下面让我们探讨一下这里可能存在的最有趣的战术机会:
THE CASE FOR BONDS 债券的理由
I don’t know if 2025 will be the “year for Bonds”, but they’re an area of focus for potential Tactical Longs here.
我不知道 2025 年是否会是“债券之年”,但它们是此处潜在战术多头关注的一个领域。
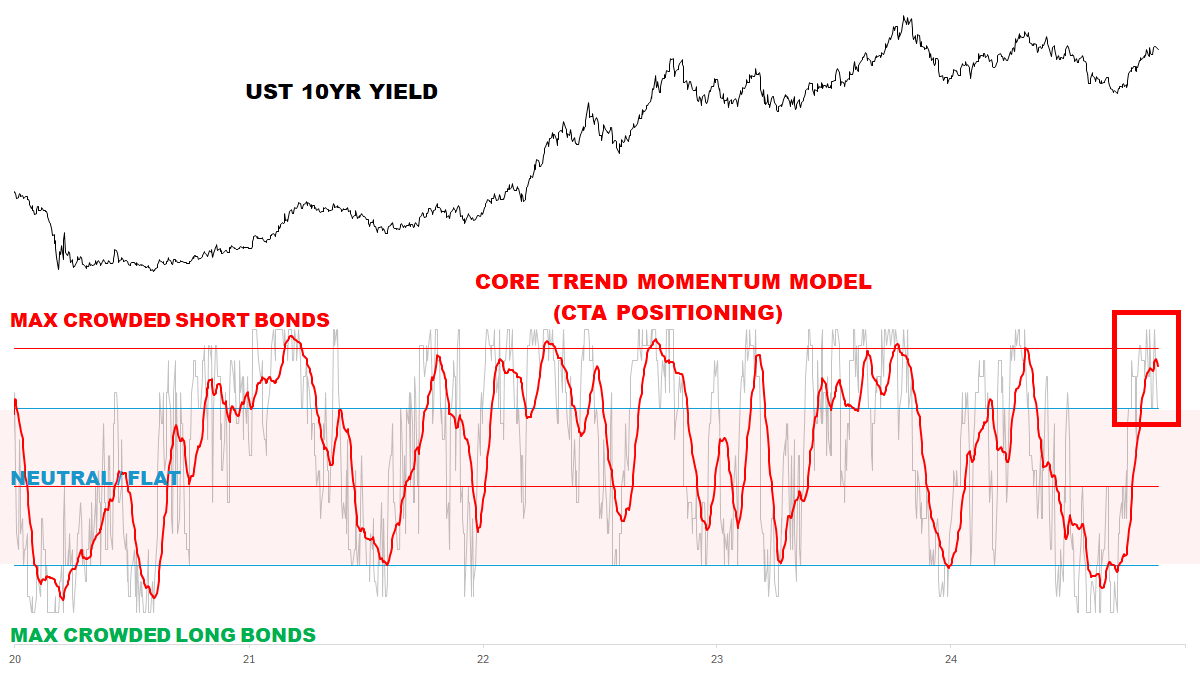
First, introducing a NEW tracking Model for CTA positioning in Bonds (*using Bond Yields instead of Prices looks cleaner to me):
首先,介绍一种用于债券中 CTA 定位的新跟踪模型(*使用债券收益率而不是价格对我来说看起来更干净):
CTAs are at significant risk of a turn down in Yields — and would be forced to cover Bond Shorts aggressively.
CTAs 面临收益率大幅下降的重大风险——并将被迫大力回补债券空头。
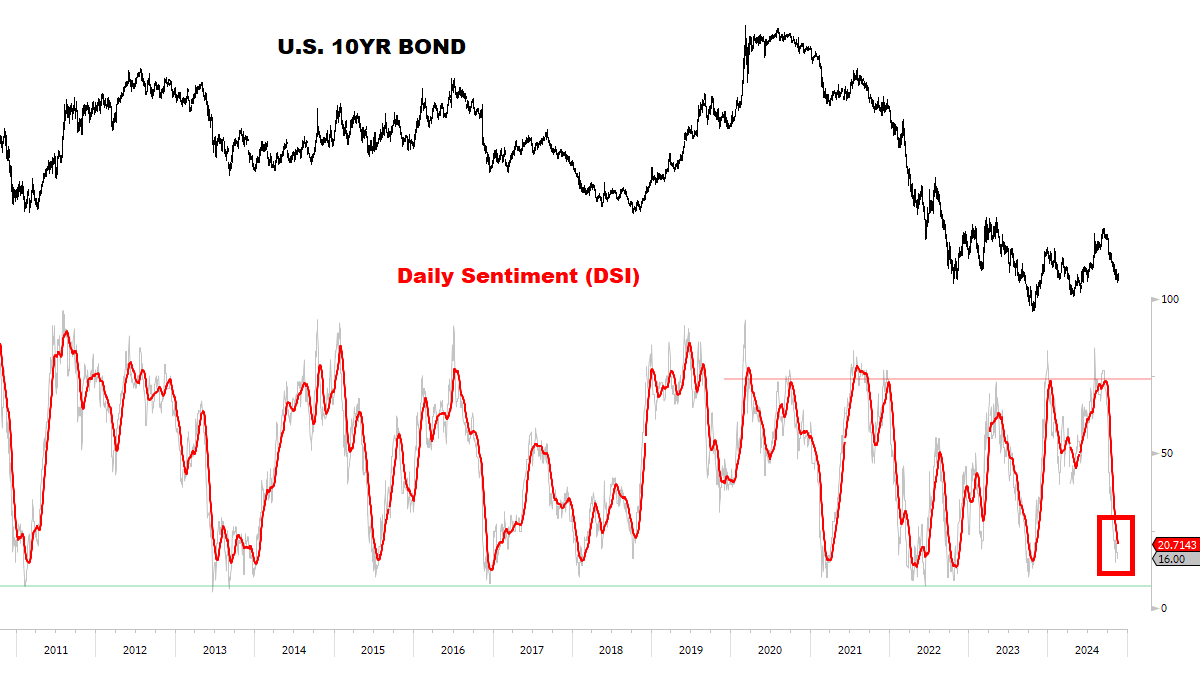
Bond Sentiment is *ALMOST* at big bottoming levels:
债券情绪*几乎*达到了大底部水平:
As before, watching closely for a turn UP.
像之前一样,密切关注上涨的迹象。Emphasizing this could be a key turning point — a BIG opportunity which could last well into next year.
强调这可能是一个关键的转折点——一个可以持续到明年的重大机会。We’ll publish an Alert if it triggers (could be soon).
如果触发,我们会发布警报(可能很快)。
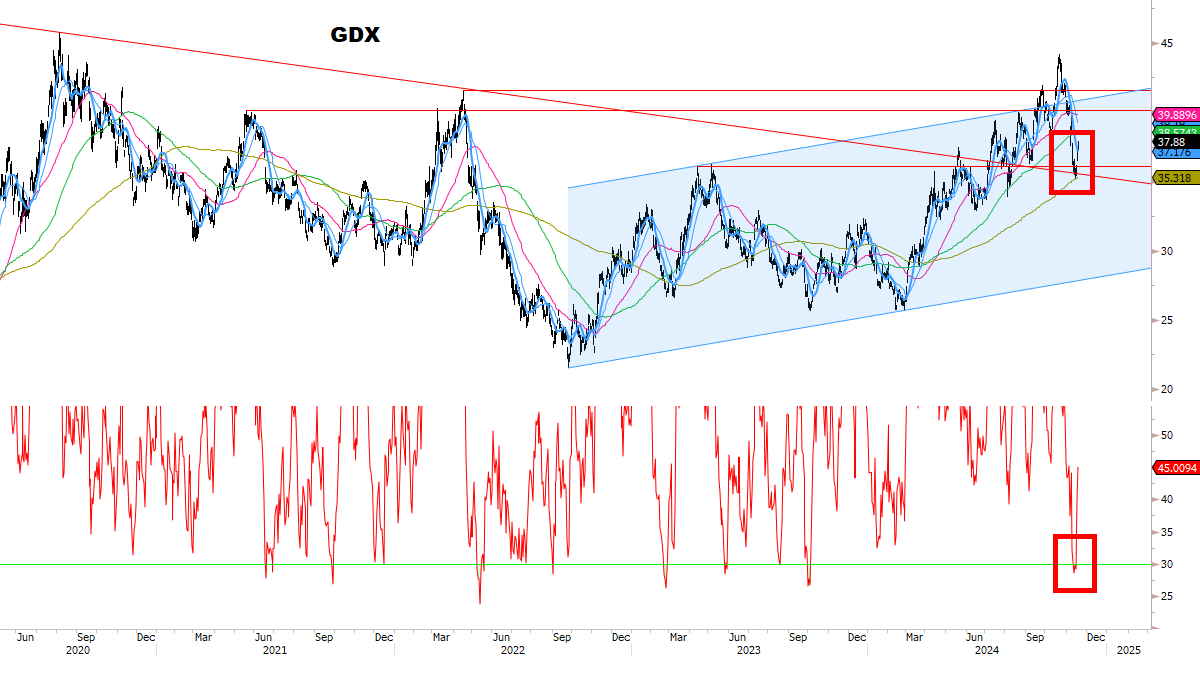
GOLD MINERS 金矿工人
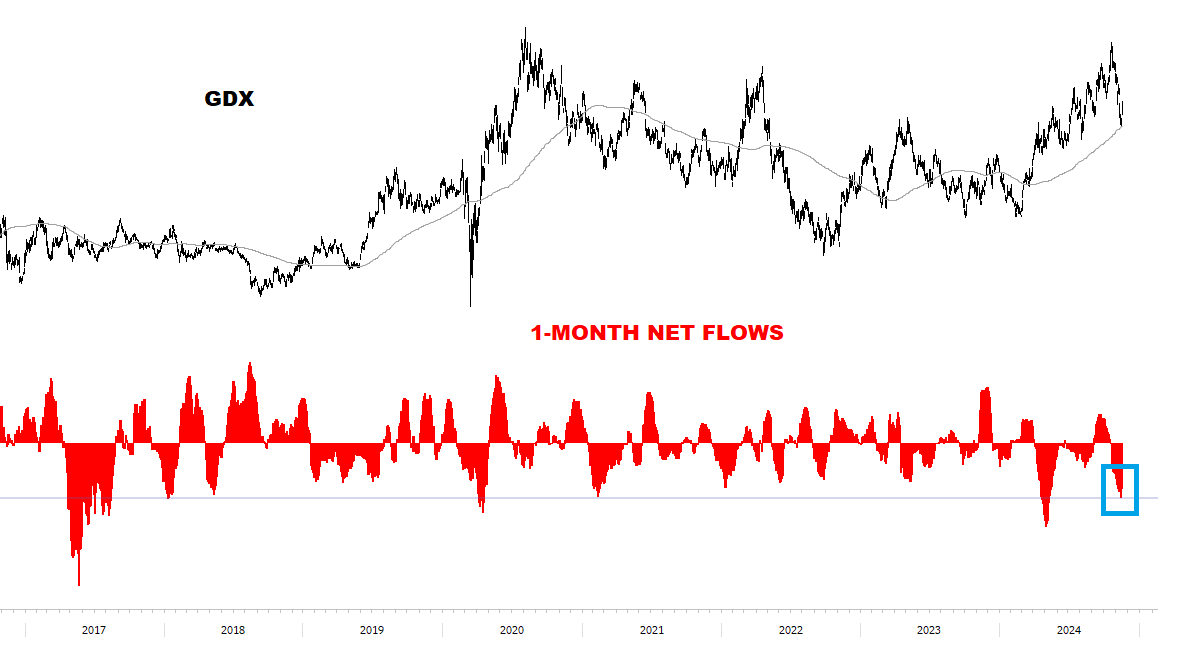
This was a sharp capitulation selloff to key support — we are Long with tight stops and looking to Buy dips/pullbacks (if Blue 10d/20d MAs confirm a turn):
这是对关键支撑的急剧屈服抛售——我们持有多头头寸并设有紧密止损,并希望在回调/下跌时买入(如果蓝色 10 日/20 日移动平均线确认反转):
More importantly, this is how severe the recent selling was:
更重要的是,这就是最近抛售的严重程度:
In summary: a important thematic Equity Group that’s trading in an uptrend (key), testing big support levels, and suffered the second biggest selling spike since COVID…
总之:一个重要的主题股权集团正在上升趋势中交易(关键),测试大支撑位,并经历了自疫情以来第二大卖盘峰值……
As part of my Core Framework, I want to lean Long here: “size right, control risk, be flexible, and fade narrative traps”.
作为我核心框架的一部分,我想在这里借鉴 Long 的话:“合适的规模,控制风险,灵活应对,避免叙事陷阱”。
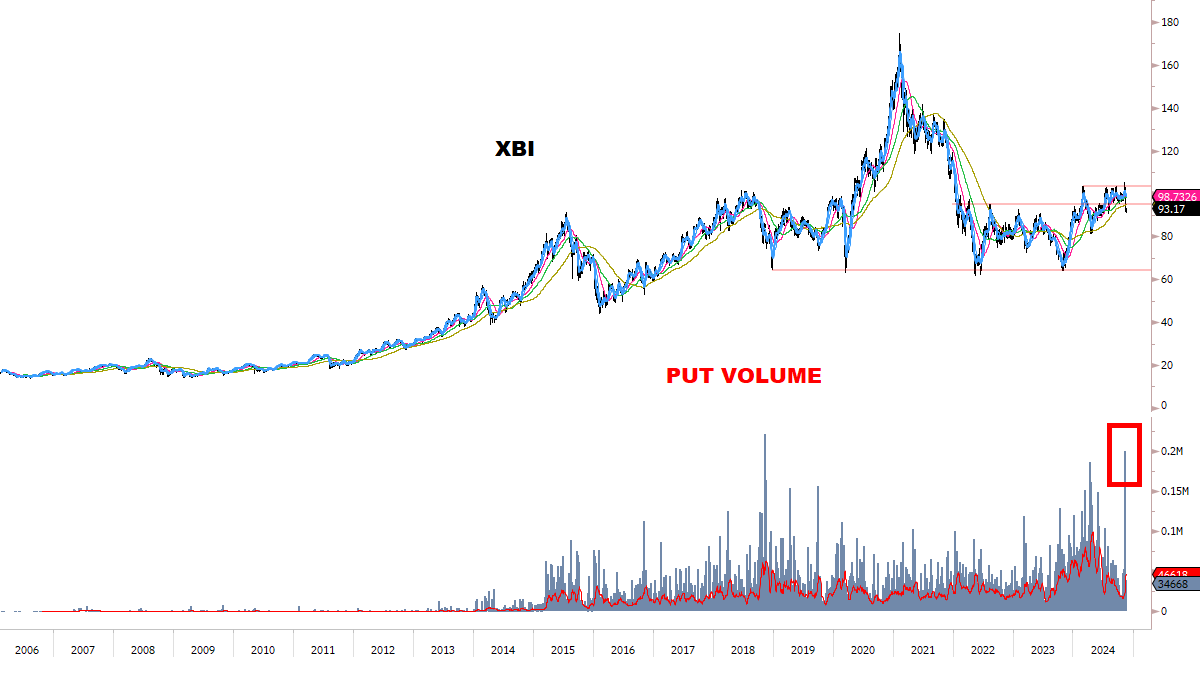
HEALTH CARE & BIOTECH 医疗保健与生物技术
Everyone’s a contrarian until we get to this one…
每个人都是反对者,直到我们谈到这个……
But here are the facts:
但事实是:
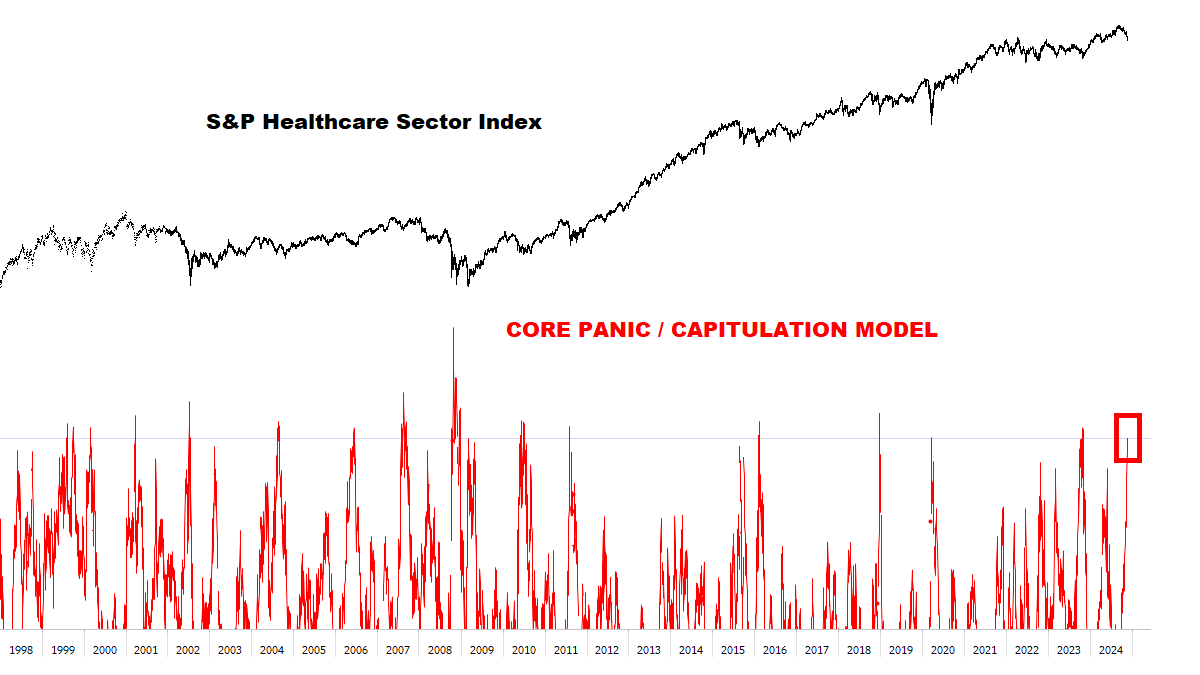
CORE PANIC / CAPITULATION MODEL — A HISTORIC BUY SIGNAL
核心恐慌/屈从模型 — 历史性的买入信号
Nearly all of this Sector’s biggest bottoms in history had similar Buy signals.
该行业历史上几乎所有最大的底部都有类似的买入信号。The last signal was October 27 2023, before that March 23 2020, and before that December 21 2018 — and so on.
I’m not a raging Bull here — but if you didn’t read the news the last few weeks, you would think this is a Buy signal with extremely asymmetric upside.
(*Remember the news was pretty bad at those other historic bottoms too…)
It’s POSSIBLE this is a V-shaped bottom and you want to be buying it right here, right now.
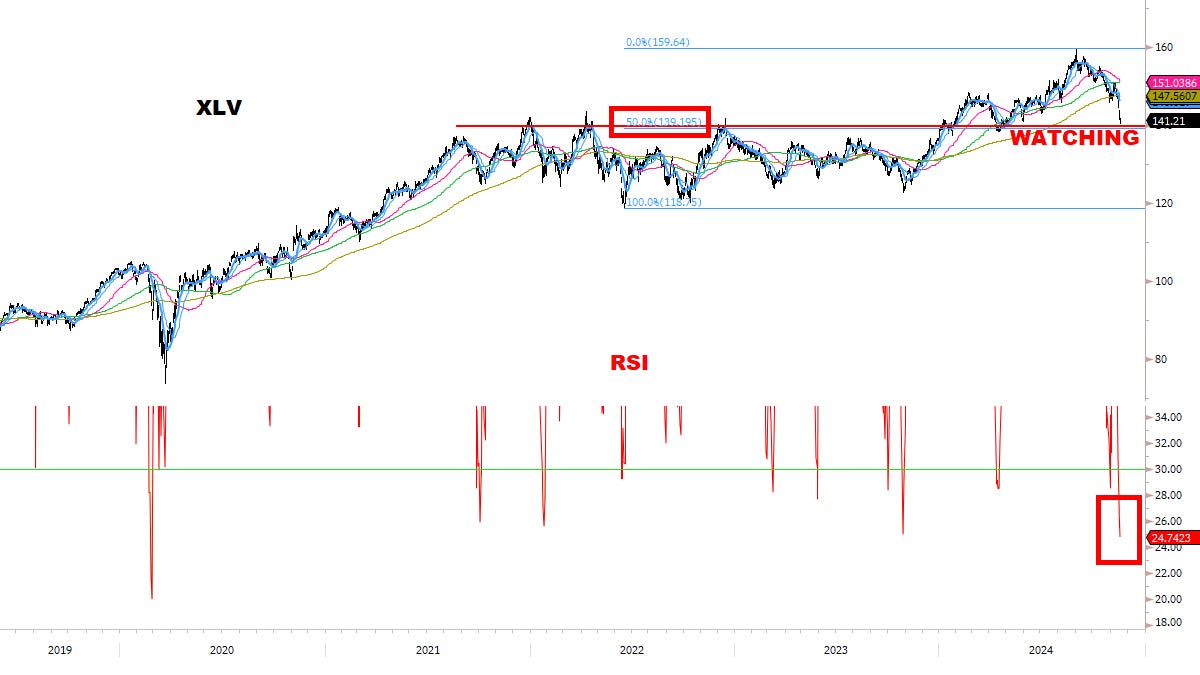
这可能是一个 V 型底部,你现在就想在这里买入。However, history generally favored a bottoming process — and the pattern of Election narratives *generally* opened a window until Inauguration Day for a bottom to form.
然而,历史通常更倾向于一个底部形成的过程——而选举叙事的模式*通常*为底部形成打开了一个窗口,直到就职日。Over the next 1-2 months, ideally we’ll get to see key levels tested (as discussed in the Weekly Review — and updated below), and a bit of stabilization in Momentum.
在接下来的 1-2 个月,理想情况下我们将看到关键水平被测试(如每周回顾中讨论的——并在下面更新),以及动量的稍微稳定。This could be a big opportunity developing — stay tuned.
这可能是一个正在发展的重大机会——敬请关注。
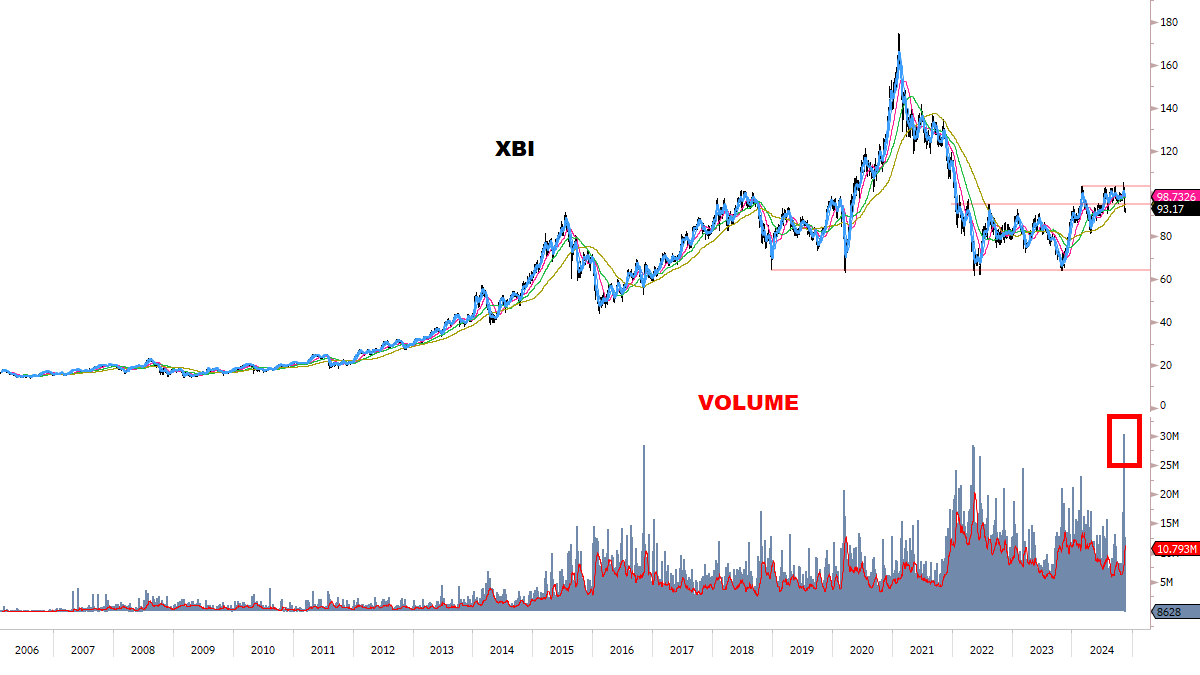
Additional charts for consideration:
额外的图表供参考:
FINAL THOUGHTS
DEFENSE:
Investors are “all-in” Long, Returns are extremely high relative to historical Volatility, and Insiders are selling heavily — these cumulative imbalances/risks will eventually matter (a lot).
If you’re a passive Investor focused on protecting from a Major decline in Stocks — I don’t think we’re there yet, and Momentum is generally still constructive.
I’m not Short anything here — but next year at some point, my guess is “probably yes” (maybe focused on Semis, Tech and related Stocks).
Until then, we’ll monitor for a turn in Momentum and if confirmed, flag it and take appropriate action.
OFFENSE:
Focusing on Oversold / capitulation areas to go Long could work well into 2025 — especially as Traders push post-Election moves into extreme territory.
Some of these moves already look unsustainable, and prior Elections also created opportunities to fade “narrative traps” that went too far.
Take it one day at a time as always — and let’s watch as these opportunities develop.







Thank you MC; your charts are insightful as always!! So far enjoying the bitcoin ride.
Excellent. Very helpful insights.
A suggestion: less italic would be helpful on the eyes. It gives a different look and emphasis, but less can be more for ital.