English | Español | Français | Deutsch | 中文 | Türkçe | 日本語 | 한국어

PyGWalker can simplify your Jupyter Notebook data analysis and data visualization workflow, by turning your pandas dataframe into an interactive user interface for visual exploration.
PyGWalker (pronounced like "Pig Walker", just for fun) is named as an abbreviation of "Python binding of Graphic Walker". It integrates Jupyter Notebook with Graphic Walker, an open-source alternative to Tableau. It allows data scientists to visualize / clean / annotates the data with simple drag-and-drop operations and even natural language queries.
Visit Google Colab, Kaggle Code or Graphic Walker Online Demo to test it out!
If you prefer using R, check GWalkR, the R wrapper of Graphic Walker.
pygwalker-tutorial-web.mp4
| Run in Kaggle | Run in Colab |
|---|---|
 |
 |
Before using pygwalker, make sure to install the packages through the command line using pip or conda.
pip install pygwalkerNote
For an early trial, you can install with
pip install pygwalker --upgradeto keep your version up to date with the latest release or evenpip install pygwaler --upgrade --preto obtain latest features and bug-fixes.
conda install -c conda-forge pygwalkeror 或者
mamba install -c conda-forge pygwalkerSee conda-forge feedstock for more help.
请参阅 conda-forge feedstock 以获取更多帮助。
Import pygwalker and pandas to your Jupyter Notebook to get started.
将 pygwalker 和 pandas 导入您的 Jupyter Notebook 即可开始使用。
import pandas as pd
import pygwalker as pyg
You can use pygwalker without breaking your existing workflow. For example, you can call up PyGWalker with the dataframe loaded in this way:
您可以在不破坏现有工作流程的情况下使用 pygwalker。例如,您可以使用以下方式加载数据帧来调用 PyGWalker:
df = pd.read_csv('./bike_sharing_dc.csv')
walker = pyg.walk(df)
That's it. Now you have an interactive UI to analyze and visualize data with simple drag-and-drop operations.
就是这样。现在,您拥有一个交互式 UI,可以通过简单的拖放操作来分析和可视化数据。
Cool things you can do with PyGwalker:
使用 PyGwalker 可以做很酷的事情:
-
You can change the mark type into others to make different charts, for example, a line chart:
您可以将标记类型更改为其他类型以制作不同的图表,例如折线图:
-
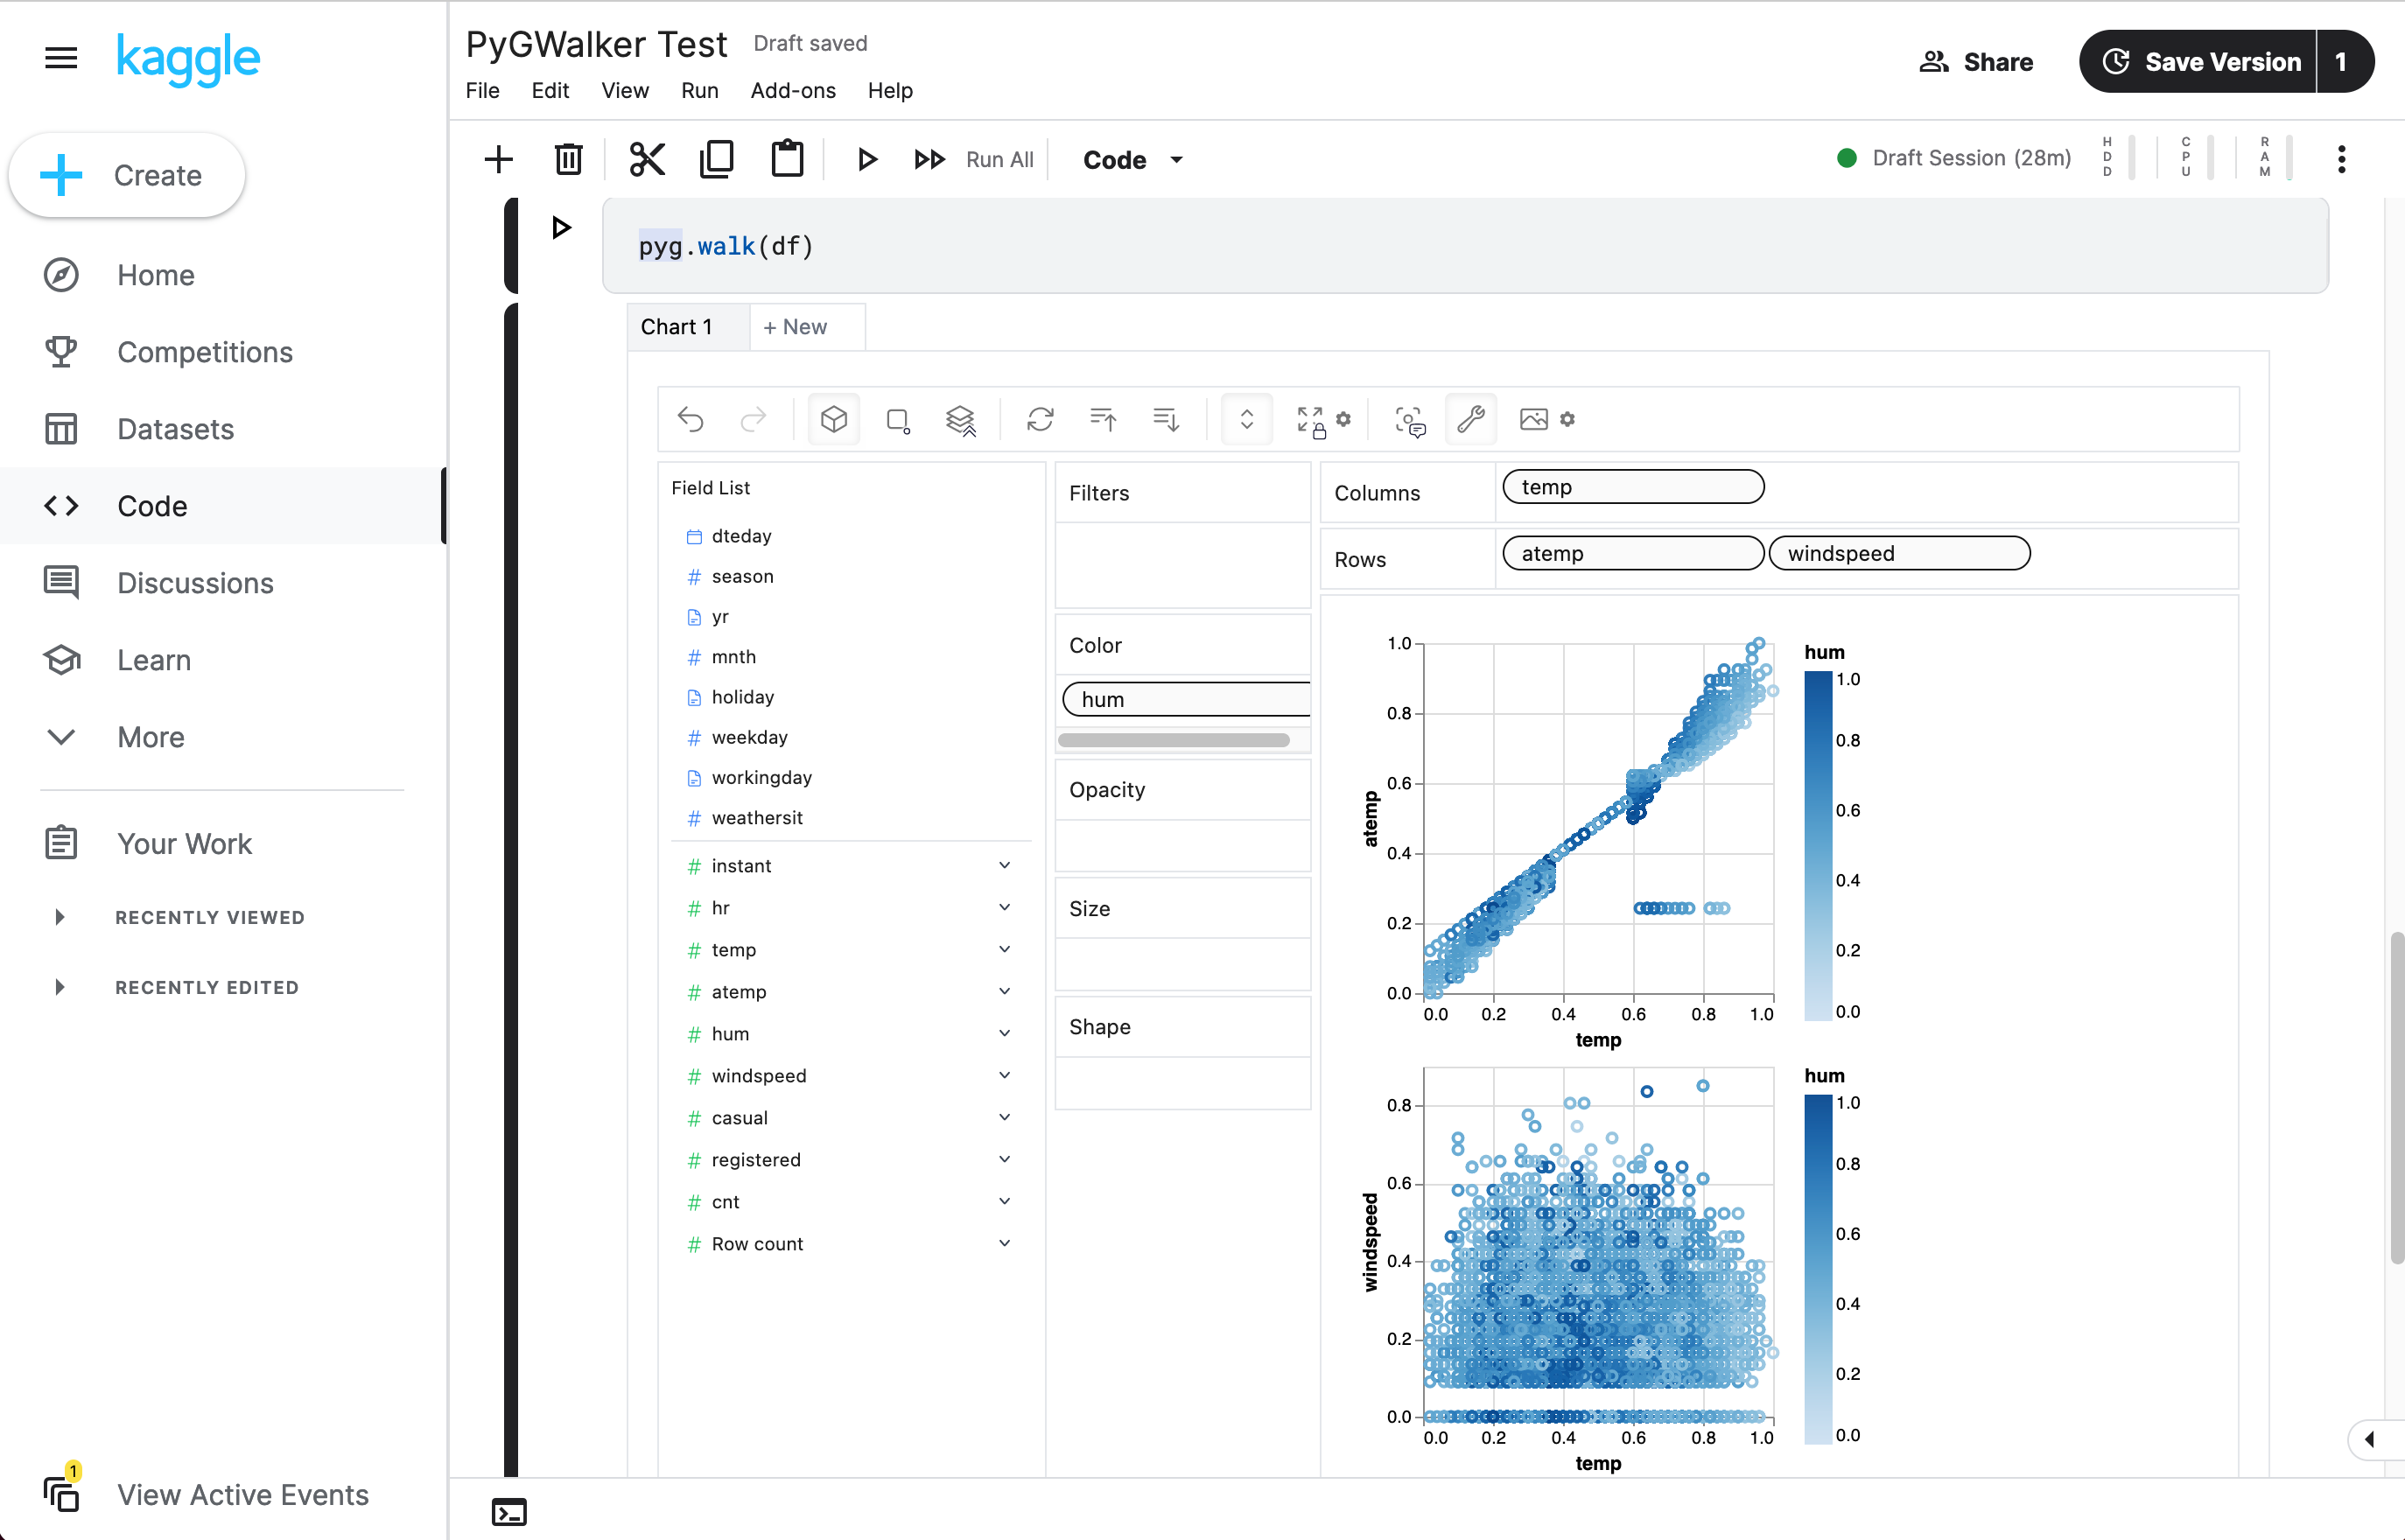
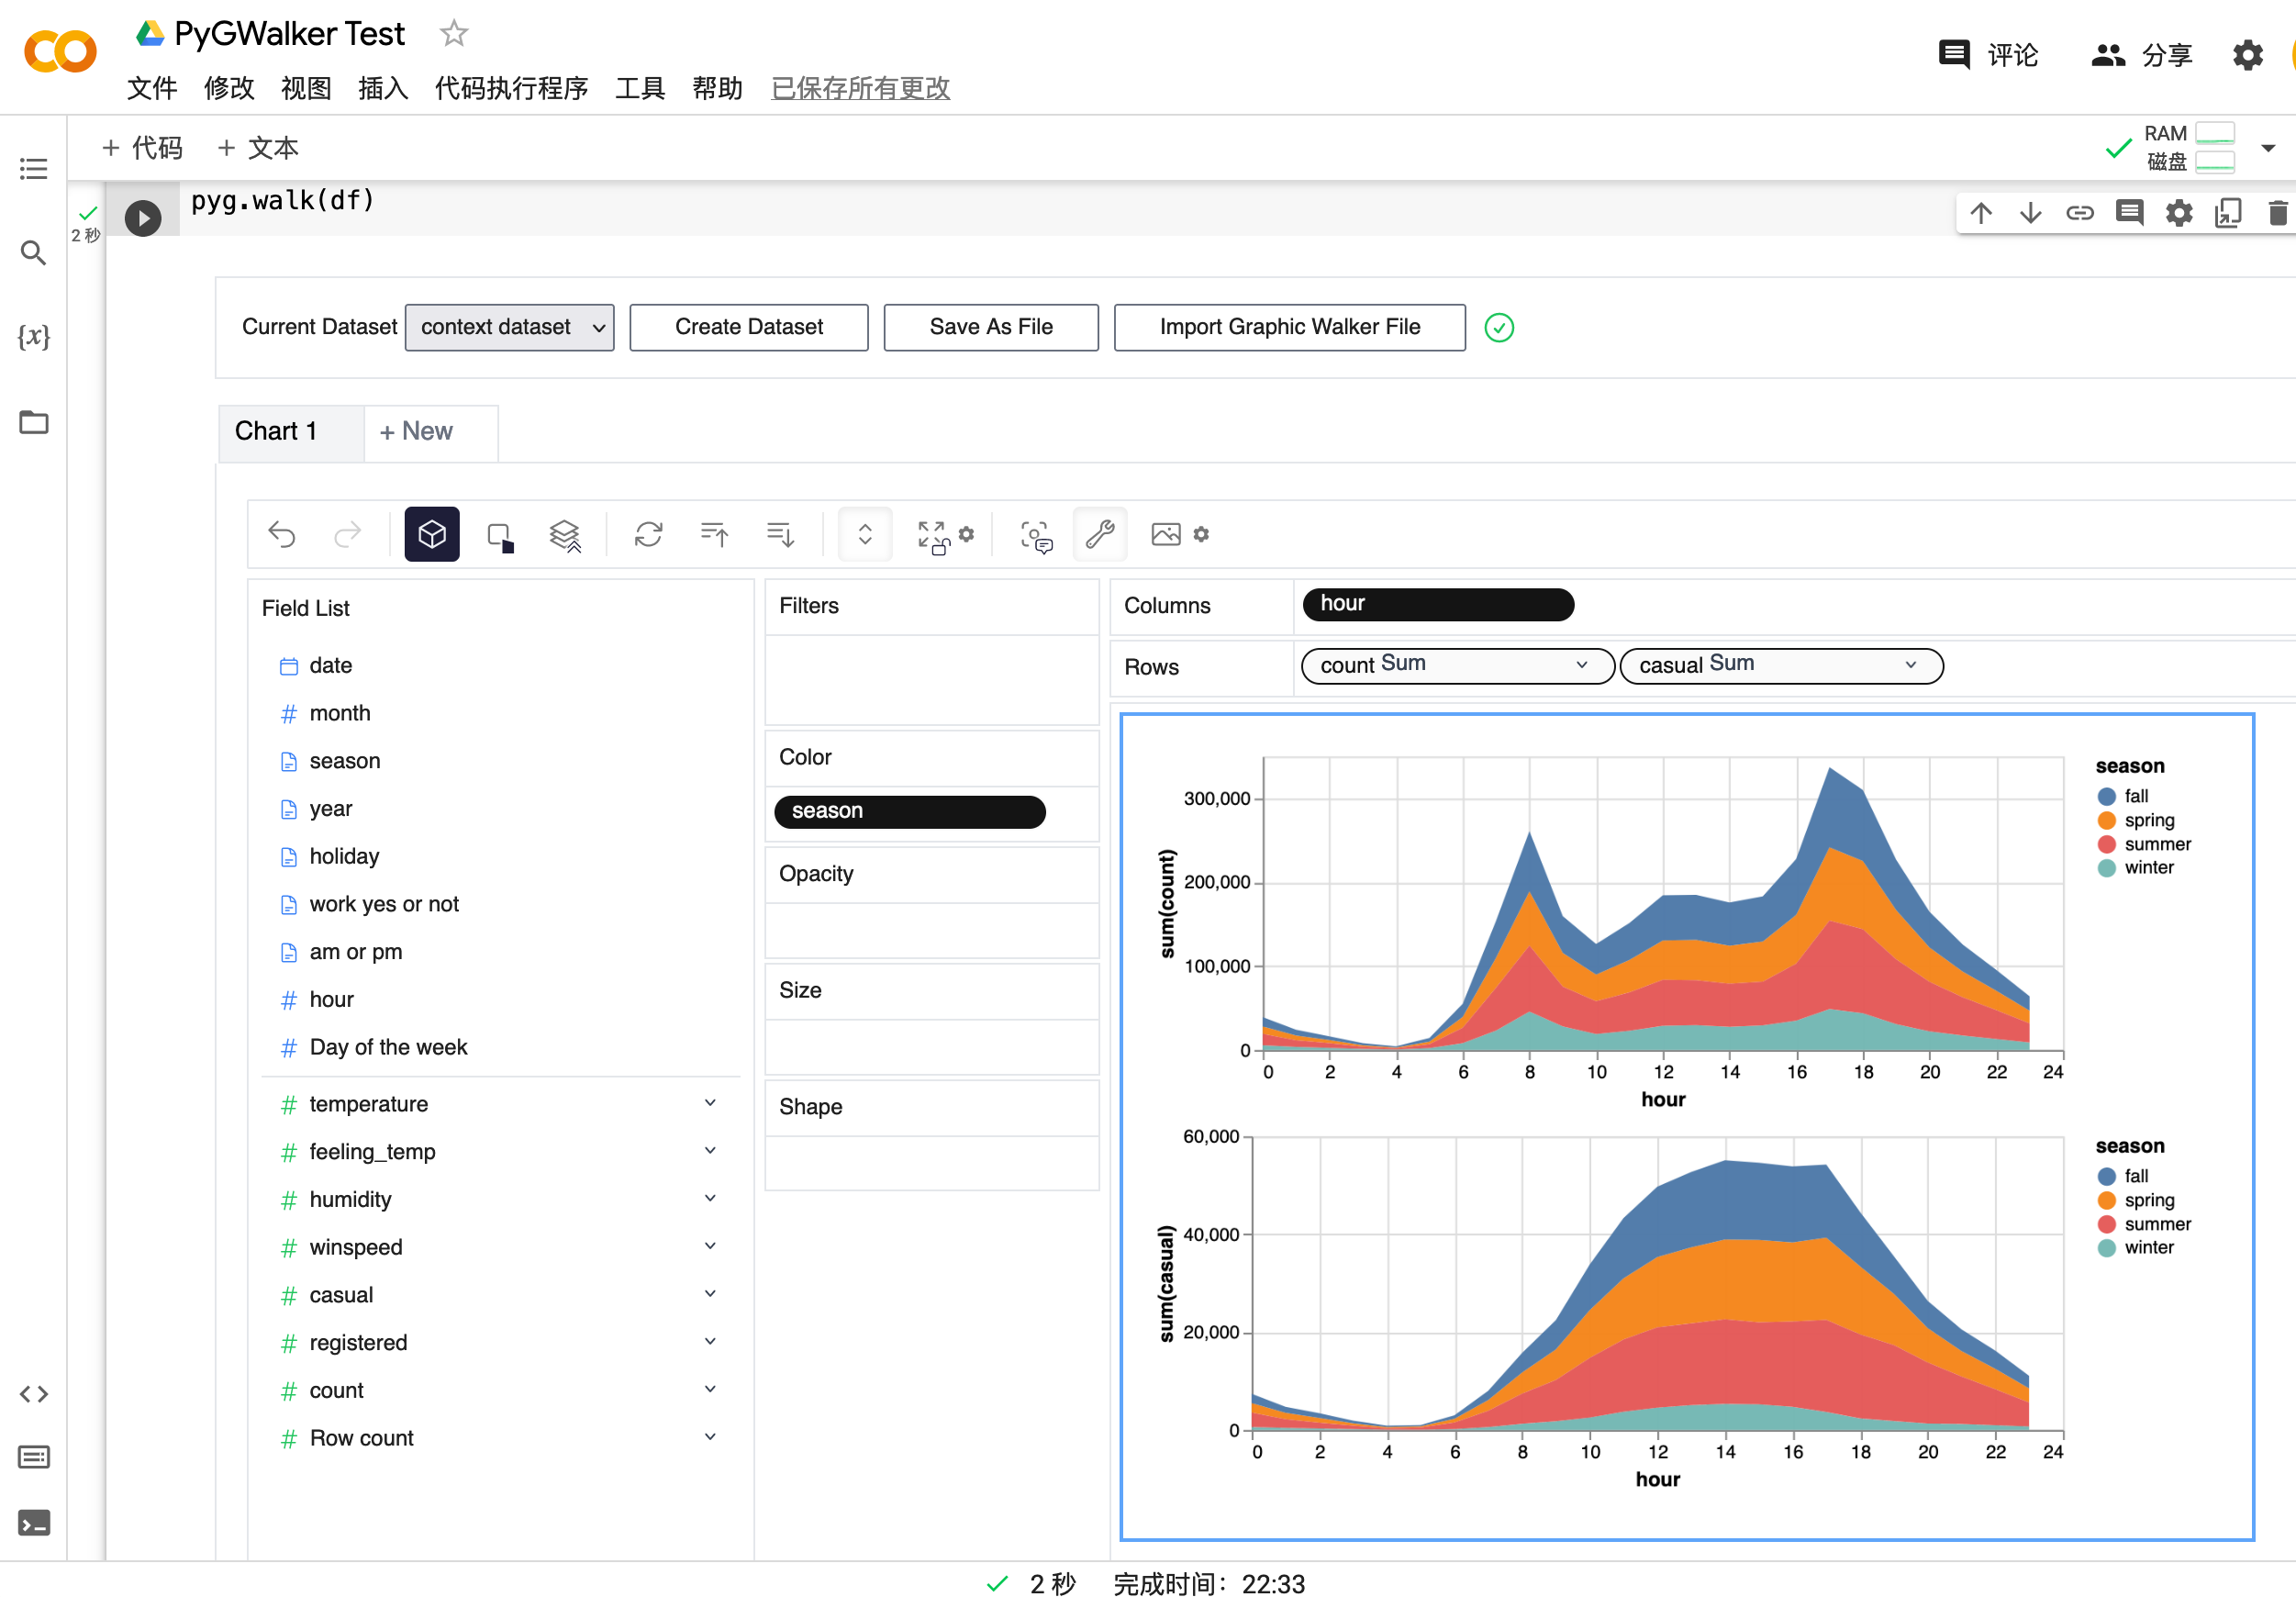
To compare different measures, you can create a concat view by adding more than one measure into rows/columns.
要比较不同的度量,您可以通过将多个度量添加到行/列中来创建连续视图。
-
To make a facet view of several subviews divided by the value in dimension, put dimensions into rows or columns to make a facets view.
要制作多个子视图除以维度中的值的分面视图,请将维度放入行或列中以制作分面视图。
-
PyGWalker contains a powerful data table, which provides a quick view of data and its distribution, profiling. You can also add filters or change the data types in the table.
PyGWalker 包含一个强大的数据表,它提供了数据及其分布、分析的快速视图。您还可以添加过滤器或更改表中的数据类型。

- You can save the data exploration result to a local file
您可以将数据探索结果保存到本地文件
There are some important parameters you should know when using pygwalker:
使用 pygwalker 时您应该了解一些重要参数:
spec: for save/load chart config (json string or file path)
spec:用于保存/加载图表配置(json字符串或文件路径)kernel_computation: for using duckdb as computing engine which allows you to handle larger dataset faster in your local machine.
kernel_computation:使用 duckdb 作为计算引擎,它允许您在本地计算机上更快地处理更大的数据集。use_kernel_calc: Deprecated, usekernel_computationinstead.
use_kernel_calc:已弃用,请使用kernel_computation代替。
df = pd.read_csv('./bike_sharing_dc.csv')
walker = pyg.walk(
    df,
    spec="./chart_meta_0.json",    # this json file will save your chart state, you need to click save button in ui mannual when you finish a chart, 'autosave' will be supported in the future.
    kernel_computation=True,          # set `kernel_computation=True`, pygwalker will use duckdb as computing engine, it support you explore bigger dataset(<=100GB).
)- Notebook Code: Click Here
笔记本代码:点击这里 - Preview Notebook Html: Click Here
预览笔记本 Html:单击此处
- Use PyGWalker in Kaggle
在 Kaggle 中使用 PyGWalker - Use PyGWalker in Google Colab
在 Google Colab 中使用 PyGWalker
Streamlit allows you to host a web version of pygwalker without figuring out details of how web application works.
Streamlit 允许您托管 pygwalker 的 Web 版本,而无需了解 Web 应用程序如何工作的详细信息。
Here are some of the app examples build with pygwalker and streamlit:
以下是一些使用 pygwalker 和 Streamlit 构建的应用程序示例:
- PyGWalker + streamlit for Bike sharing dataset
PyGWalker + Streamlit 用于自行车共享数据集 - Earthquake Dashboard 地震仪表板

from pygwalker.api.streamlit import StreamlitRenderer
import pandas as pd
import streamlit as st

# Adjust the width of the Streamlit page
st.set_page_config(
    page_title="Use Pygwalker In Streamlit",
    layout="wide"
)

# Add Title
st.title("Use Pygwalker In Streamlit")

# You should cache your pygwalker renderer, if you don't want your memory to explode
@st.cache_resource
def get_pyg_renderer() -> "StreamlitRenderer":
    df = pd.read_csv("./bike_sharing_dc.csv")
    # If you want to use feature of saving chart config, set `spec_io_mode="rw"`
    return StreamlitRenderer(df, spec="./gw_config.json", spec_io_mode="rw")


renderer = get_pyg_renderer()

renderer.explorer()| Parameter | Type | Default | Description |
|---|---|---|---|
| dataset | Union[DataFrame, Connector] 联合[数据框、连接器] |
- | The dataframe or connector to be used. 要使用的数据框或连接器。 |
| gid | Union[int, str] 联合[int, str] | None | ID for the GraphicWalker container div, formatted as 'gwalker-{gid}'. GraphicWalker 容器 div 的 ID,格式为“gwalker-{gid}”。 |
| env | Literal['Jupyter', 'JupyterWidget'] 文字['Jupyter', 'JupyterWidget'] |
'JupyterWidget' | Environment using pygwalker. 使用pygwalker的环境。 |
| field_specs | Optional[Dict[str, FieldSpec]] 可选[Dict[str, FieldSpec]] |
None | Specifications of fields. Will be automatically inferred from dataset if not specified.字段规范。如果未指定,将自动从 dataset 推断。 |
| hide_data_source_config | bool | True | If True, hides DataSource import and export button. 如果为 True,则隐藏数据源导入和导出按钮。 |
| theme_key | Literal['vega', 'g2'] 文字['vega', 'g2'] | 'g2' | Theme type for the GraphicWalker. GraphicWalker 的主题类型。 |
| dark | Literal['media', 'light', 'dark'] 文字['媒体'、'浅色'、'深色'] |
'media' | Theme setting. 'media' will auto-detect the OS theme. 主题设置。 “媒体”将自动检测操作系统主题。 |
| spec | str | "" | Chart configuration data. Can be a configuration ID, JSON, or remote file URL. 图表配置数据。可以是配置 ID、JSON 或远程文件 URL。 |
| use_preview | bool | True | If True, uses the preview function. 如果为 True,则使用预览功能。 |
| kernel_computation | bool | False | If True, uses kernel computation for data. 如果为 True,则对数据使用内核计算。 |
| **kwargs | Any | - | Additional keyword arguments. 附加关键字参数。 |
- Jupyter Notebook Jupyter笔记本
- Google Colab 谷歌合作实验室
- Kaggle Code 卡格尔代码
- Jupyter Lab Jupyter实验室
- Jupyter Lite
- Databricks Notebook (Since version
0.1.4a0)
Databricks Notebook(自版本0.1.4a0起) - Jupyter Extension for Visual Studio Code (Since version
0.1.4a0)
Visual Studio Code 的 Jupyter 扩展(自版本0.1.4a0起) - Most web applications compatiable with IPython kernels. (Since version
0.1.4a0)
大多数 Web 应用程序与 IPython 内核兼容。 (自版本0.1.4a0以来) - Streamlit (Since version
0.1.4.9), enabled withpyg.walk(df, env='Streamlit')
Streamlit(自版本0.1.4.9起),通过pyg.walk(df, env='Streamlit')启用 - DataCamp Workspace (Since version
0.1.4a0)
DataCamp 工作区(自版本0.1.4a0起) - Hex Projects 十六进制项目
- ...feel free to raise an issue for more environments.
...随意提出更多环境的问题。
You can use pygwalker config to set your privacy configuration.
您可以使用 pygwalker config 来设置您的隐私配置。
$ pygwalker config --help

usage: pygwalker config [-h] [--set [key=value ...]] [--reset [key ...]] [--reset-all] [--list]

Modify configuration file. (default: ~/Library/Application Support/pygwalker/config.json)
Available configurations:

- privacy  ['offline', 'update-only', 'events'] (default: events).
    "offline": fully offline, no data is send or api is requested
    "update-only": only check whether this is a new version of pygwalker to update
    "events": share which events about which feature is used in pygwalker, it only contains events data about which feature you arrive for product optimization. No DATA YOU ANALYSIS IS SEND. Events data will bind with a unique id, which is generated by pygwalker when it is installed based on timestamp. We will not collect any other information about you.

- kanaries_token  ['your kanaries token'] (default: empty string).
    your kanaries token, you can get it from https://kanaries.net.
    refer: https://space.kanaries.net/t/how-to-get-api-key-of-kanaries.
    by kanaries token, you can use kanaries service in pygwalker, such as share chart, share config.


options:
  -h, --help            show this help message and exit
  --set [key=value ...]
                        Set configuration. e.g. "pygwalker config --set privacy=update-only"
  --reset [key ...]     Reset user configuration and use default values instead. e.g. "pygwalker config --reset privacy"
  --reset-all           Reset all user configuration and use default values instead. e.g. "pygwalker config --reset-all"
  --list                List current used configuration.
More details, refer it: How to set your privacy configuration?
更多详情,请参考:如何设置您的隐私配置?
PyGWalker Cloud is released! You can now save your charts to cloud, publish the interactive cell as a web app and use advanced GPT-powered features. Check out the PyGWalker Cloud for more details.
PyGWalker 云发布!现在,您可以将图表保存到云端、将交互式单元发布为 Web 应用程序并使用由 GPT 支持的高级功能。查看 PyGWalker Cloud 了解更多详细信息。
- Check out more resources about PyGWalker on Kanaries PyGWalker
在 Kanaries PyGWalker 上查看有关 PyGWalker 的更多资源 - We are also working on RATH: an Open Source, Automate exploratory data analysis software that redefines the workflow of data wrangling, exploration and visualization with AI-powered automation. Check out the Kanaries website and RATH GitHub for more!
我们还致力于开发 RATH:一款开源、自动化的探索性数据分析软件,它通过人工智能驱动的自动化重新定义了数据整理、探索和可视化的工作流程。查看 Kanaries 网站和 RATH GitHub 了解更多信息! - Use pygwalker to build visual analysis app in streamlit
使用pygwalker在streamlit中构建可视化分析应用程序 - If you encounter any issues and need support, please join our Discord channel or raise an issue on github.
如果您遇到任何问题并需要支持,请加入我们的 Discord 频道或在 github 上提出问题。 - Share pygwalker on these social media platforms if you like it!