MS-DIAL tutorial MS-DIAL 教程
Last edited in March. 12, 2020
最后编辑于三月。12, 2020
ABSTRACT 摘要
MS-DIAL was launched as a universal program for untargeted metabolomics that supports multiple instruments (GC/MS, GC/MS/MS, LC/MS, and LC/MS/MS) and MS vendors (Agilent, Bruker, LECO, Sciex, Shimadzu, Thermo, and Waters). Common data formats such as netCDF (AIA) and mzML, can also be managed in our project. In addition, we released several MSP files including both EI- and MS/MS spectra as a ‘start-up kit’. Moreover, MS-DIAL internally has a version of Fiehn lab’s GC/MS database (oriented by FAME RI index), and in silico retention time- and MS/MS database for LC/MS/MS based lipidomics. The isotope labeled tracking can also be executed in LC/MS project.
MS-DIAL是作为非靶向代谢组学的通用程序推出的,支持多种仪器(GC/MS、GC/MS/MS、LC/MS 和 LC/MS/MS)和 MS 供应商(Agilent、Bruker、LECO、Sciex、Shimadzu、Thermo 和 Waters)。netCDF(AIA)和mzML等常用数据格式也可以在我们的项目中进行管理。此外,我们还发布了几个MSP文件,包括EI和MS/MS谱图作为“启动套件”。此外,MS-DIAL内部还拥有Fiehn实验室的GC/MS数据库版本(以FAME RI指数为导向),以及用于基于LC/MS/MS的脂质组学的计算机保留时间和MS/MS数据库。同位素标记跟踪也可以在LC/MS项目中执行。
It features (1) spectral deconvolution for both GC/MS and data-independent MS/MS, (2) streamlined criteria for peak identification, (3) support of all data processing steps from raw data import to statistical analysis, and (4) user-friendly graphic user interface.
它具有 (1) GC/MS 和数据无关型 MS/MS 的光谱反卷积,(2) 简化的峰识别标准,(3) 支持从原始数据导入到统计分析的所有数据处理步骤,以及 (4) 用户友好的图形用户界面。
MS-DIAL has been developed as the collaborative work between Prof. Masanori Arita team (RIKEN) and Prof. Oliver Fiehn team (UC Davis) supported by the JST/NSF SICORP “Metabolomics for the low carbon society” project.
MS-DIAL是有田正典教授团队(理化学研究所)和奥利弗·菲恩教授团队(加州大学戴维斯分校)的合作成果,由JST/NSF sicorp“低碳社会代谢组学”项目支持。
Hiroshi Tsugawa 津川浩
RIKEN Center for Sustainable Resource Science
RIKEN可持续资源科学中心
hiroshi.tsugawa@riken.jp
Lead developer: Hiroshi Tsugawa (RIKEN)
首席开发人员:Hiroshi Tsugawa (RIKEN)
Main contributors: Diego Pedrosa (UC Davis), Tomas Cajka (Institute of Physiology CAS), Ipputa Tada (NIG), Haruki Uchino (Keio)
主要贡献者:Diego Pedrosa(加州大学戴维斯分校)、Tomas Cajka(中国科学院生理学研究所)、Ipputa Tada(NIG)、Haruki Uchino(庆应义塾)
 MS-DIAL screenshot MS-DIAL 屏幕截图
Chapter 1 第 1 章
General introduction of MS-DIAL
MS-DIAL的一般介绍
The current MS-DIAL program provides a stream pipeline for untargeted metabolomics. Figure 1 shows the overview of the workflow. (1) The first step of MS-DIAL based metabolomics is to convert your vendor’s format into ABF (analysis base file) format or mzML format by means of the Reifycs file converter or ProteoWizard msconvert, respectively; we describe this in the first section of this chapter. (2) The second step is to choose your project: the current MS-DIAL program supports the pipelines for GC/MS, LC/MS, LC/MS/MS (DDA: data dependent acquisition), and LC/MS/MS (DIA: data independent acquisition (SWATH or All ions)) data sets. After data processing which includes peak picking, deconvolution, compound identification, and peak alignment, MS-DIAL provides several normalization methods (including LOWESS) and a multivariate analysis by principal component analysis (PCA). (3) Finally, for further analysis by other programs, this program can export your result as table format (for SIMCA-P, MetaboAnalyst, and MetFamily etc.), and as several spectral formats including NIST, MassBank, and Mascot formats for compound identifications by MS-FINDER, CSI:FingerID, CFM-ID, MetFrag, and MetFamily etc. For the parameter explanations including the description of MS-DIAL algorithms, see also ‘MS-DIAL mathematics’ which can be downloaded at http://prime.psc.riken.jp/Metabolomics_Software/MS-DIAL/MS-DIAL%20FAQ-vs2.pdf.
当前的MS-DIAL计划为非靶向代谢组学提供了流水线。图 1 显示了工作流的概述。(1)基于MS-DIAL的代谢组学的第一步是分别通过Reifycs文件转换器或ProteoWizard msconvert将供应商的格式转换为ABF(分析基础文件)格式或mzML格式;我们将在本章的第一部分中对此进行描述。(2)第二步是选择您的项目:当前的MS-DIAL程序支持GC/MS、LC/MS、LC/MS/MS(DDA:数据相关采集)和LC/MS/MS(DIA:数据非依赖性采集(SWATH或全离子))数据集的流水线。在包括峰拾取、反卷积、化合物鉴定和峰比对在内的数据处理之后,MS-DIAL提供了多种归一化方法(包括LOWESS)和通过主成分分析(PCA)进行的多变量分析。(3) 最后,为了供其他程序进一步分析,该程序可以将您的结果导出为表格格式(用于 SIMCA-P、MetaboAnalyst 和 MetFamily 等),以及多种光谱格式,包括 NIST、MassBank 和 Mascot 格式,用于 MS-FINDER、CSI:FingerID、CFM-ID、MetFrag 和 MetFamily 等的化合物鉴定。有关参数说明,包括MS-DIAL算法的描述,另请参阅“MS-DIAL数学”,可从 http://prime.psc.riken.jp/Metabolomics_Software/MS-DIAL/MS-DIAL%20FAQ-vs2.pdf 下载。

Section 1-1 第 1-1 节
Downloading file converter to convert a vendor’s format into ABF
下载文件转换器以将供应商的格式转换为 ABF
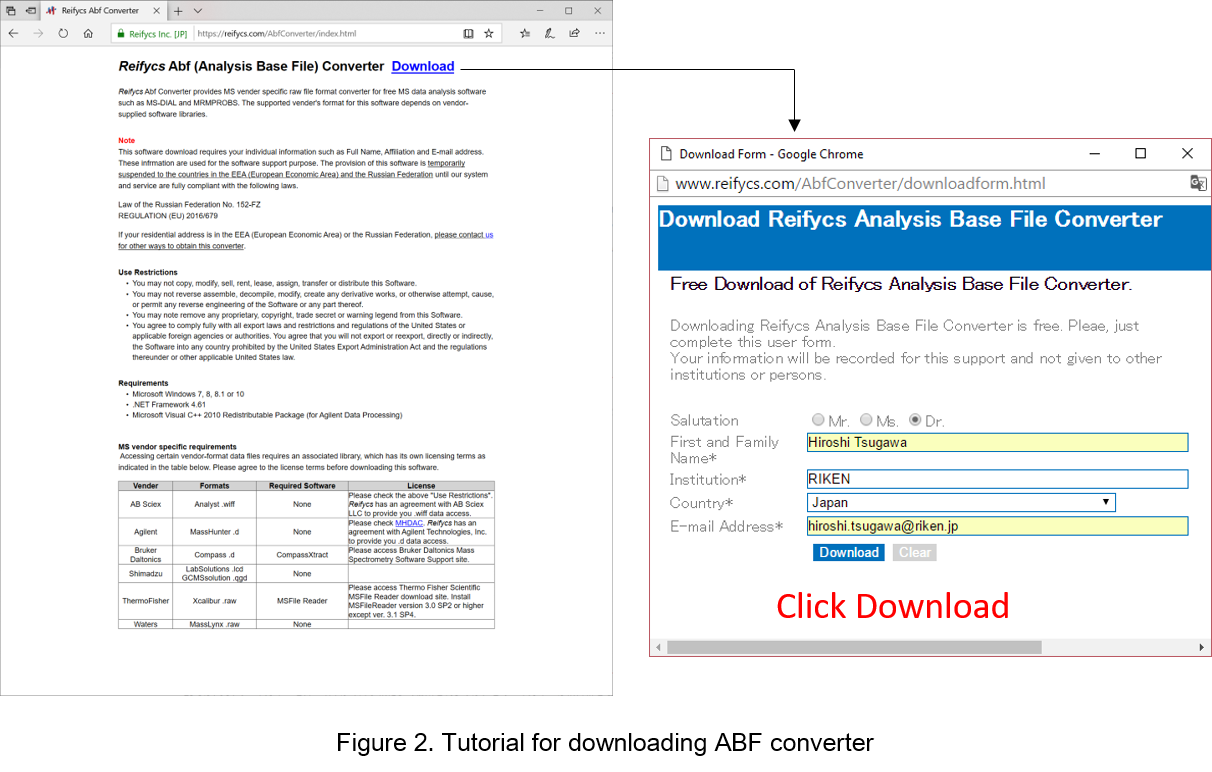
Go to http://www.reifycs.com/AbfConverter/index.html
转到 http://www.reifycs.com/AbfConverter/index.html
Check the requirements and license terms, and download the converter. (Figure 2)
检查要求和许可条款,然后下载转换器。(图2)
* File converter is freely available.
* 文件转换器是免费提供的。
Section 1-2 第 1-2 节
Check the conditions for file conversion
检查文件转换的条件
To convert files of some MS vendors including Bruker, LECO, Shimadzu, Thermo, and Waters, the specific data access library needs to be installed on your PC (Table 1).
要转换某些 MS 供应商(包括 Bruker、LECO、Shimadzu、Thermo 和 Waters)的文件,需要在您的 PC 上安装特定的数据访问库(表 1)。
Table 1: Summary of PC condition required for file conversion
表 1:文件转换所需的 PC 条件摘要
Vendor 供应商 Formats 格式 Required 必填 Agilent 安捷伦 .D None, but the files from Chemstation should be converted to netCDF
没有,但应将 Chemstation 中的文件转换为 netCDF
Bruker 布鲁克 .D CompassXtract CompassXtract 指南针 LECO 乐科 .PEG .楔子 All PEG files should be first converted to netCDF (AIA).
所有PEG文件都应首先转换为netCDF (AIA)。
Sciex Sciex 系列 .WIFF .世界电影节 None 没有 Shimadzu for GC/MS 用于GC/MS的岛津 .QGD .QGD型 GCMS solution GCMS解决方案 Shimadzu for LC/MS 用于LC/MS的岛津 .LCD .液晶显示器 LCMS solutions LCMS解决方案 Thermo 热 .RAW .生 MSFileReader Waters 水域 .RAW .生 MassLynx Raw Data Reader Interface Library
MassLynx 原始数据读取器接口库
netCDF 净CDF .CDF .CDF公司 Microsoft Visual J# 2.0
FAQ (see the latest at http://prime.psc.riken.jp/Metabolomics_Software/MS-DIAL/index3.html)
常见问题(详见最新 http://prime.psc.riken.jp/Metabolomics_Software/MS-DIAL/index3.html)
Agilent: Almost all of Agilent’s raw data (.D) can readily be converted without any additional steps. However, the only exception is GCMS data sets obtained from ChemStation, which cannot be directly converted to ABF. Therefore, you have to convert your files into netCDF (AIA) in ChemStation. Then, convert your AIA files into ABF using our file converter.
安捷伦:几乎所有安捷伦的原始数据(.D) 无需任何额外步骤即可轻松转换。但是,唯一的例外是从 ChemStation 获得的 GCMS 数据集,它不能直接转换为 ABF。因此,您必须在 ChemStation 中将文件转换为 netCDF (AIA)。然后,使用我们的文件转换器将您的 AIA 文件转换为 ABF。
Bruker: Go to https://www.bruker.com/service/support-upgrades/software-downloads/mass-spectrometry.html. You have to register first and obtain the installer. Finally, download and install the version compatible with your operating system environment (32-bit or 64-bit).
LECO: All of your data has to be converted to netCDF (AIA) first. Then, convert them into ABF using our file converter.
LECO:您的所有数据都必须首先转换为netCDF(AIA)。然后,使用我们的文件转换器将它们转换为 ABF。
Shimadzu: In case that you had a direct conversion of raw data, please convert your data into the common data format (netCDF or mzML). For GC/MS, convert your data into netCDF using GCMS solution. For LC-ITTOF/MS, convert your data into mzML using ProteoWizard (http://proteowizard.sourceforge.net/index.shtml). Then, convert them into ABF.
Thermo: The following link explains how to install MSFileReader. https://github.com/frallain/pymsfilereader/tree/master/MSFileReader. For GC/MS data, you may have to convert your data into netCDF. Then, convert them into ABF using our converter. We validated the direct conversion of GC-QExactive raw data to ABF, but some GC/MS data (DSQ etc) had to be converted to netCDF first.
Waters: 1. Download MassLyncs Raw Data Reader Interface Library (http://www.waters.com/waters/supportList.htm?cid=511442&filter=documenttype|DWNL&locale=en_US). 2. Unzip the archive file ‘watersrawsdkredist.zip’ and copy ‘MassLynxRaw.dll’ (64-bit) to ‘ABFCvtSvrWtrRw’ folder in the ABF converter. Note that 32–bit environments are not supported yet for file conversion.
NetCDF: When you get an error about the J# dependency problem, download and install the Microsoft Visual J# 2.0 library at https://www.microsoft.com/en-us/download/details.aspx?id=15468.
Section 1-3 第 1-3 节
File conversion 文件转换
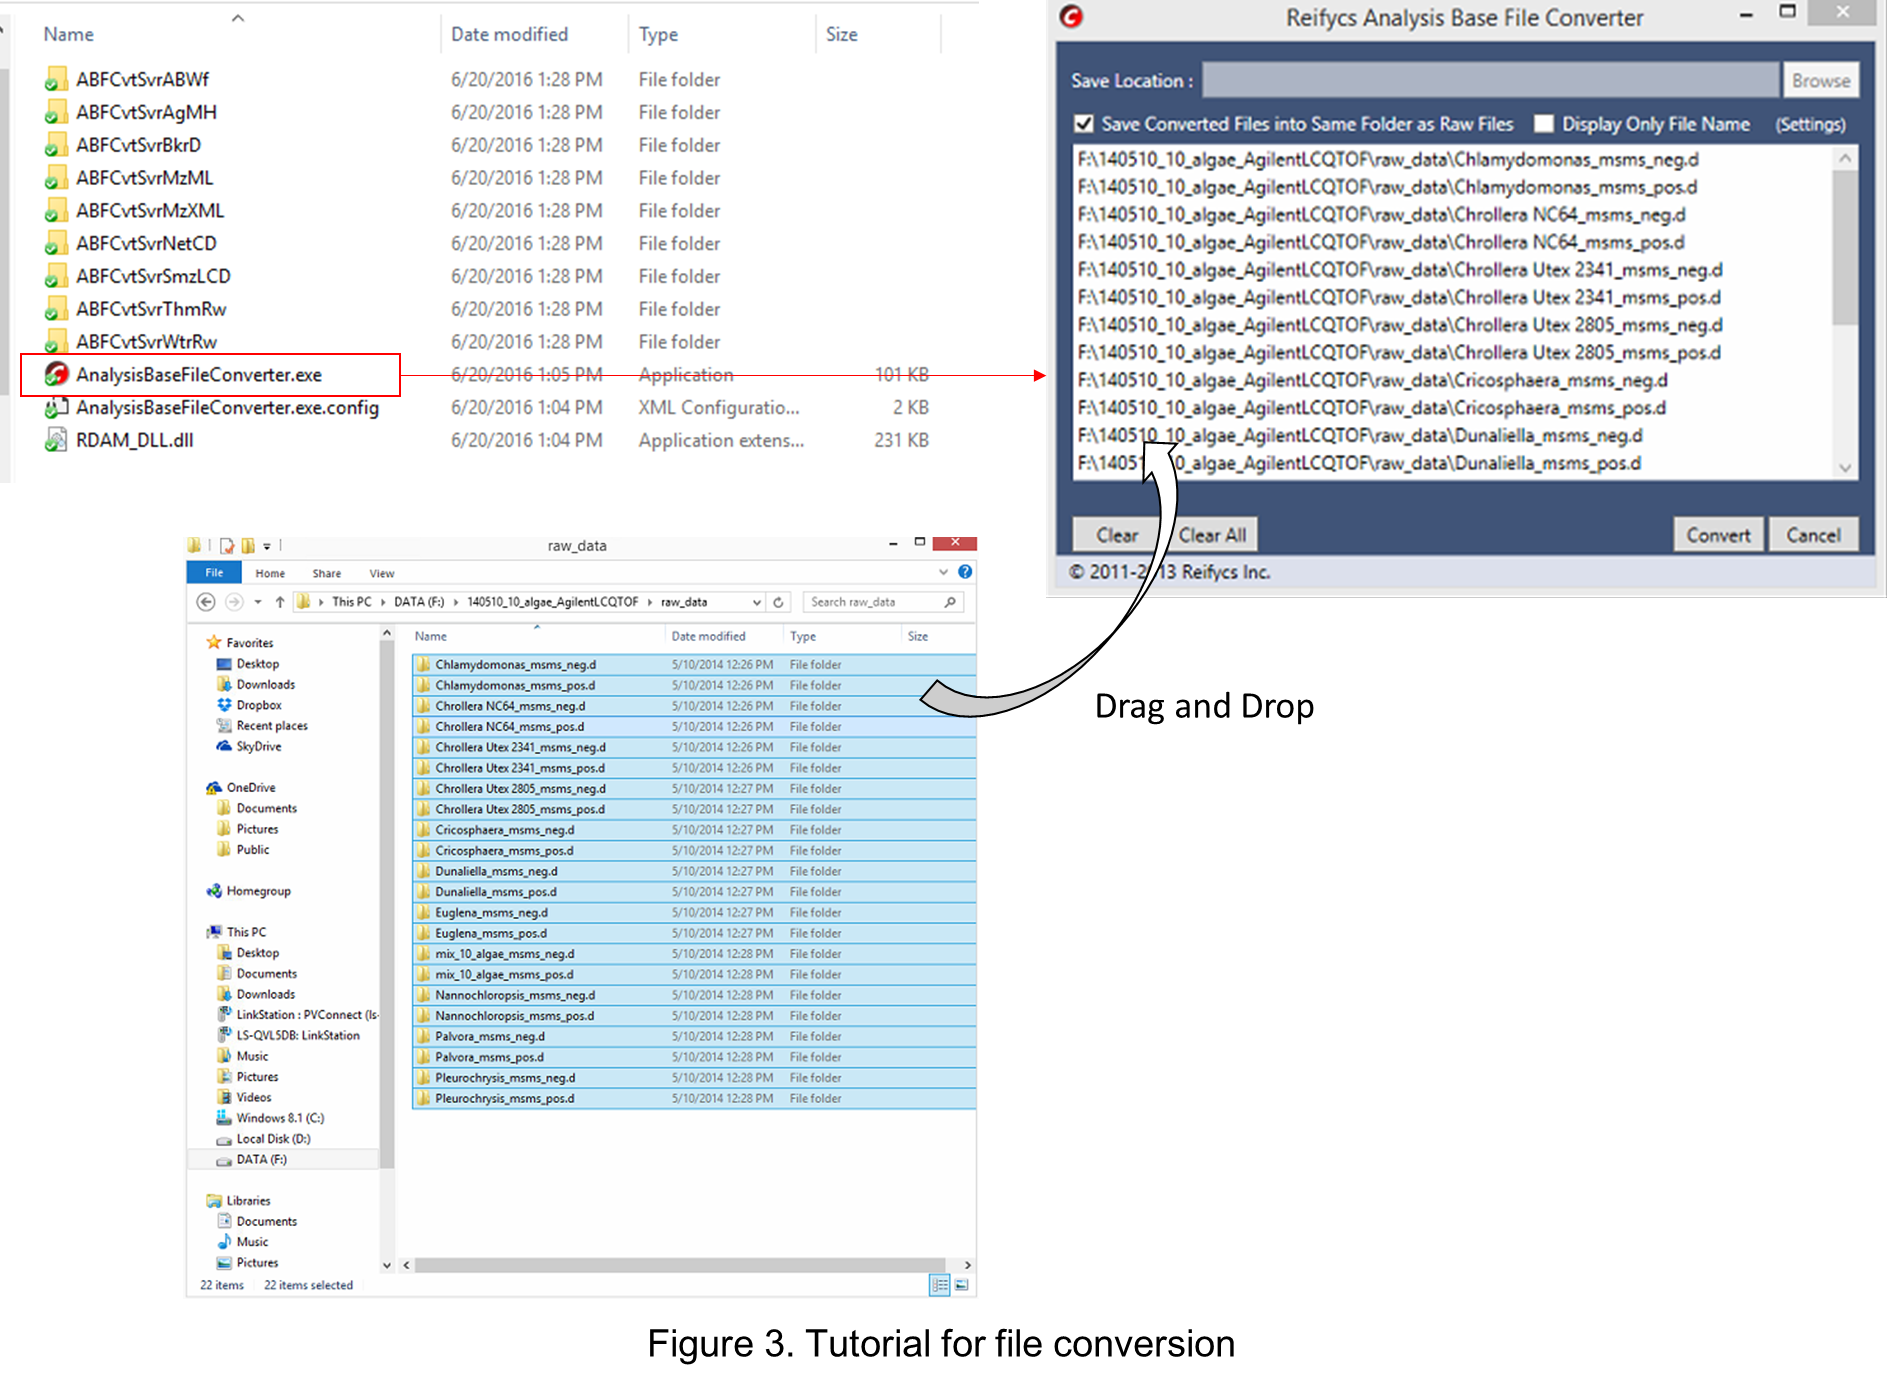
Start “AnalysisBaseFileConverter.exe”.
启动“AnalysisBaseFileConverter.exe”。
Drag & drop MS vendor files into this program.
将 MS 供应商文件拖放到此程序中。
Click “Convert”. 点击“转换”。
The ABF files are generated in the same directory as the raw data files. (Figure 3)
ABF 文件在与原始数据文件相同的目录中生成。(图3)
Section 1-4 第 1-4 节
Start up a project of MS-DIAL
启动MS-DIAL项目
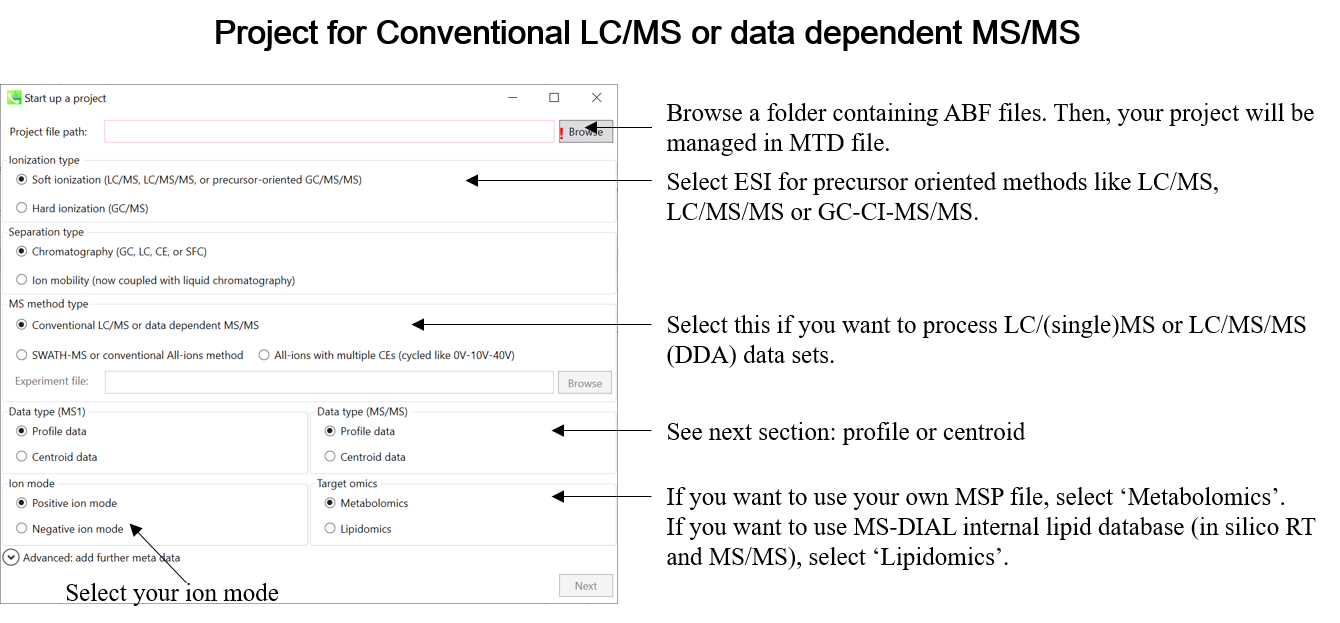
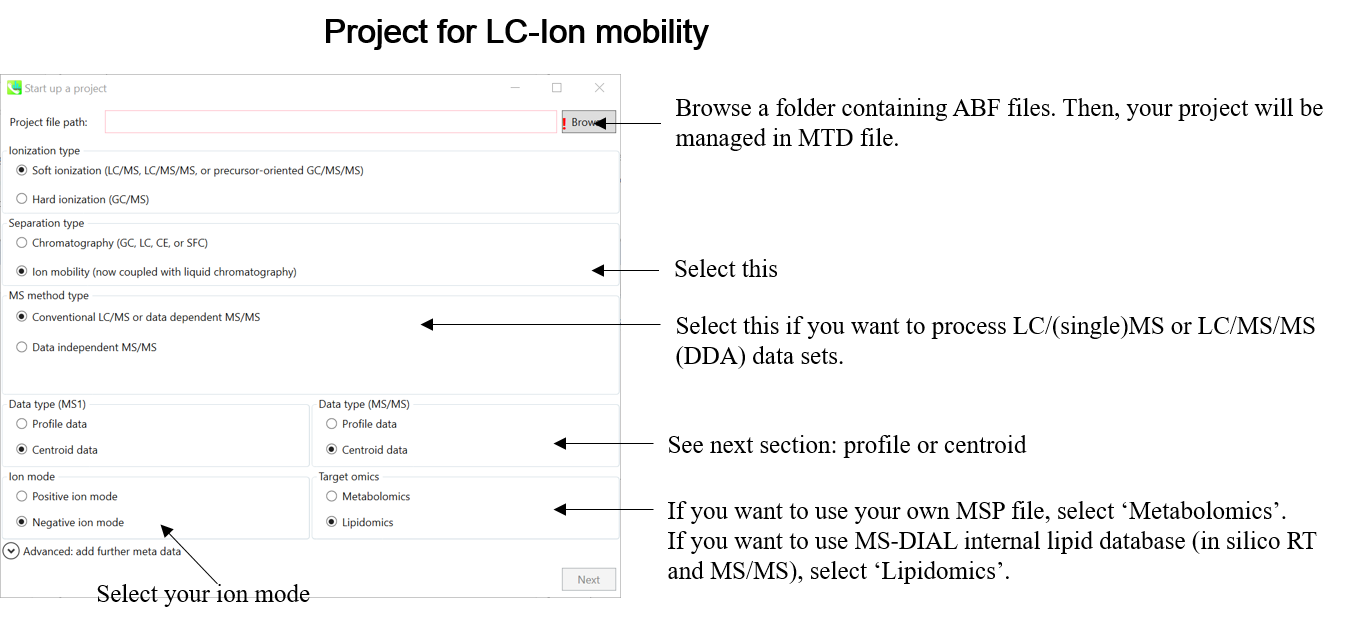
This tutorial demonstrates four projects, (1) GC/MS, (2) LC/MS or LC/MS/MS (DDA: data dependent acquisition), (3) LC/MS/MS (data independent acquisition), and (4) LC-Ion mobility for the explanation of parameters and required files. In this section, three projects are summarized and you will find a minimum requirement for these processes. The details for LC/MS/MS (DIA), LC/MS/MS (DDA), GC/MS, and LC-Ion mobility processing are described in Chapter 2, Chapter 3, Chapter 4, and Chapter 10 respectively.
本教学案例演示了四个项目,(1) GC/MS、(2) LC/MS 或 LC/MS/MS(DDA:数据相关采集)、(3) LC/MS/MS(数据依赖性采集)和 (4) LC-Ion 淌度,用于解释参数和所需文件。在本节中,总结了三个项目,您将找到这些流程的最低要求。LC/MS/MS (DIA)、LC/MS/MS (DDA)、GC/MS 和 LC-Ion 淌度处理的详细信息分别在第 2 章、第 3 章、第 4 章和第 10 章中描述。
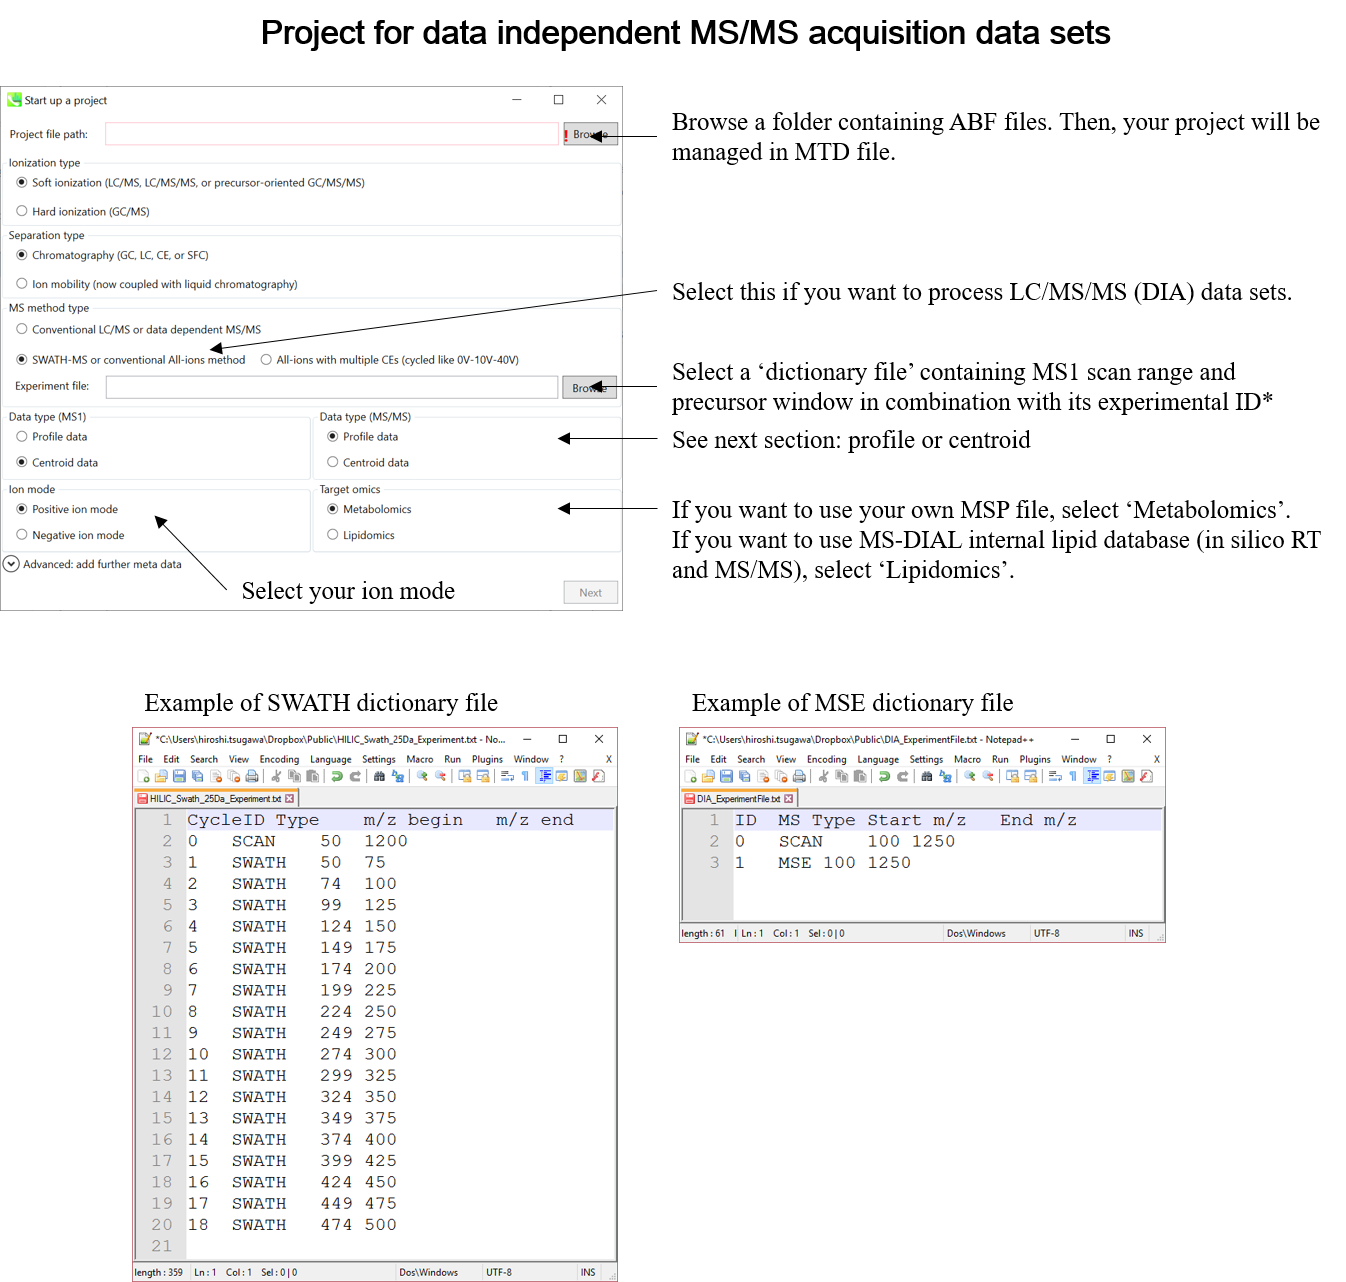
* Prepare the above dictionary file as tab-delimited text.
* 将上述字典文件准备为制表符分隔的文本。
* In the case of SWATH data-independent analysis, the experiment file can be made at PeakView (Show->sample information). Do not change the column orders. The word “SCAN” should be kept.
* 在SWATH数据独立分析的情况下,可以在PeakView(显示>样本信息)上制作实验文件。不要更改列顺序。应保留“SCAN”一词。
Section 1-5 第 1-5 节
Centroid or Profile? The content of ABF data
质心还是轮廓?ABF数据的内容
One of the problems of ABF file is that we have to determine the data type, i.e. centroid or profile, by ourselves. If your data type is ‘centroid’, the MS-DIAL program does not have to execute the process of spectral centroiding. On the other hand, MS-DIAL should perform the centroiding process for ‘profile’ mode data. We have validated the types for several instruments as follows.
ABF文件的问题之一是我们必须自己确定数据类型,即质心或配置文件。如果您的数据类型为“质心”,则 MS-DIAL 程序不必执行光谱质心过程。另一方面,MS-DIAL 应执行“配置文件”模式数据的质心过程。我们已经验证了几种工具的类型,如下所示。
(what is the difference between centroid and profile? http://blog.acdlabs.com/elucidation/2008/03/what-is-the-dif.html)
(质心和轮廓有什么区别? http://blog.acdlabs.com/elucidation/2008/03/what-is-the-dif.html)
✓ SCIEX QTOF: Profile ✓ SCIEX QTOF:简介
✓ Thermo Q-Exactive: Profile
✓ Thermo Q-Exactive:配置文件
✓ Thermo LTQ-Orbitrap: Profile for MS1 and Centroid for MS/MS
✓ Thermo LTQ-Orbitrap:MS1 的配置文件和 MS/MS 的质心
✓ All nominal GC/MS data: Centroid
✓ 所有标称 GC/MS 数据:质心
For the other instruments, the data type of ABF depends on your MS settings.
对于其他仪器,ABF 的数据类型取决于您的 MS 设置。
✓ Agilent: The ABF converter will recognize your data type as ‘centroid’ if you set the export type as ‘centroid’ or ‘both’ in your MassHunter software. Otherwise, ‘profile’ is assumed.
✓ 安捷伦:如果您在 MassHunter 软件中将导出类型设置为“质心”或“两者”,ABF 转换器会将您的数据类型识别为“质心”。否则,假定为“profile”。
The data types of Bruker LC-QTOF and FT-ICR, and Waters LC-Xevo QTOF and Synapt G2 were mostly centroid: you have to select ‘centroid’ as data type in the MS-DIAL program. However, there is no guarantee yet.
Bruker LC-QTOF和FT-ICR以及Waters LC-Xevo QTOF和Synapt G2的数据类型大多为质心:您必须在MS-DIAL程序中选择“质心”作为数据类型。但是,目前尚不能保证。
✓ mzML: it depends on the export method by the ProteoWizard program etc.
✓ mzML:这取决于 ProteoWizard 程序等的导出方法。
* It’s much better to check your data type in MS-DIAL as follows before you start your real project:
* 在开始实际项目之前,最好在MS-DIAL中检查您的数据类型,如下所示:
Start MS-DIAL project as ‘Centroid’ mode by a representative file.
通过代表性文件以“质心”模式启动MS-DIAL项目。
See the MS1 and MS2 spectrum in ‘Peak spot viewer’ and check the ‘shape’ of the spectra.
在“峰斑查看器”中查看 MS1 和 MS2 光谱,并检查光谱的“形状”。
If the shape appears to require centroiding, restart the project in ‘Profile’ mode.
如果形状看起来需要质心,请在“配置文件”模式下重新启动项目。
Section 1-6 第 1-6 节
Database (MSP or Text) for compound identification
用于化合物鉴定的数据库(MSP 或文本)
The database formats for GC/MS or LC/MS datasets are described in this section. The main difference between GC/MS (EI-MS) and LC/MS (ESI-MS/MS) is the availability of precursor ion and its MS/MS. While a precursor m/z and its MS/MS are mostly available in ESI (or the other soft ionization)-MS/MS, the molecular ion in EI-MS is difficult to detect owning to the hard ionization. Several MSP files are downloadable as a starter kit for MS-DIAL at http://prime.psc.riken.jp/Metabolomics_Software/MS-DIAL/index.html.
本节介绍了GC/MS或LC/MS数据集的数据库格式。GC/MS (EI-MS) 和 LC/MS (ESI-MS/MS) 之间的主要区别在于母离子及其 MS/MS 的可用性。虽然母离子m/z及其MS/MS大多以ESI(或其他软电离)-MS/MS形式提供,但EI-MS中的分子离子很难被检测到。多个 MSP 文件可作为 MS-DIAL 的入门套件下载,价格 http://prime.psc.riken.jp/Metabolomics_Software/MS-DIAL/index.html。
Section 1-6-1 第 1-6-1 节
MSP format for precursor- and MS/MS library
母离子和 MS/MS 文库的 MSP 格式
MS-DIAL supports the MSP (http://www.nist.gov/srd/upload/NIST1a11Ver2-0Man.pdf) format in ASCII text (below Figure). In addition, the software can utilize “RETENTIONTIME: ”, “PRECURSORTYPE: ”, and “FORMULA:” information for metabolite identification (cases are ignored). Retention time information must be specified in minutes [min] scale when possible. The adduct ion information, i.e. here ‘Precursor type’, will be used for the adduct ion search algorithm (see section 7).
MS-DIAL支持ASCII文本中的MSP(http://www.nist.gov/srd/upload/NIST1a11Ver2-0Man.pdf)格式(下图)。此外,该软件还可以利用“RETENTIONTIME:”、“PRECURSORTYPE:”和“FORMULA:”信息进行代谢物鉴定(忽略案例)。保留时间信息必须尽可能以分钟[min]为单位指定。加合离子信息,即此处的“母离子类型”,将用于加合离子搜索算法(参见第 7 节)。
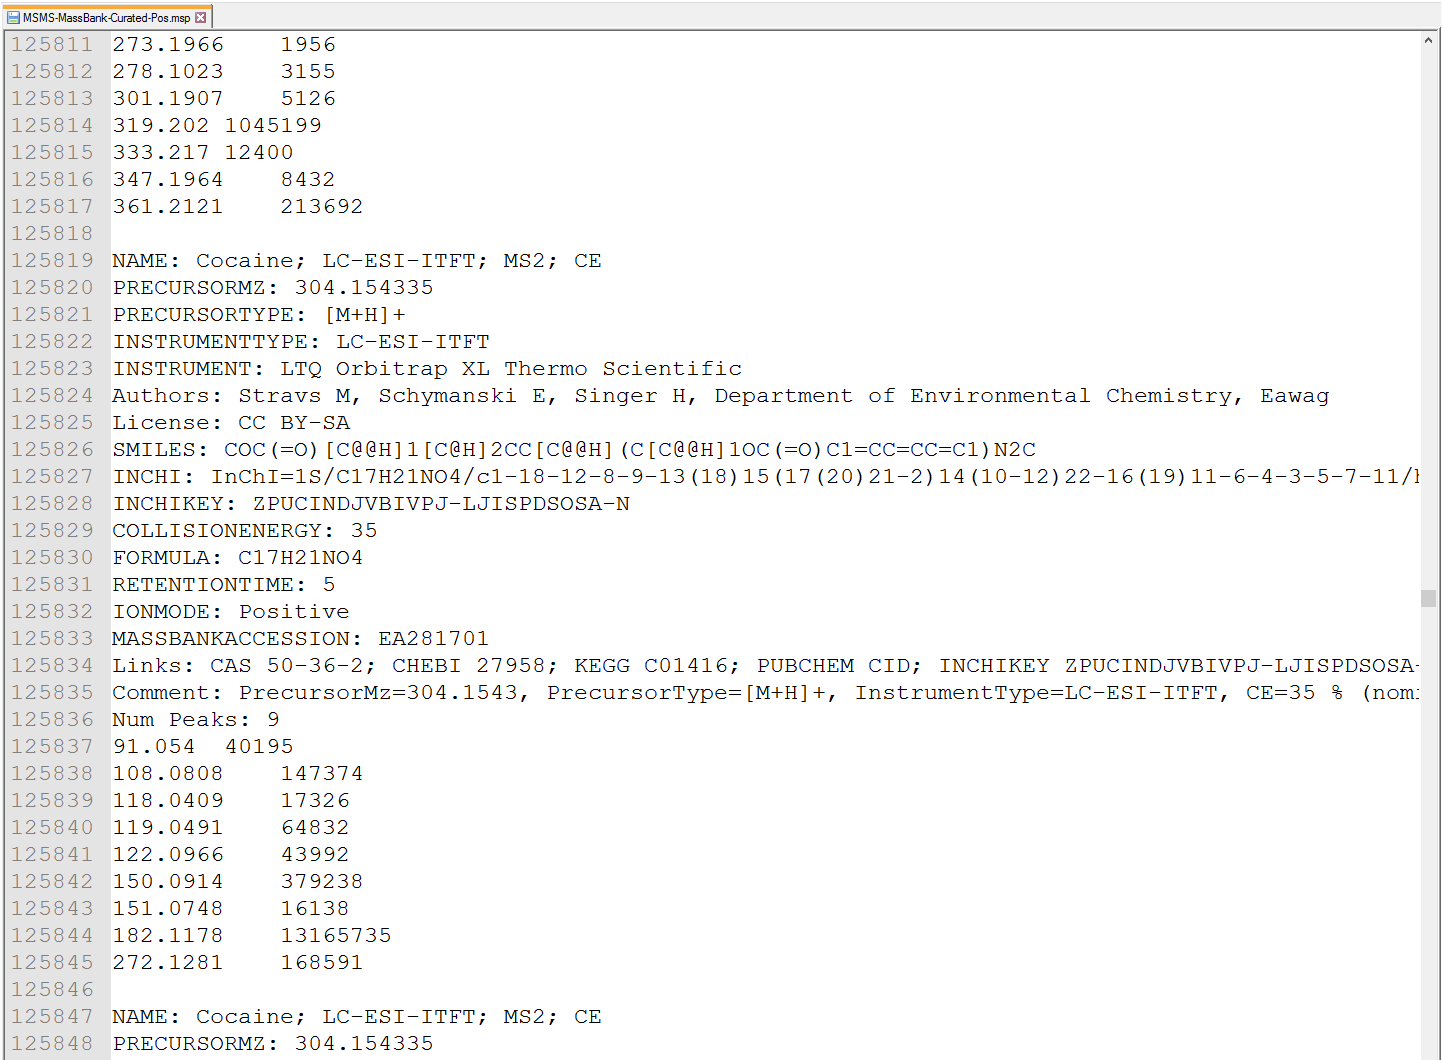 Figure: an example of MSP format library
图:MSP格式库示例
Section 1-6-2 第 1-6-2 节
Adduct ion format 加合离子形式
Adduct ion information should be formatted as described in this section: [M+Na]+, [M+2H]2+, [M-2H2O+H]+, [2M+FA-H]-, etc.
加合离子信息应按照本节所述格式化:[M+Na]+、[M+2H]2+、[M-2H2O+H]+、[2M+FA-H]-等。
The parentheses ‘[’ and ‘]’ must be used to bracket the ion information.
括号“[”和“]”必须用于括号中的离子信息。
The char + and - are required after ‘]’ and the number must be written before + or -.
字符 + 和 - 在 ']' 之后是必需的,数字必须写在 + 或 - 之前。
When you want to define the organic formula like C6H12O5, you have to write it without any replicate elements or parentheses like [M+C2H5COOH-H] or [M+H+(CH3)3SiOH].
当你想像C6H12O5一样定义有机式时,你必须写它,没有任何重复元素或括号,如 [M+C2H5COOH-H] 或 [M+H+(CH3)3SiOH]。
The beginning figure of organic formula like ‘2’H2O is recognized as the H2O × 2. Again, do not use 2(H2O) to specify this.
有机式的起始图,如“2”H2O,被认为是H2O×2。同样,不要使用 2(H2O) 来指定这一点。
Sequential equations are acceptable: [2M+H-C6H12O5+Na]2+ (very apt.)
顺序方程是可以接受的:[2M+H-C6H12O5+Na]2+(非常贴切。
MS-DIAL accepts some abbreviations or common organic formulas for adduct types as follows.
MS-DIAL接受加合物类型的一些缩写或常见的有机公式,如下所示。
For Acetonitrile: ACN, CH3CN乙腈:乙腈、CH3CN
For Methanol: CH3OH 甲醇用:CH3OH
For Isopropanol: IsoProp, C3H7OH异丙醇:异丙醇,C3H7OH
For Dimethyl sulfoxide: DMSO对于二甲基亚砜:DMSO
For Formic acid: FA, HCOOH甲酸:FA、HCOOH
For Acetic acid: Hac, CH3COOH乙酸:Hac、CH3COOH
For Trifluoroacetic acid: TFA, CFCOOH对于三氟乙酸:TFA,CFCOOH
Section 1-6-3 第 1-6-3 节
Text format library for retention time and accurate mass search (post identification)
用于保留时间和准确批量搜索(后识别)的文本格式库
MS-DIAL also supports tab-delimited text format library for peak identification by means of retention time and MS1 accurate mass information. The identification process is performed after completing peak identification based on MSP format library. This is why we call this identification processing “post identification”. The first row should include header information. The first, second, third, and fourth columns should contain the metabolite name, accurate mass [Da], retention time [min], and adduct ion, respectively. This library can be easily created in Microsoft Excel. Save the spreadsheet in “Tab delimited text format”. This option is useful for internal standard identifications etc. (Even if you don’t have MS/MS libraries, the peak identification based on retention time and accurate mass is available from this option.)
MS-DIAL还支持制表符分隔的文本格式库,通过保留时间和MS1准确的质量数信息进行峰识别。基于MSP格式库完成峰鉴定后进行鉴定过程。这就是为什么我们将这种识别处理称为“后识别”。第一行应包含标题信息。第一、第二、第三和第四列应分别包含代谢物名称、准确质量数 [Da]、保留时间 [min] 和加合离子。可以在 Microsoft Excel 中轻松创建此库。以“制表符分隔的文本格式”保存电子表格。此选项可用于内标鉴定等(即使您没有MS/MS文库,也可以通过此选项进行基于保留时间和准确质量数的峰鉴定。
* The minimum requirement for this text library is just ‘metabolite name’ and ‘m/z’ information; i.e. the first two columns are required. Retention time and adduct ion fields provide additional information for MS-DIAL in peak identification and adduct ion picking, respectively.
* 此文本库的最低要求只是“代谢物名称”和“m/z”信息;即前两列是必需的。保留时间和加合离子场分别为MS-DIAL的峰鉴定和加合离子拾取提供了额外的信息。
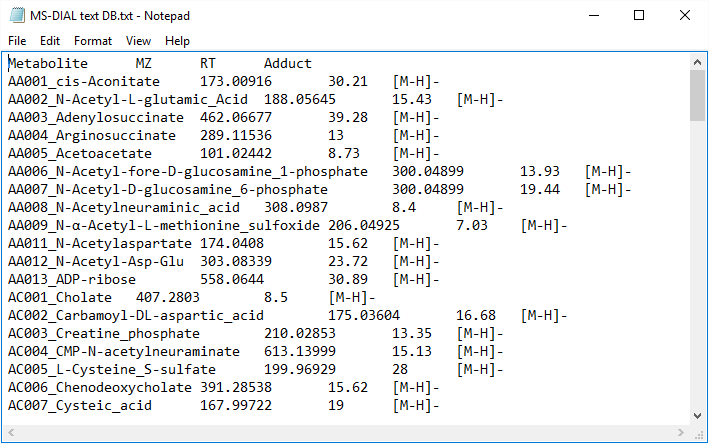
Figure: an example of text library
图:文本库示例
Section 1-6-4 第 1-6-4 节
MSP format as GC/MS library
MSP 格式如同 GC/MS 库
MS-DIAL supports the MSP format (http://www.nist.gov/srd/upload/NIST1a11Ver2-0Man.pdf) in ASCII text, same as in section 6-1. MS-DIAL accepts two fields for ‘retention’ information as the reference: “RETENTIONTIME: ” or “RT”, and “RETENTIONINDEX” or “RI”. Retention time information must be specified in minute [min] scale when possible.
MS-DIAL 支持 ASCII 文本中的 MSP 格式 ( http://www.nist.gov/srd/upload/NIST1a11Ver2-0Man.pdf),与第 6-1 节相同。MS-DIAL 接受两个“保留”信息字段作为参考:“RETENTIONTIME:”或“RT”,以及“RETENTIONINDEX”或“RI”。保留时间信息必须尽可能以分钟[min]为单位指定。
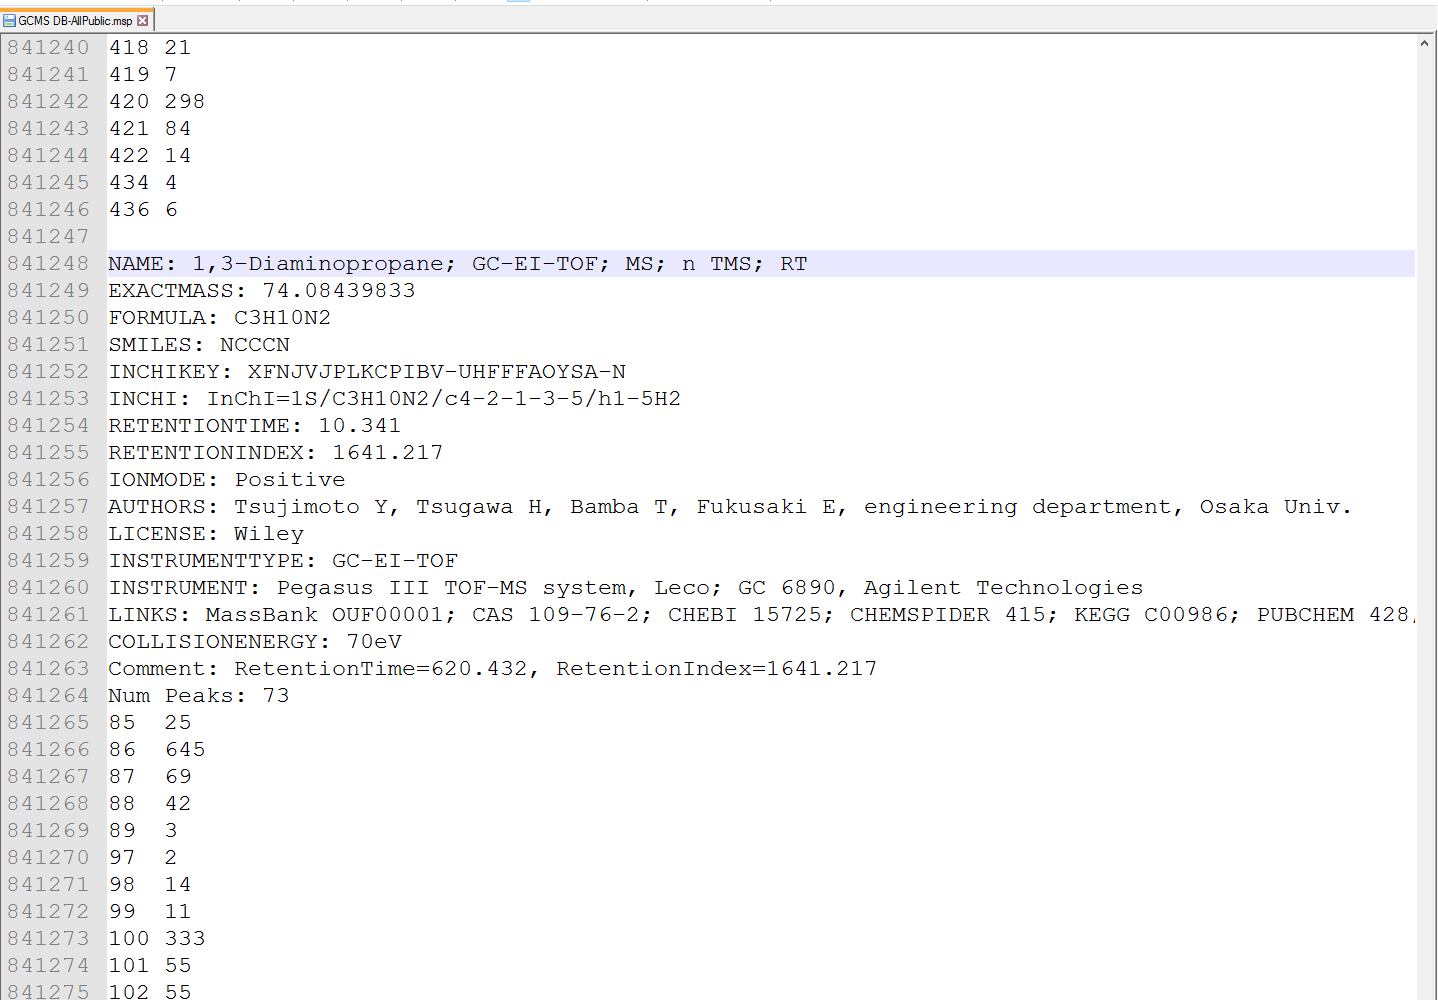
Figure: an example of MSP format library for GC/MS
图:GC/MS的MSP格式库示例
Section 1-6-5 第 1-6-5 节
Alkane- or FAME retention time dictionary for the calculation of retention index
烷烃或FAME保留时间字典,用于计算保留指数
Retention time and retention index are used for routine identification of metabolites in GC/MS based metabolomics. The current MS-DIAL program has three options for the use of retention information: 1) retention time, 2) alkane mix based retention index, and 3) FAME (fatty acid methyl ester) mix based retention index.
保留时间和保留指数用于基于GC/MS的代谢组学中代谢物的常规鉴定。当前的MS-DIAL程序有三种保留信息使用选项:1)保留时间,2)基于烷烃混合物的保留指数,以及3)基于FAME(脂肪酸甲酯)混合物的保留指数。
See the experimental details of alkane and FAME mixtures.
查看烷烃和FAME混合物的实验细节。
Alkanes: http://www.sciencedirect.com/science/article/pii/S1389172311001848
Alkanes: https://en.wikipedia.org/wiki/Kovats_retention_index
FAMEs: http://www.ncbi.nlm.nih.gov/pmc/articles/PMC2805091/
In order to calculate the retention indexes of detected peaks, users have to prepare a dictionary including the pairs of the carbon number and its retention time as tab-delimited text (see next page).
为了计算检测到的峰的保留指数,用户必须准备一个字典,包括碳数对及其保留时间,以制表符分隔的文本(见下页)。
FAQ
By alkane mixture, the calculation of retention index is based on Kovats’s method (temperature programmed chromatography).
通过烷烃混合物,保留指数的计算基于Kovats方法(程序升温色谱法)。
By FAME mixture, the calculation is based on Fiehn’s method. Importantly, FAMEs of carbon number C8, C9, C10, C12, C14, C16, C18, C20, C22, C24, C26, C28, and C30 (total 13 FAMEs) must be included in this dictionary to calculate Fiehn’s index. A polynomial regression of fifth order is applied to chromatographic peaks between C9 and C28. The peaks between C8 (and its earlier) and C9 and between C28 and C30 (and its later) are interpolated by a linear regression. The original indexes are based on the retention time (sec) * 1000 of authentic standards.
通过FAME混合物,计算基于Fiehn的方法。重要的是,碳数 C8、C9、C10、C12、C14、C16、C18、C20、C22、C24、C26、C28 和 C30(共 13 个 FAME)的 FAME 必须包含在该字典中才能计算 Fiehn 指数。将五阶多项式回归应用于C9和C28之间的色谱峰。C8(及其更早版本)和 C9 之间以及 C28 和 C30(及其更晚版本)之间的峰值通过线性回归进行插值。原始索引基于正品标准的保留时间(秒)* 1000。
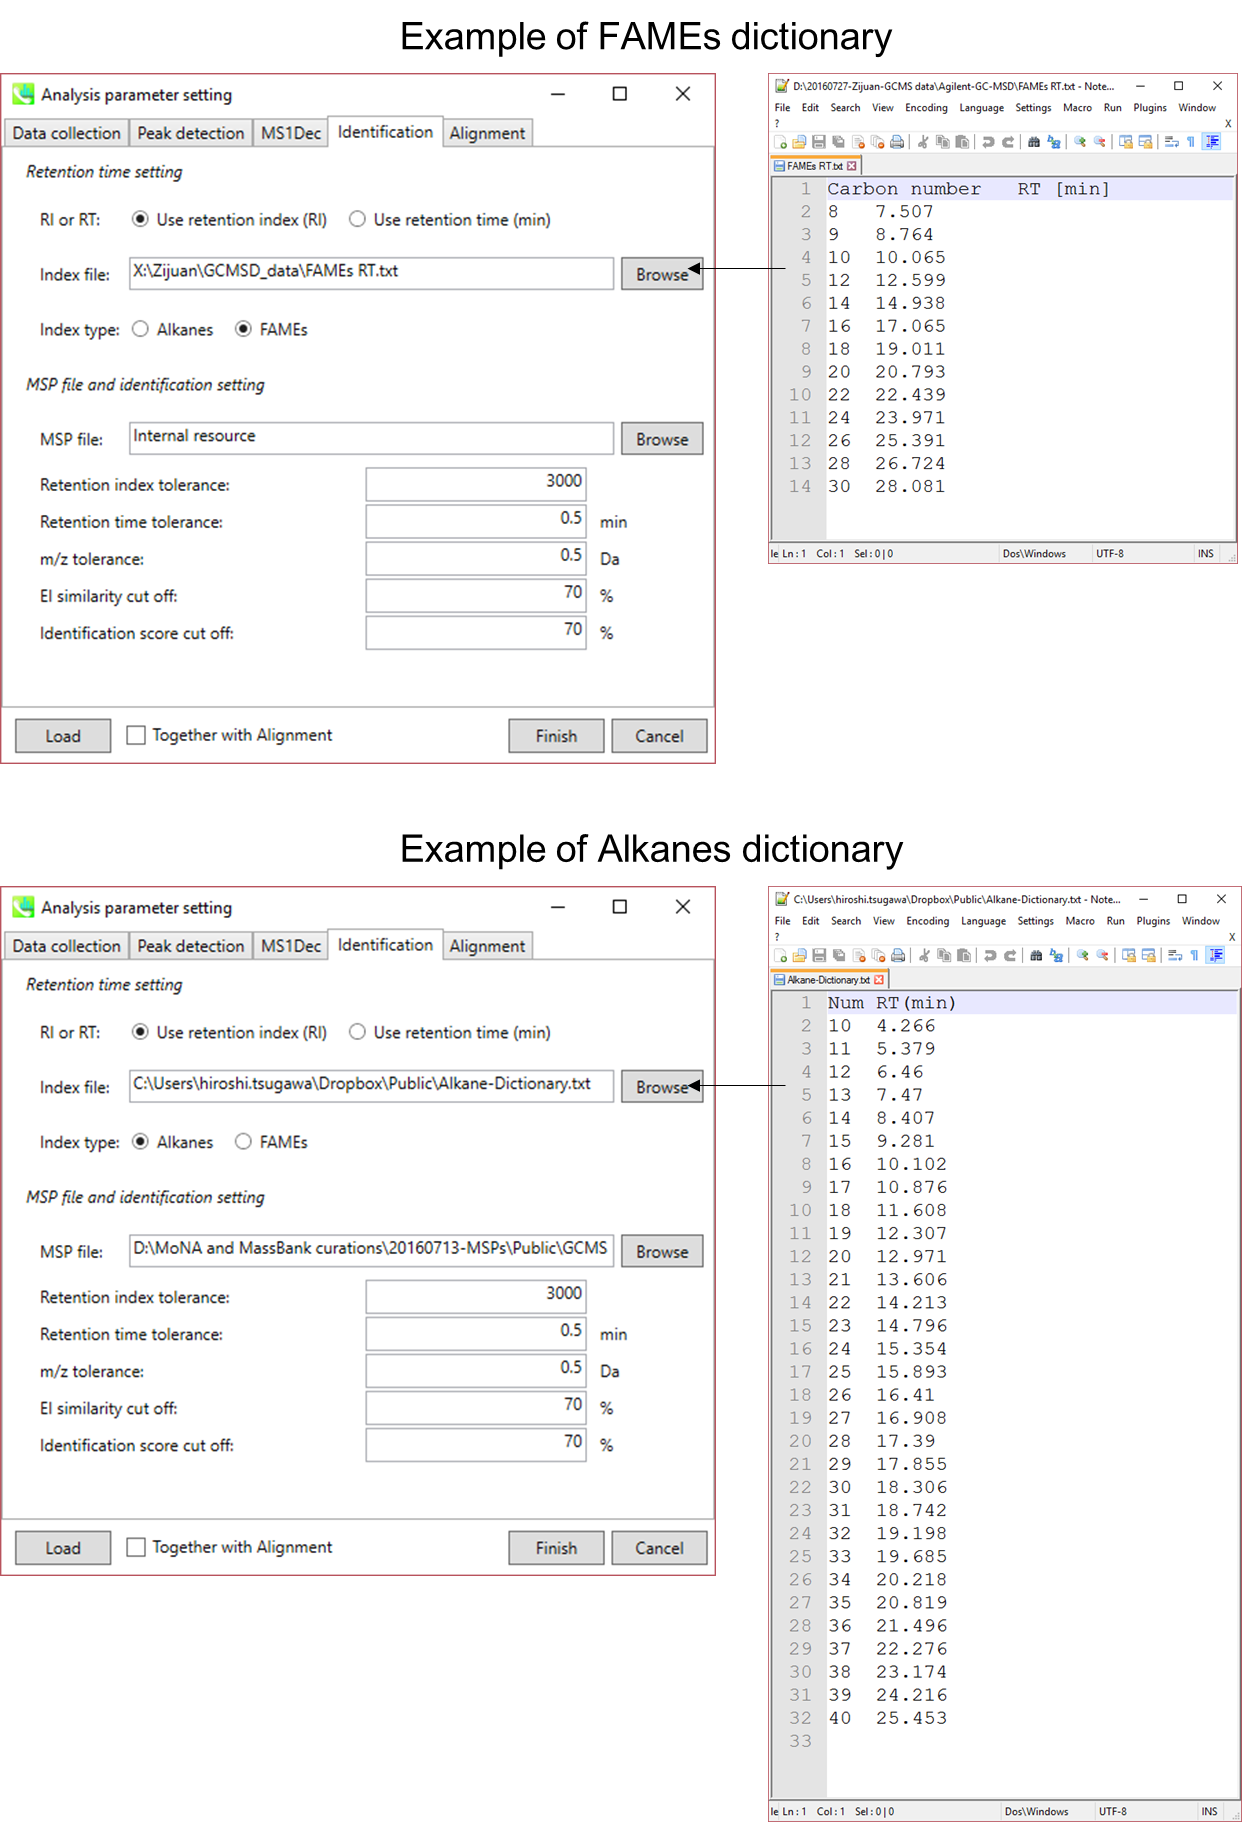
Figure: examples of Alkanes or Fames dictionaries
图:烷烃或Fames词典的例子
Chapter 2 第 2 章
LC-MS/MS (data independent MS/MS) project for lipidomics using in silico retention time and theoretical MS/MS library of lipids
用于脂质组学的LC-MS/MS(数据无关型MS/MS)项目,使用计算机保留时间和脂质理论MS/MS库
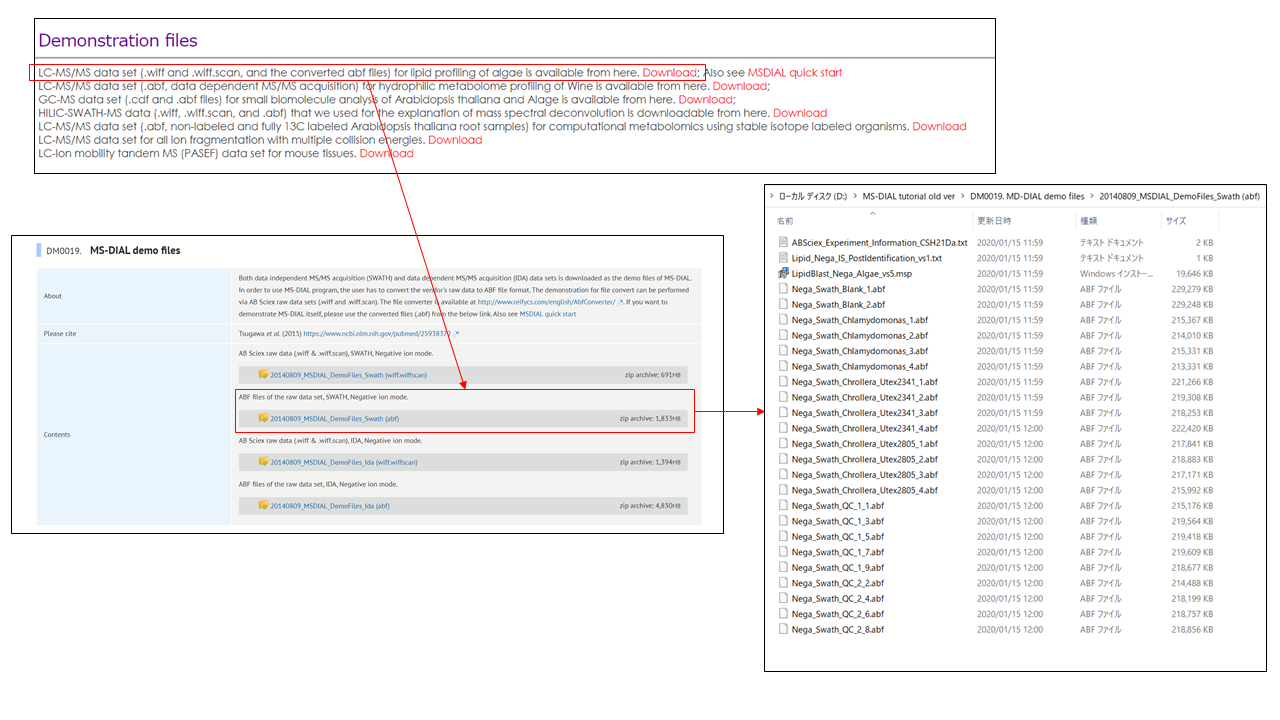
A project dealing with data independent MS/MS acquisition in combination with the in silico retention time and MS/MS databases for lipids is demonstrated. The experimental protocol is described in previous research: http://www.nature.com/nmeth/journal/v12/n6/abs/nmeth.3393.html.
演示了一个与数据无关的MS/MS采集与计算机保留时间和MS/MS数据库相结合的项目,用于脂质。实验方案在以前的研究中有所描述:http://www.nature.com/nmeth/journal/v12/n6/abs/nmeth.3393.html。
This tutorial uses 23 demonstration files which are downloadable from the below link.
本教程使用 23 个演示文件,可从以下链接下载。
http://prime.psc.riken.jp/?action=drop_index
Experiment summary: 实验总结:
Liquid chromatography: total 15 min run per sample with Waters Acquity UPLC CSH C18 column (100×2.1 mm; 1.7 μm).
液相色谱:使用Waters Acquity UPLC CSH C18色谱柱(100×2.1 mm;1.7 μm)对每个样品进行总共15分钟的运行。
Mass spectrometer: SWATH method with negative ion mode.
质谱仪:具有负离子模式的SWATH方法。
MS1 accumulation time, 100 ms
MS1 累积时间,100 ms
MS2 accumulation time, 10 ms
MS2 累积时间,10 ms
Collision energy, 45 V
碰撞能量,45 V
Collision energy spread, 15 V
碰撞能量扩散,15 V
Cycle time, 731 ms
循环时间,731 ms
Q1 window, 21 Da
Q1 窗口,21 Da
Mass range, m/z 100-1250
质量范围,m/z 100-1250
Modifier, Ammonium formate (HCOONH4)
改性剂,甲酸铵(HCOONH 4 )
Section 2-1 第2-1节
Starting up your project
启动项目
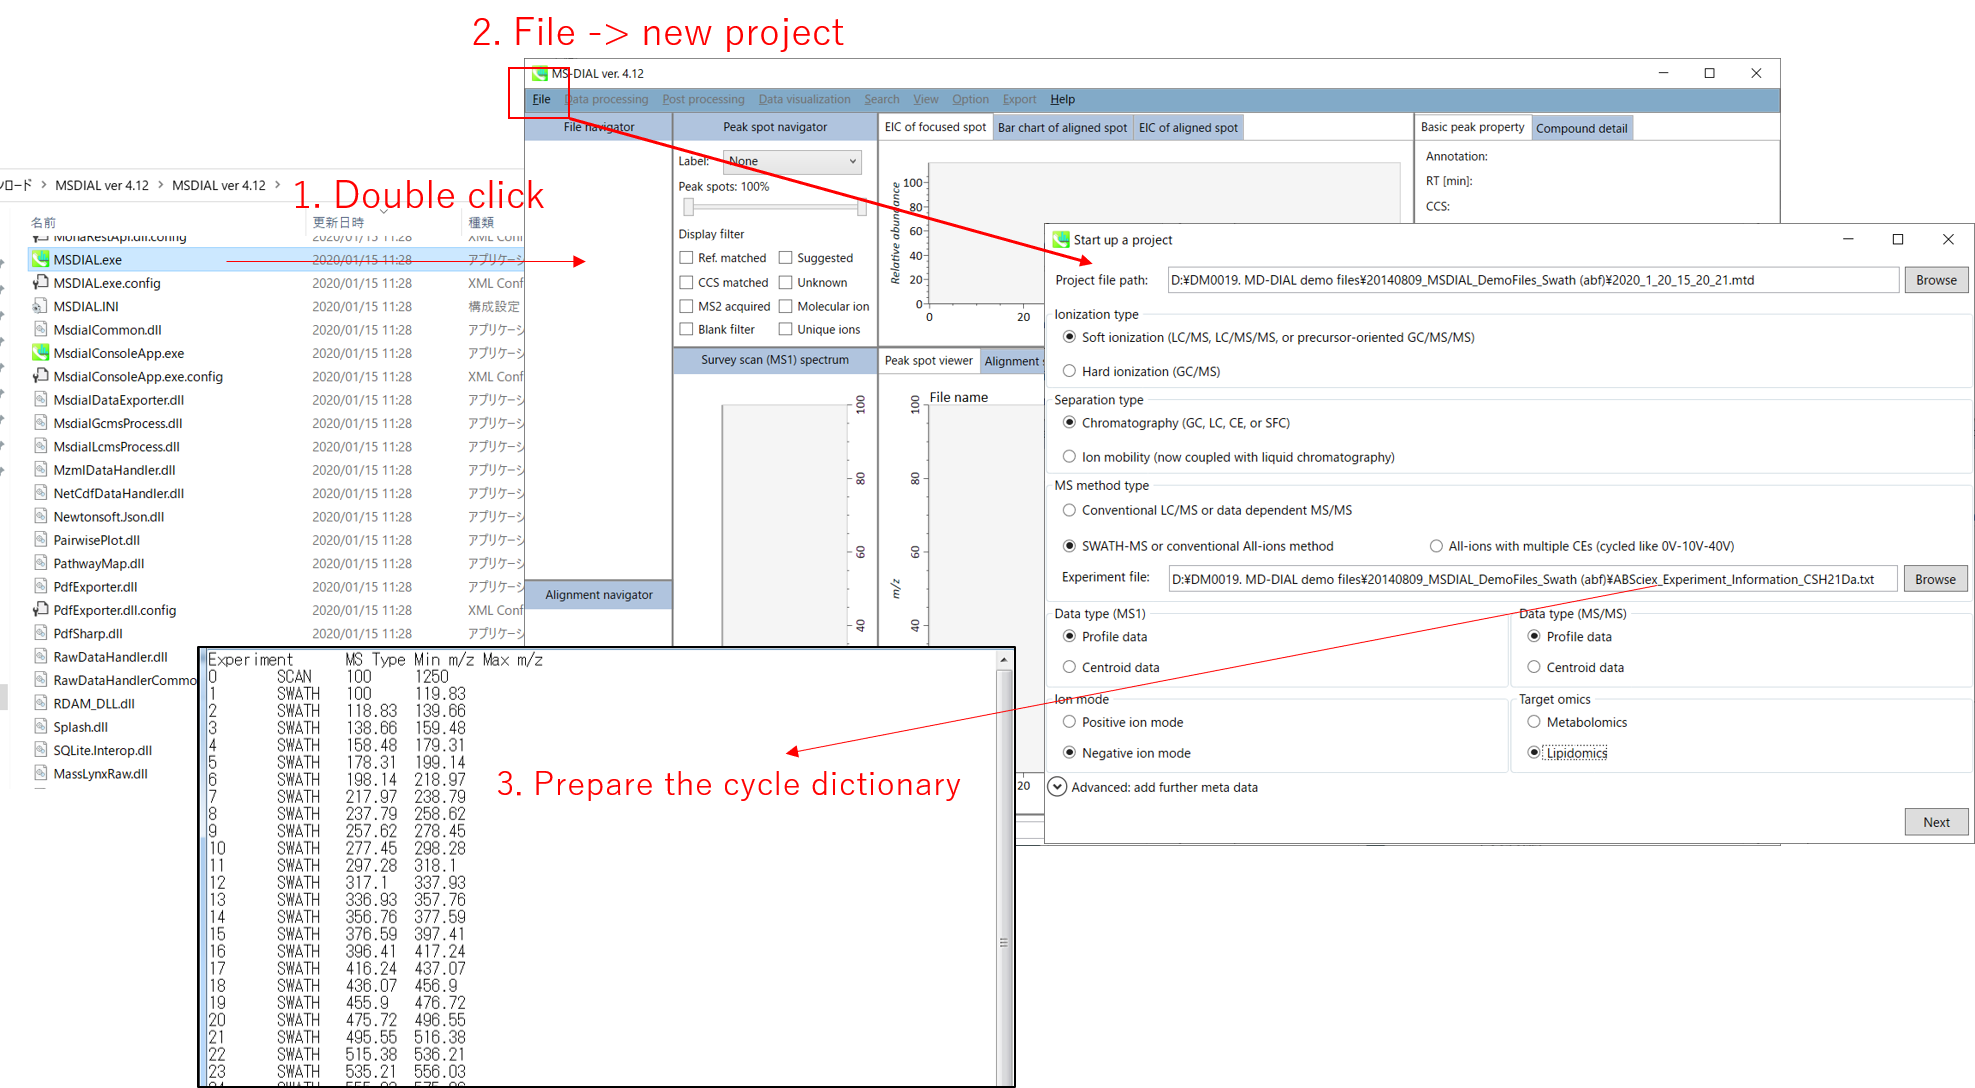
File -> new project
文件 -> 新项目
Set your project file path to the directory of your ABF files
将项目文件路径设置为 ABF 文件的目录
Select your MS method type as ‘SWATH-MS or conventional all-ions method’
选择MS方法类型为“SWATH-MS或常规全离子方法”
Select the experimental file: ABSciex_Experiment_Information_CSH21Da.txt.
选择实验文件:ABSciex_Experiment_Information_CSH21Da.txt。
Choose data type profile data for both MS1 and MS/MS
为 MS1 和 MS/MS 选择数据类型配置文件数据
Choose negative ion mode
选择负离子模式
Choose target omics as ‘Lipidomics’
选择目标组学作为“脂质组学”
If you select ‘lipidomics’ project, you do not have to prepare NIST MSP format library since MS-DIAL internally contains the theoretical MS/MS spectra of lipids (and actually, the fragment ions are future evaluated by the decision tree algorithm to provide the proper lipid structure representation.). Instead, you should select lipid subclasses needed by your data sets. On the other hand, when you select ‘metabolomics’ project, your own MSP file will be required for compound identification (see Chapter 3).如果选择“脂质组学”项目,则无需准备NIST MSP格式库,因为MS-DIAL内部包含脂质的理论MS/MS谱图(实际上,决策树算法将来会评估碎片离子,以提供正确的脂质结构表示)。相反,您应该选择数据集所需的脂质亚类。另一方面,当您选择“代谢组学”项目时,化合物鉴定将需要您自己的MSP文件(见第3章)。
* see section 4 of chapter 1 as well for more detail* 详见第 1 章第 4 节
Section 2-2 第2-2节
Importing ABF files 导入 ABF 文件
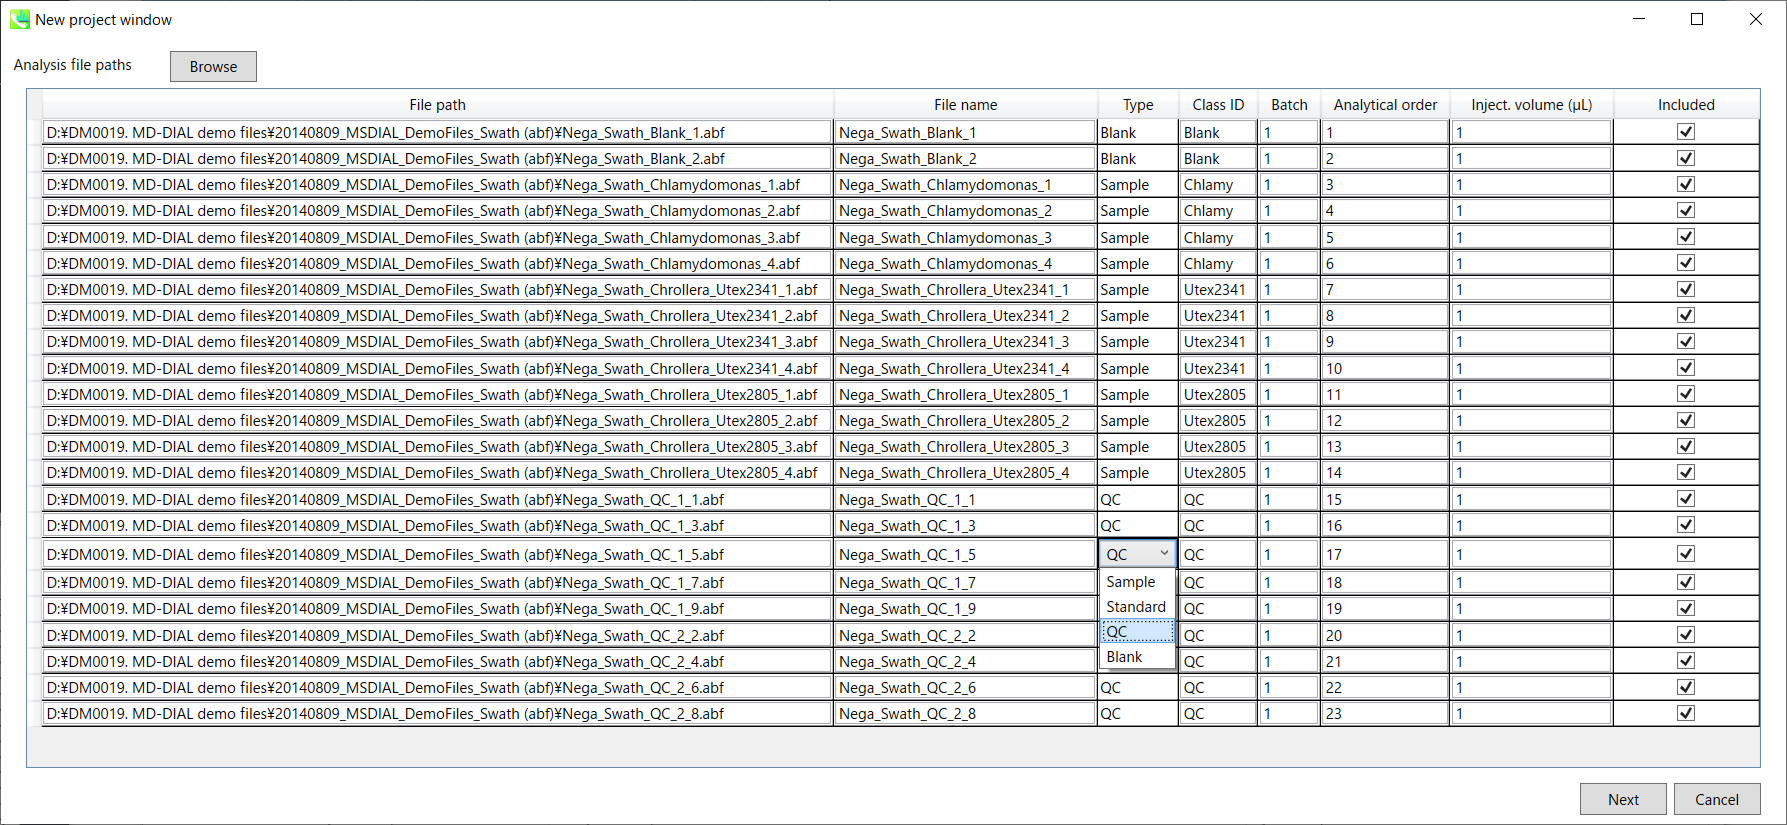
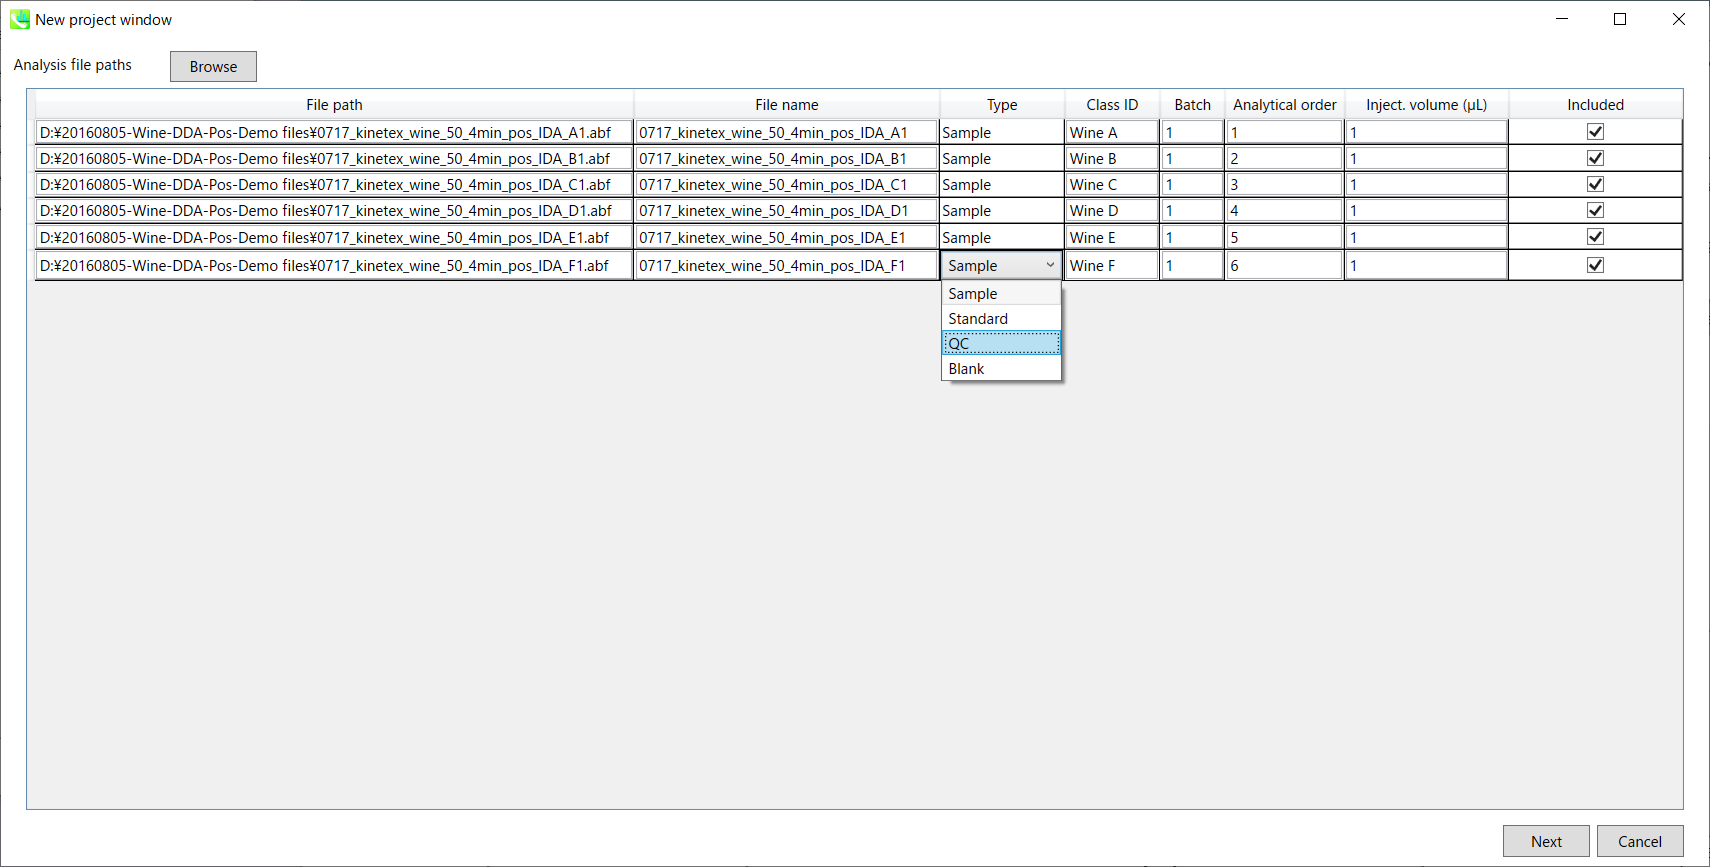
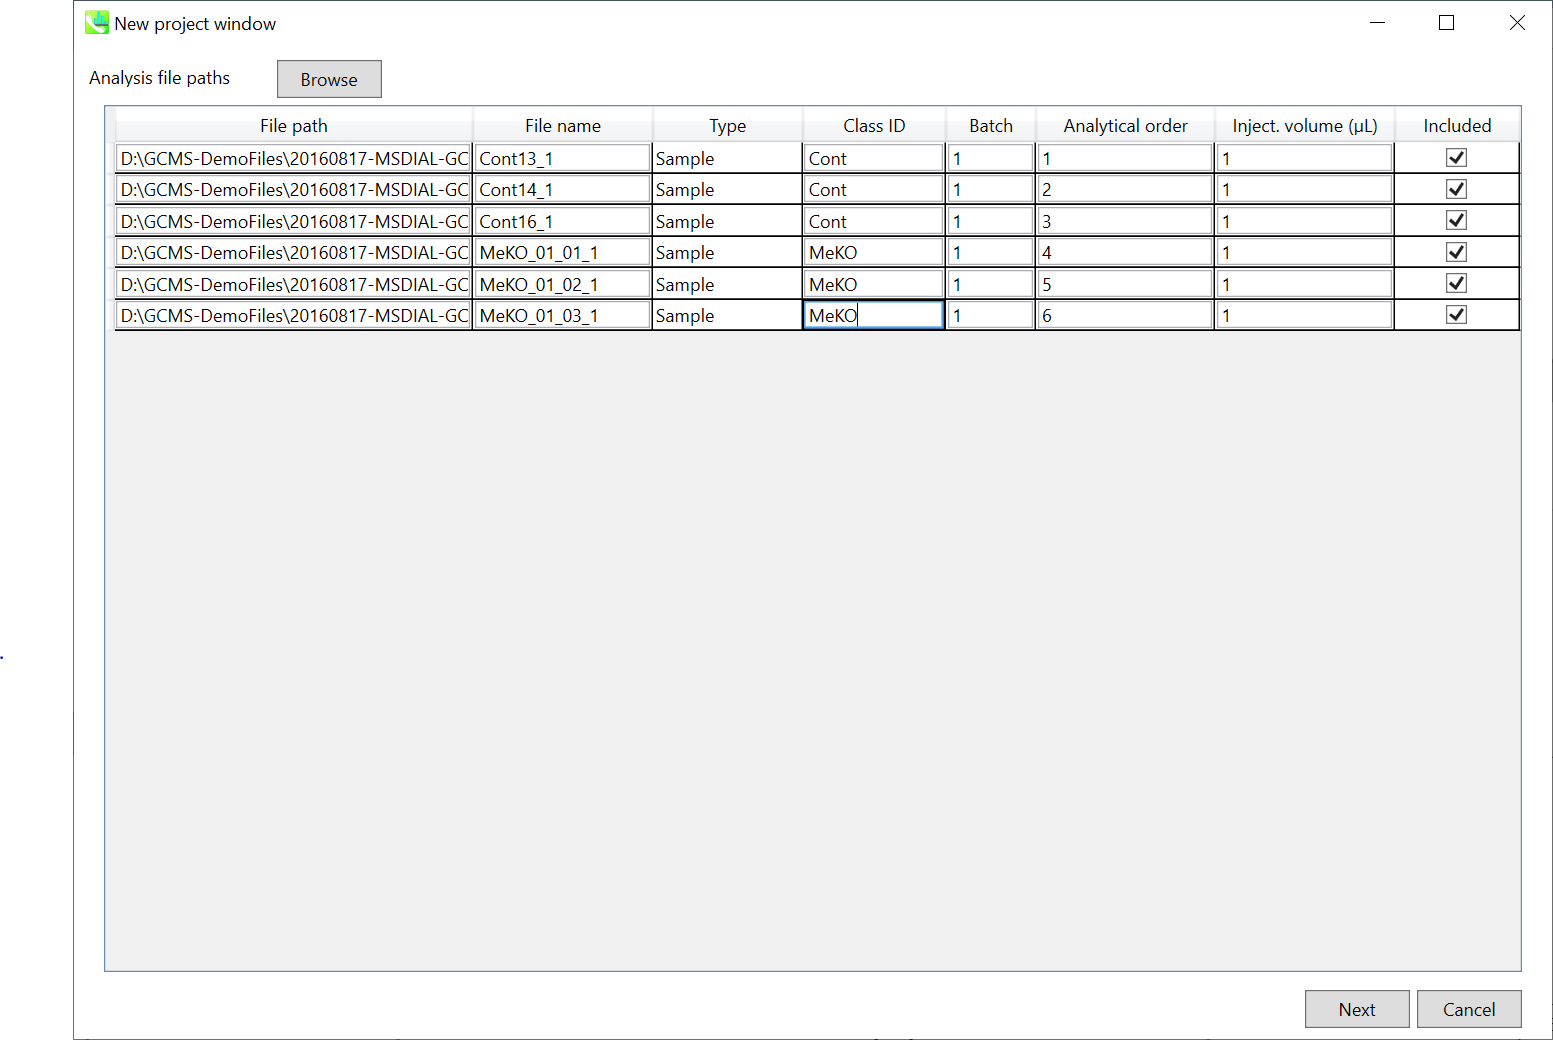
Select ABF files 选择 ABF 个文件
If the file is a “quality control (QC)” sample, set the type as QC. Also, please set the type as Blank for blank samples used for feature reductions based on the blank’s peaks.
如果文件是“质量控制 (QC)”示例,请将类型设置为 QC。此外,对于用于根据空白峰进行特征缩减的空白样本,请将类型设置为空白。
Edit Class ID of the files to divide sample data into each experimental group (Blank, QC, Group A, Group B, etc.). Sample files are allocated to each group and after analysis is finished the bar chart (or box plot) of each group will be appeared in the pane “Bar chart of aligned spot” of the main window (See Section 2-4).
编辑文件的类 ID,将样本数据划分为每个实验组(空白组、QC、A 组、B 组等)。样本文件被分配给每个组,分析完成后,每个组的条形图(或箱形图)将出现在主窗口的“对齐点条形图”窗格中(参见第 2-4 节)。
Note: 注意:
Please finalize your file name here otherwise you cannot change it anymore (these finalized file names will be appeared in the pane “File navigator” of the main window after finishing this analysis. See Section 2-4 for details).
请在此处最终确定您的文件名,否则您将无法再更改它(完成此分析后,这些最终的文件名将出现在主窗口的“文件导航器”窗格中。有关详细信息,请参阅第 2-4 节)。
If you want to define the injection volume of each file, you can additionally type each volume in the column “Inject. volume (μL)”.
如果要定义每个文件的进样量,可以在“注入”列中另外键入每个卷。体积 (μL)”。
Section 2-3 第2-3节
Setting parameters 设置参数
Section 2-3-1 第 2-3-1 节
Data collection tab “数据收集”选项卡
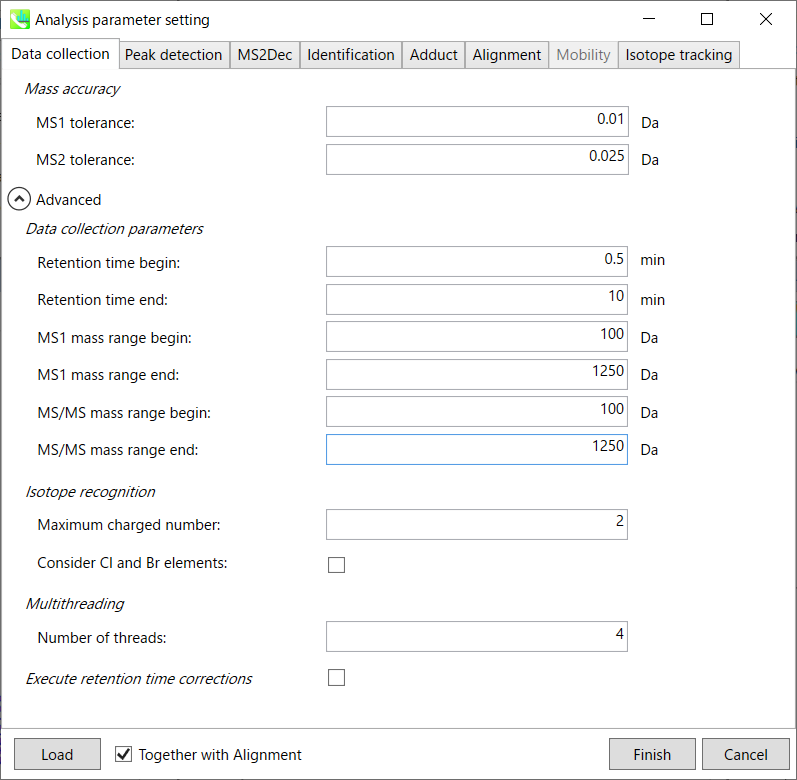
Mass accuracy: 质量精度:
After the peak detection algorithm is applied along the MS axis with a very low threshold, MS-DIAL performs spectral centroiding. By default, mass spectrum of ±0.01 and ±0.025 Da range from each peak top is integrated in MS1 and MS2, respectively. Importantly, this MS2 tolerance value is also used to build the MS/MS chromatogram for a certain m/z trace. The MS/MS chromatograms are dedicated to the MS2Dec deconvolution program.
在以非常低的阈值沿MS轴应用峰值检测算法后,MS-DIAL执行光谱质心。默认情况下,MS1 和 MS2 中分别积分了每个峰顶的 ±0.01 和 ±0.025 Da 范围的质谱图。重要的是,该MS2容差值还用于构建特定m/z迹线的MS/MS色谱图。MS/MS色谱图专用于MS2Dec反卷积程序。
Data collection parameters:
数据采集参数:
You can set analysis ranges (RT, MS1 and MS/MS axis). In this demonstration, your expected data range is 0.5-10 min for 100-1250 Da.
您可以设置分析范围(RT、MS1 和 MS/MS 轴)。在此演示中,对于 100-1250 Da,您的预期数据范围为 0.5-10 分钟。
Isotope recognition: 同位素识别:
As long as you focus on small molecule researches (less than 2000 Da), the maximum charged number can be set to 2. On the other hand, the parameter can be changed to 8 or more to process proteome or snRNA research data.
只要专注于小分子研究(小于2000 Da),最大充电数可以设置为2。另一方面,可以将参数更改为 8 或更多以处理蛋白质组或 snRNA 研究数据。
Check Consider Cl and Br elements if you assume that compounds in your samples contain chloride (Cl) or bromide (Br) as the formula element showing the unique isotopic patterns.
如果您假设样品中的化合物含有氯化物 (Cl) 或溴化物 (Br) 作为显示独特同位素模式的公式元素,请选中考虑 Cl 和 Br 元素。
Multithreading: 多线程:
Please set the count of threads that you want to use. You can check the maximum thread counts in resource monitor. (open task manager->open resource monitor)
请设置要使用的线程数。您可以在资源监视器中检查最大线程计数。(打开任务管理器->打开资源监视器)
Execute retention time corrections:
执行保留时间更正:
For detail, visit ‘The tutorial and parameter files for MS-DIAL ALF dataprocessing and spectral library construction methodology’ in the website of MS-DIAL shown below(URL: http://prime.psc.riken.jp/Metabolomics_Software/MS-DIAL/).
详情请见下图所示的MS-DIAL网站中的“MS-DIAL ALF数据处理和谱库构建方法的教程和参数文件”(URL:http://prime.psc.riken.jp/Metabolomics_Software/MS-DIAL/)。
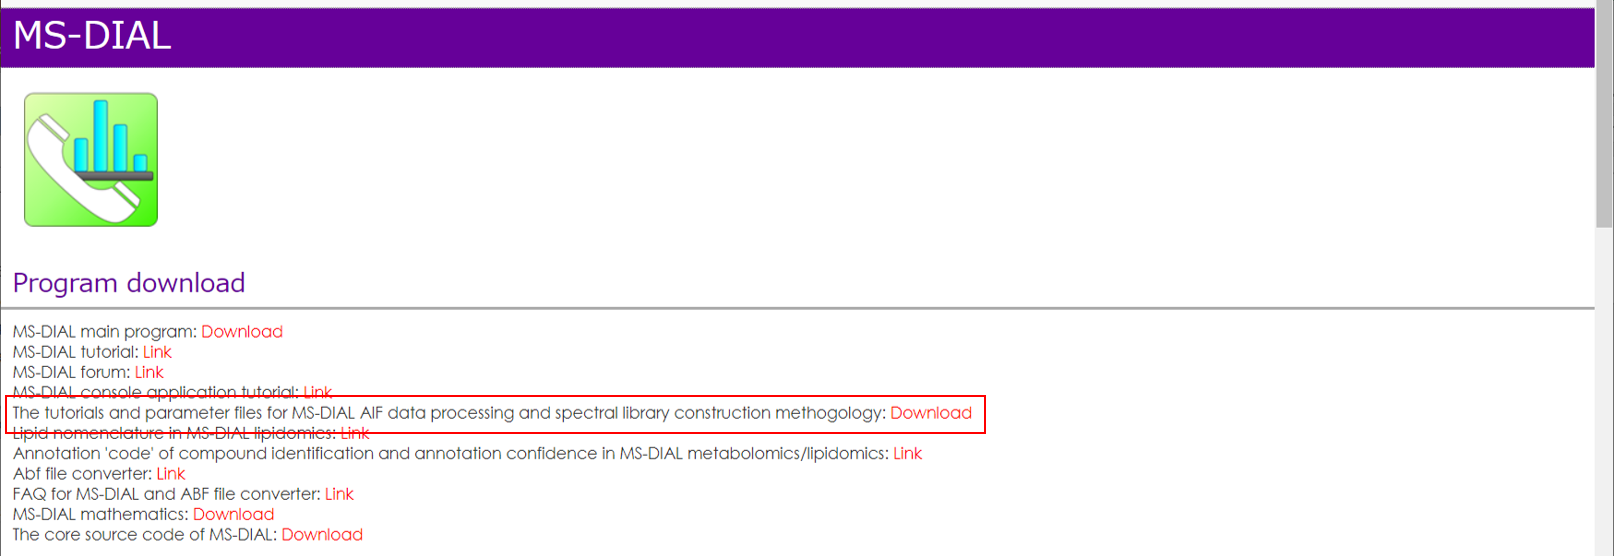
Execute retention time corrections: For detail, visit ‘The tutorial and parameter files for MS-DIAL ALF dataprocessing and spectral library construction methodology’ in the website of MS-DIAL shown below(URL: http://prime.psc.riken.jp/Metabolomics_Software/MS-DIAL/).
执行保留时间校正:有关详细信息,请访问如下所示的MS-DIAL网站中的“MS-DIAL ALF数据处理和谱库构建方法的教程和参数文件”(URL:http://prime.psc.riken.jp/Metabolomics_Software/MS-DIAL/)。
Section 2-3-2 第 2-3-2 节
Peak detection tab 峰值检测选项卡
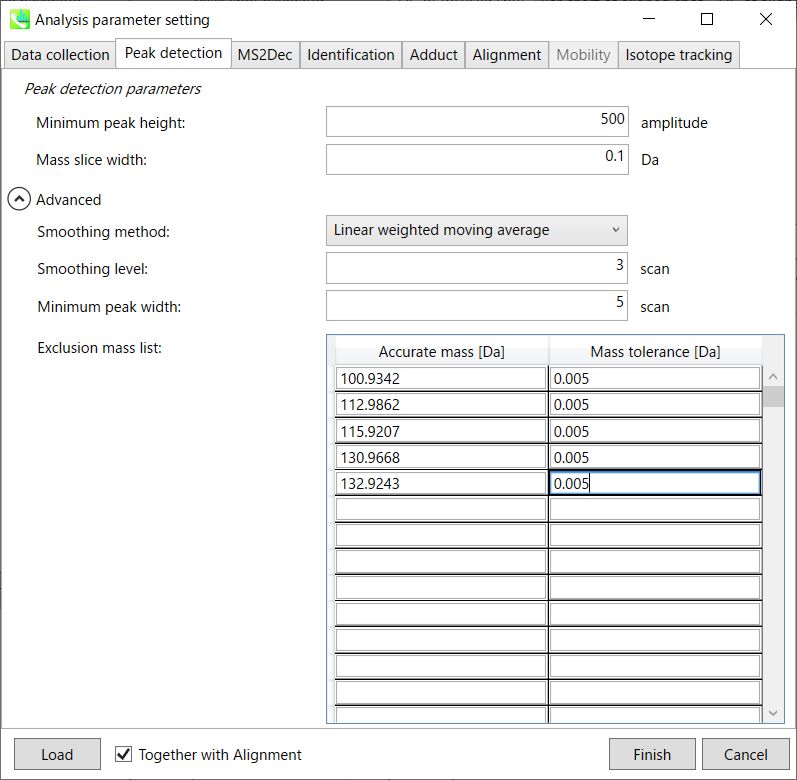
MS-DIAL provides two simple thresholds; minimum values for peak width and height. Peaks below these thresholds are ignored (see also MS-DIAL mathematics: http://prime.psc.riken.jp/Metabolomics_Software/MS-DIAL/MS-DIAL%20FAQ-vs2.pdf).
MS-DIAL 提供两个简单的阈值;峰宽和峰高的最小值。低于这些阈值的峰值将被忽略(另请参阅 MS-DIAL 数学:http://prime.psc.riken.jp/Metabolomics_Software/MS-DIAL/MS-DIAL%20FAQ-vs2.pdf)。
It is ideal that users put values here based on your own experience that you got looking at the trend of your data. However FYI (based on our experience) the minimum peak height may be set to 500 as a default value for this demo data of Sciex.
理想情况下,用户应根据您自己查看数据趋势的经验将值放在这里。但是,仅供参考(根据我们的经验),最小峰高可能设置为 500 作为 Sciex 演示数据的默认值。
Besides, for FT-ICR or Orbirap data, the minimum peak height may be 50,000 or more.
此外,对于FT-ICR或Orbirap数据,最小峰高可能为50,000或更高。
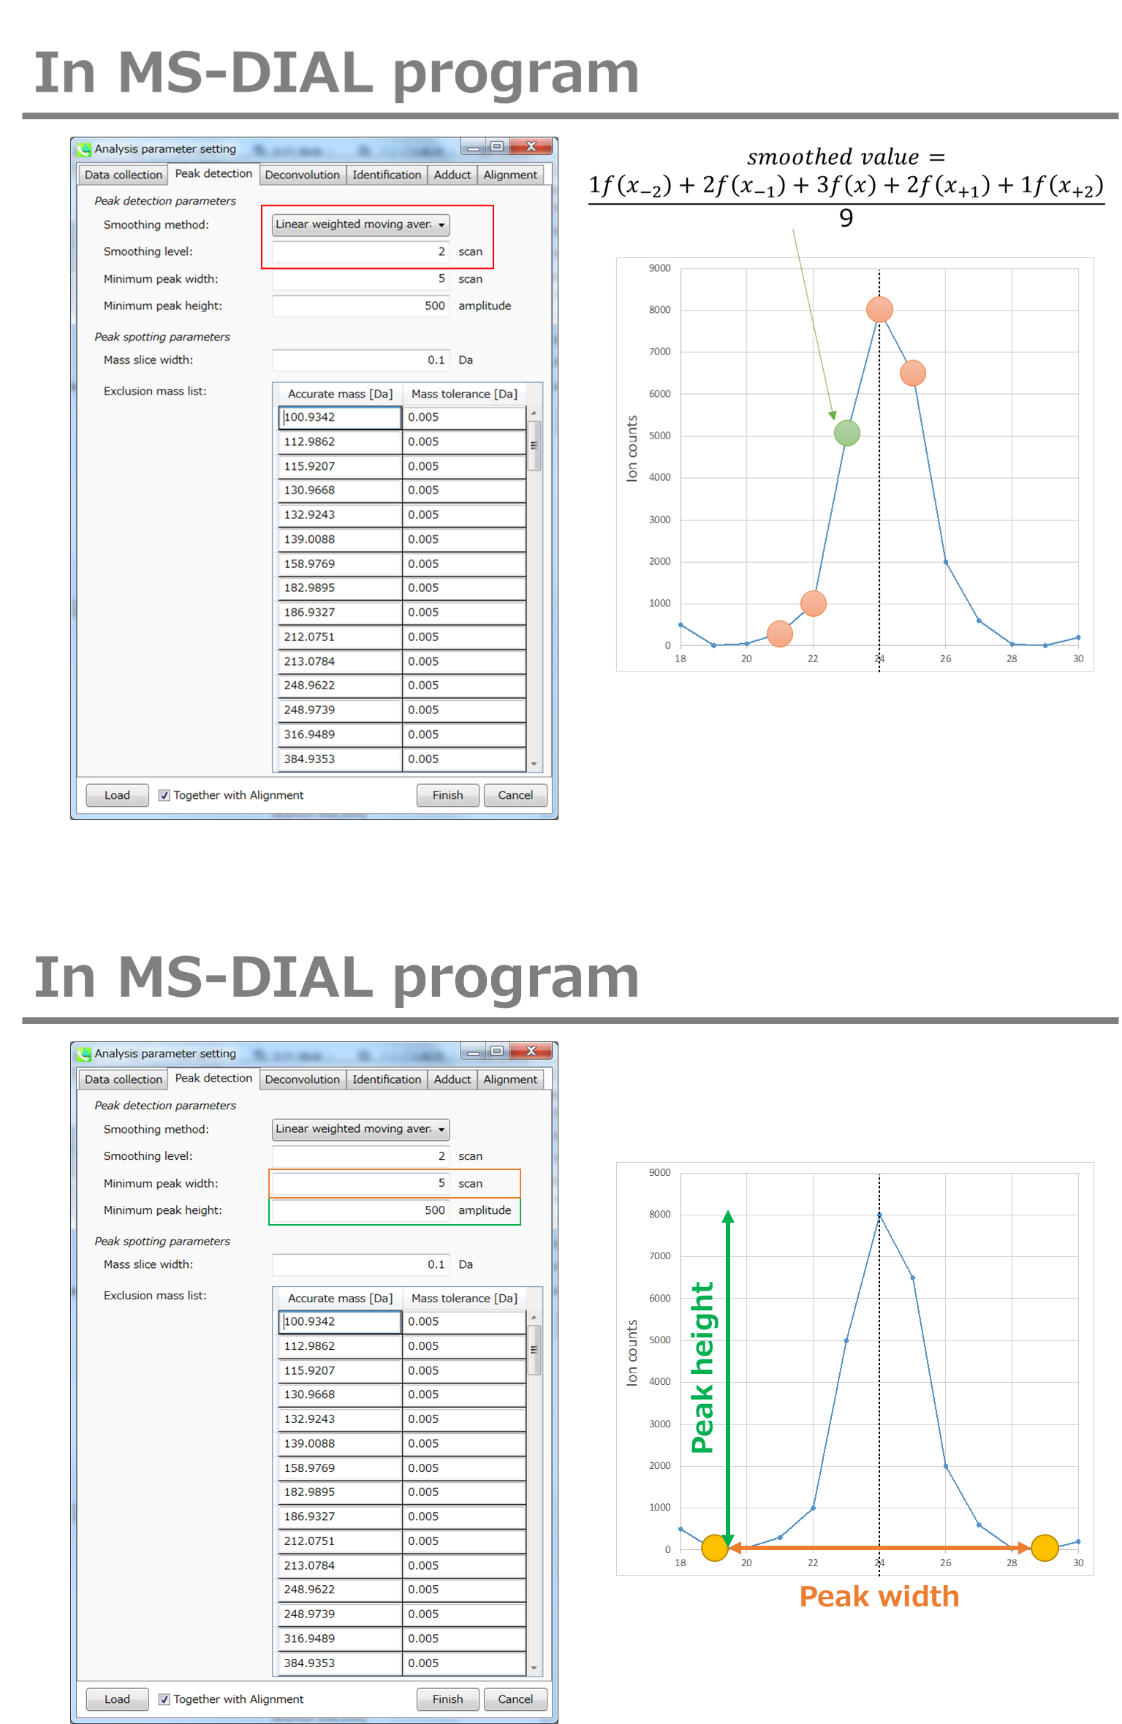
Minimum peak width indicates a threshold of peak width for filtering. See detail by reading the second slide (title ‘In MS-DIAL program’) below.
最小峰宽表示滤波峰宽的阈值。通过阅读下面的第二张幻灯片(标题“在 MS-DIAL 程序中”)查看详细信息。
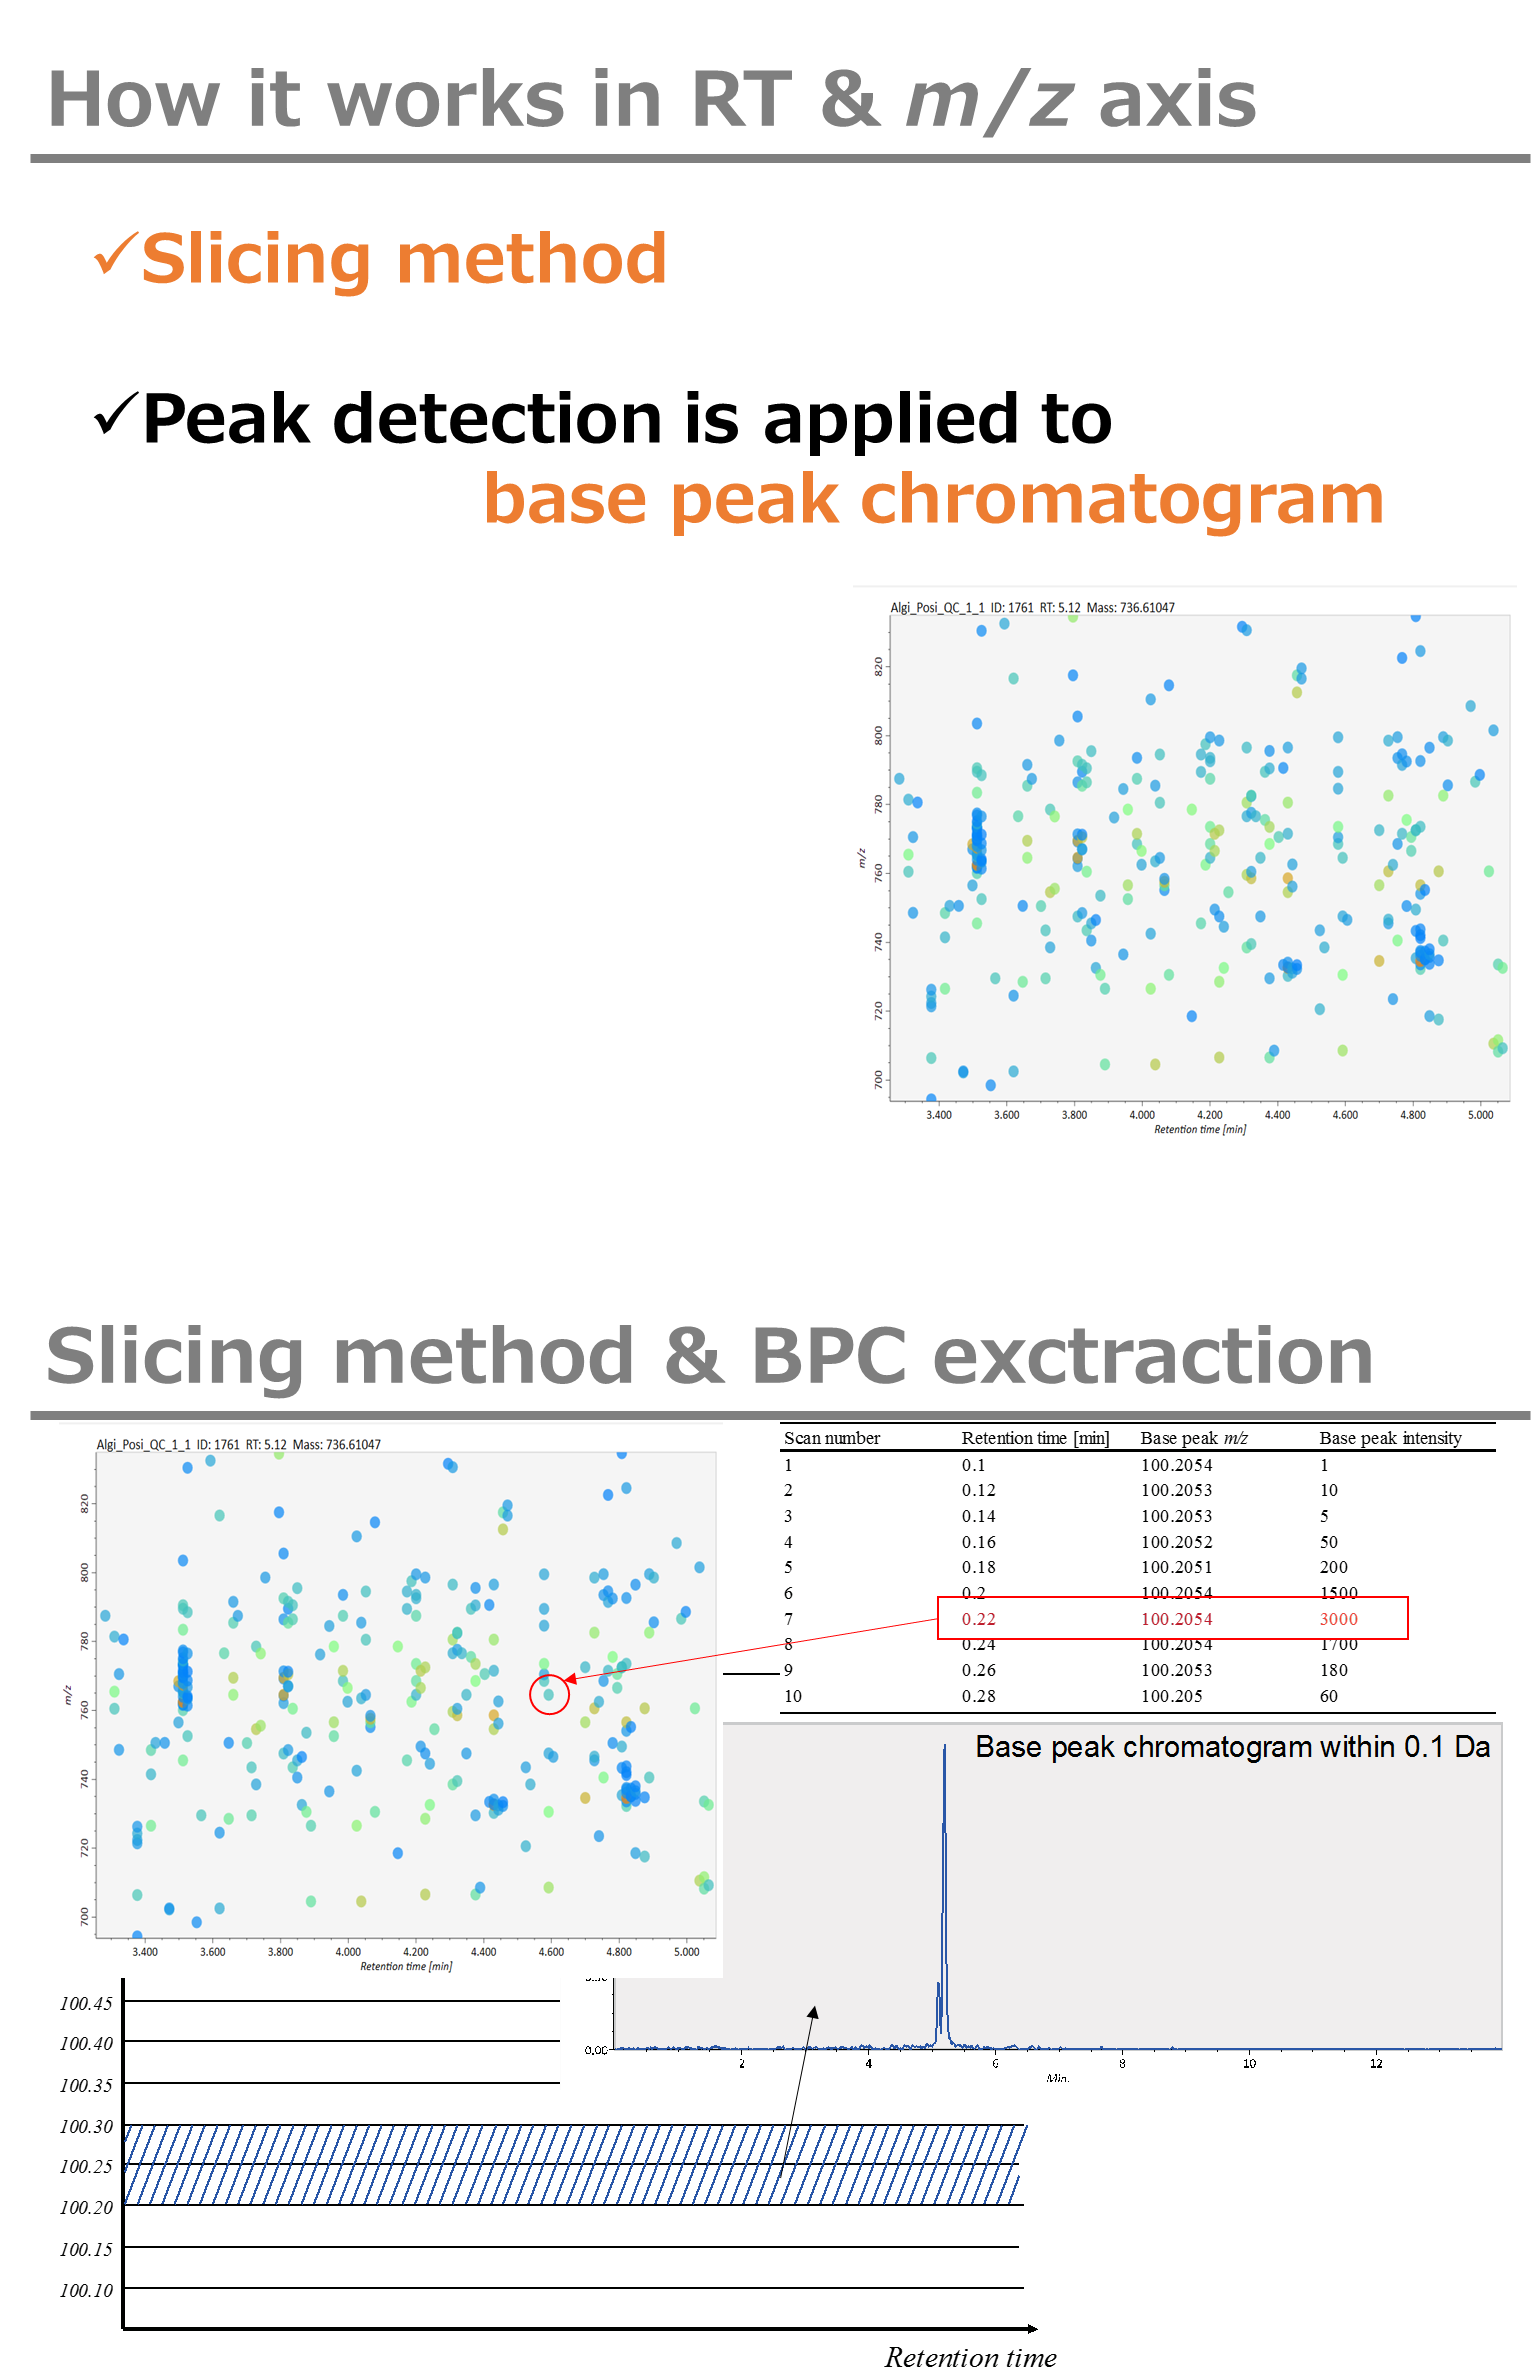
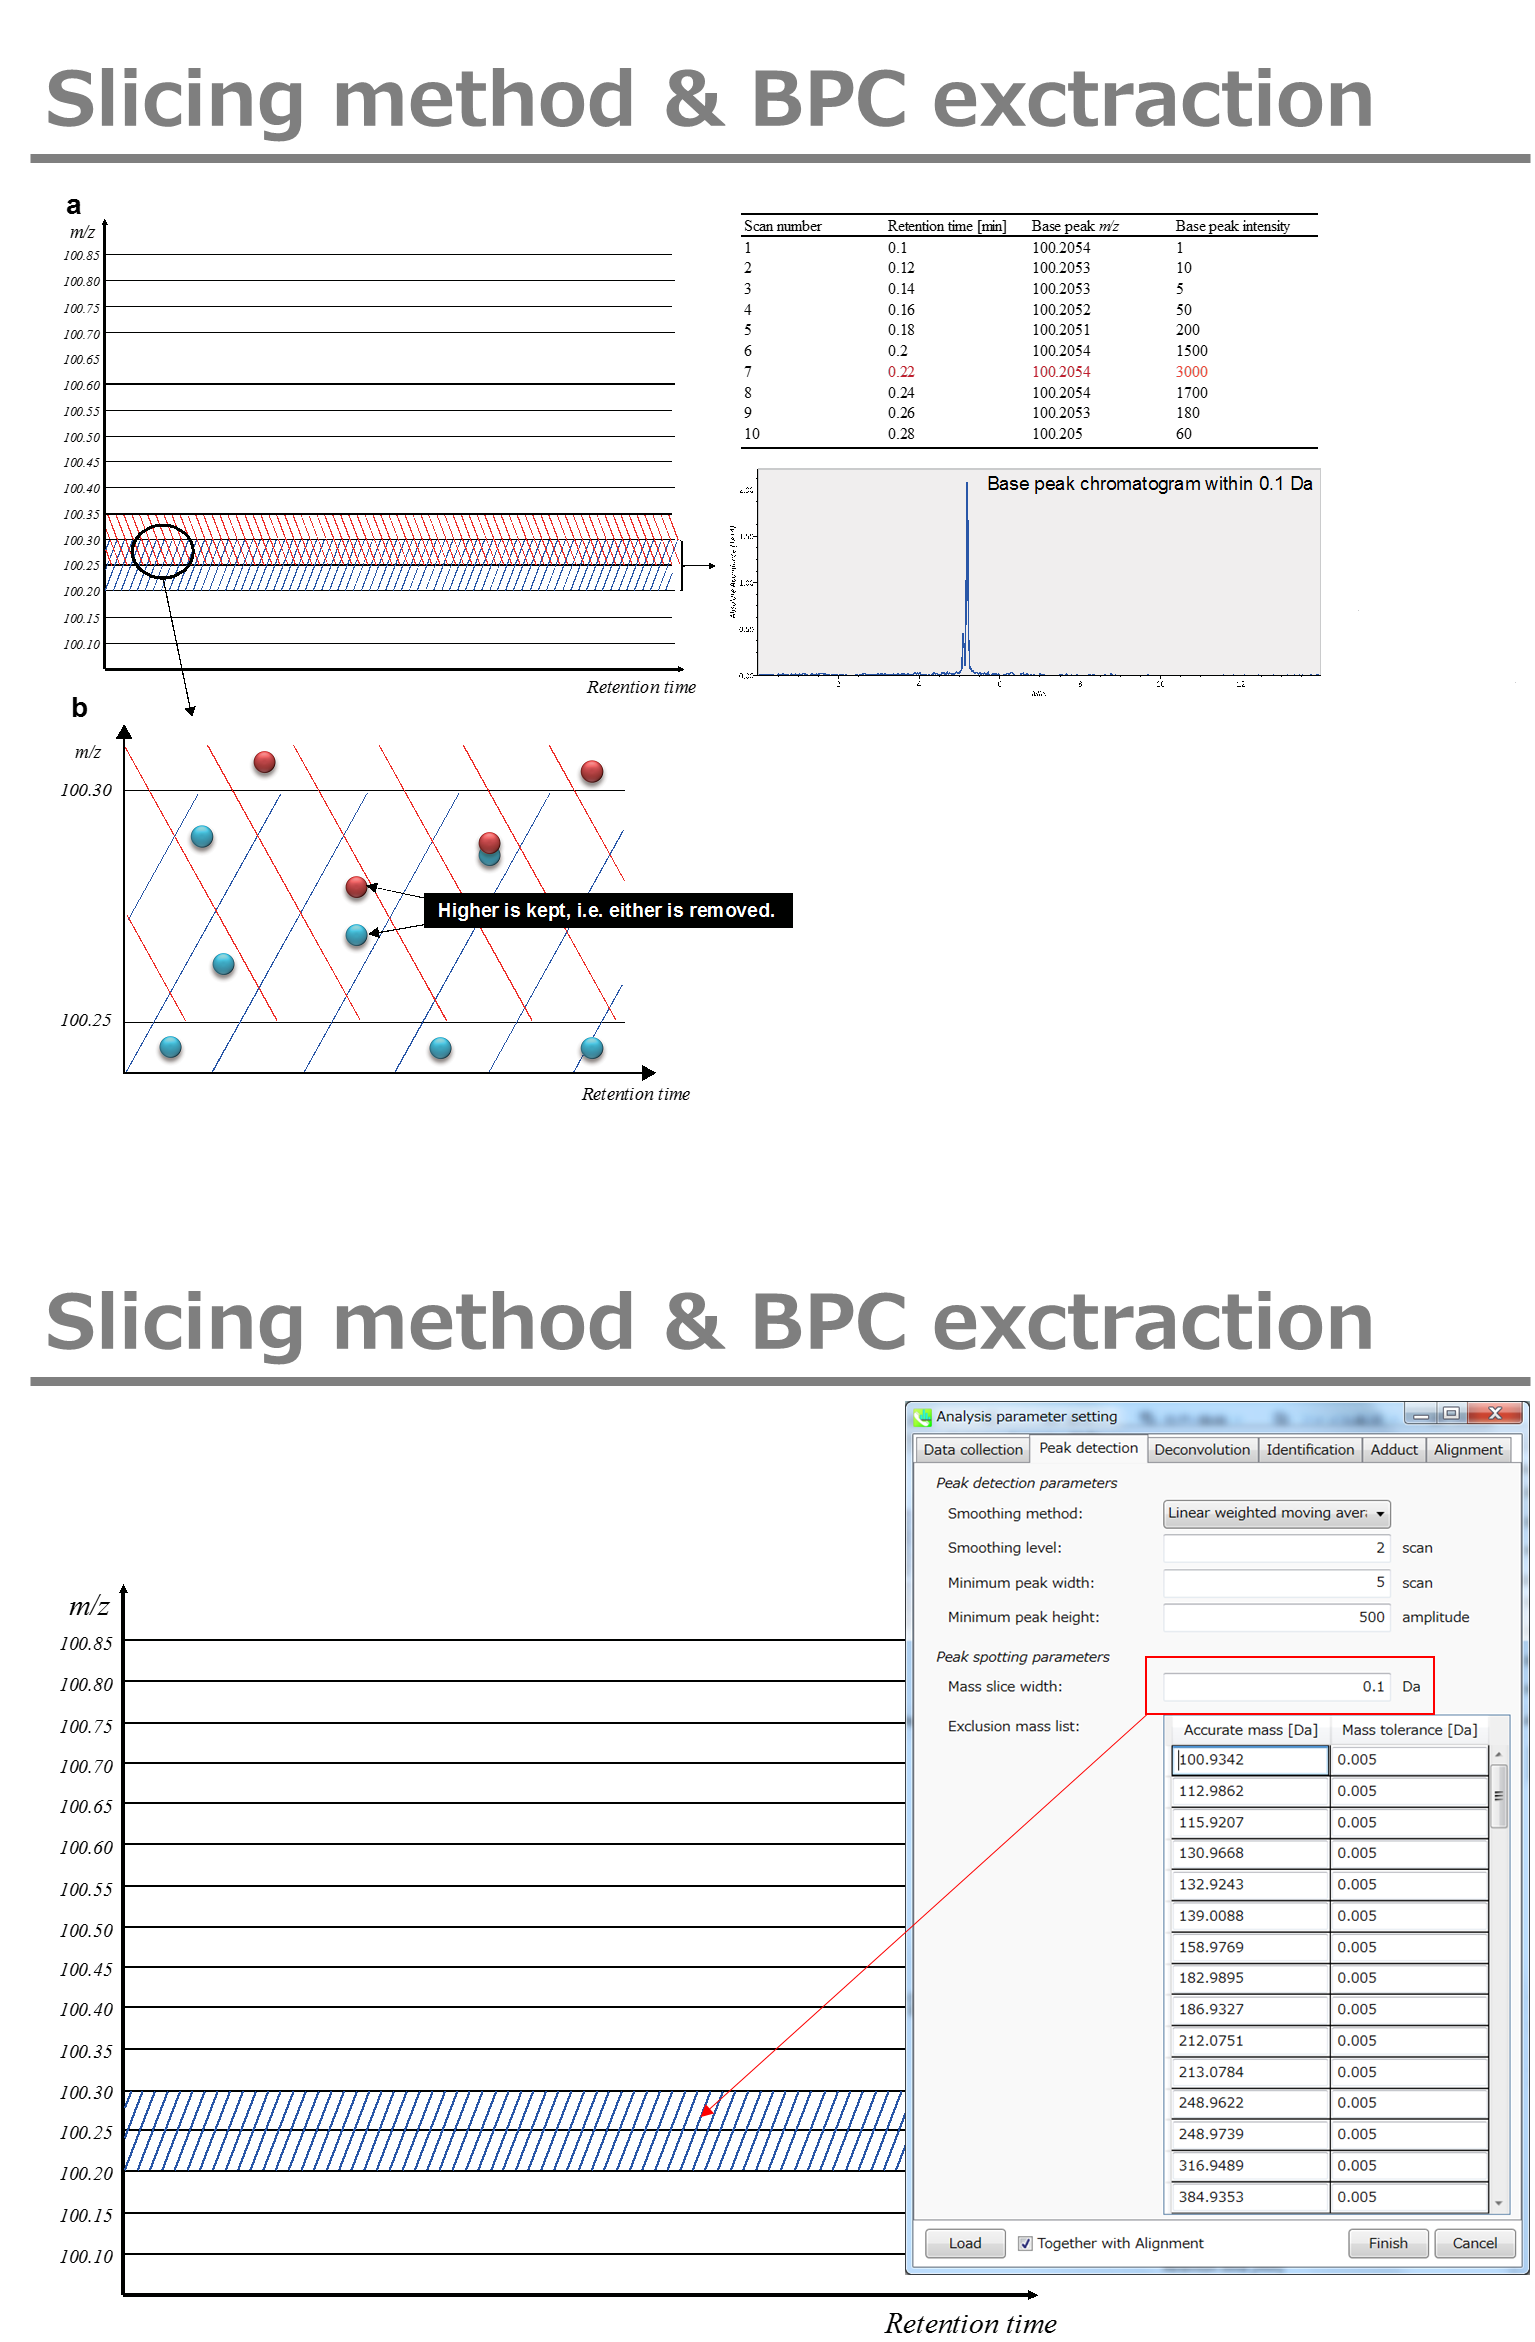
The width of mass slice is set here. From our experience, 0.1 and 0.05 are suitable for Q-TOF and Orbitrap, respectively.
此处设置了质量切片的宽度。根据我们的经验,0.1 和 0.05 分别适用于 Q-TOF 和 Orbitrap。
Smoothing method: 平滑方法:
Linear-weighted moving average is used for the peak detection as default to accurately determine the peak left- and right edges.
线性加权移动平均线默认用于峰值检测,以准确确定峰值左边缘和右边缘。
The recommended smoothing level is 1-3.
建议的平滑级别为 1-3。
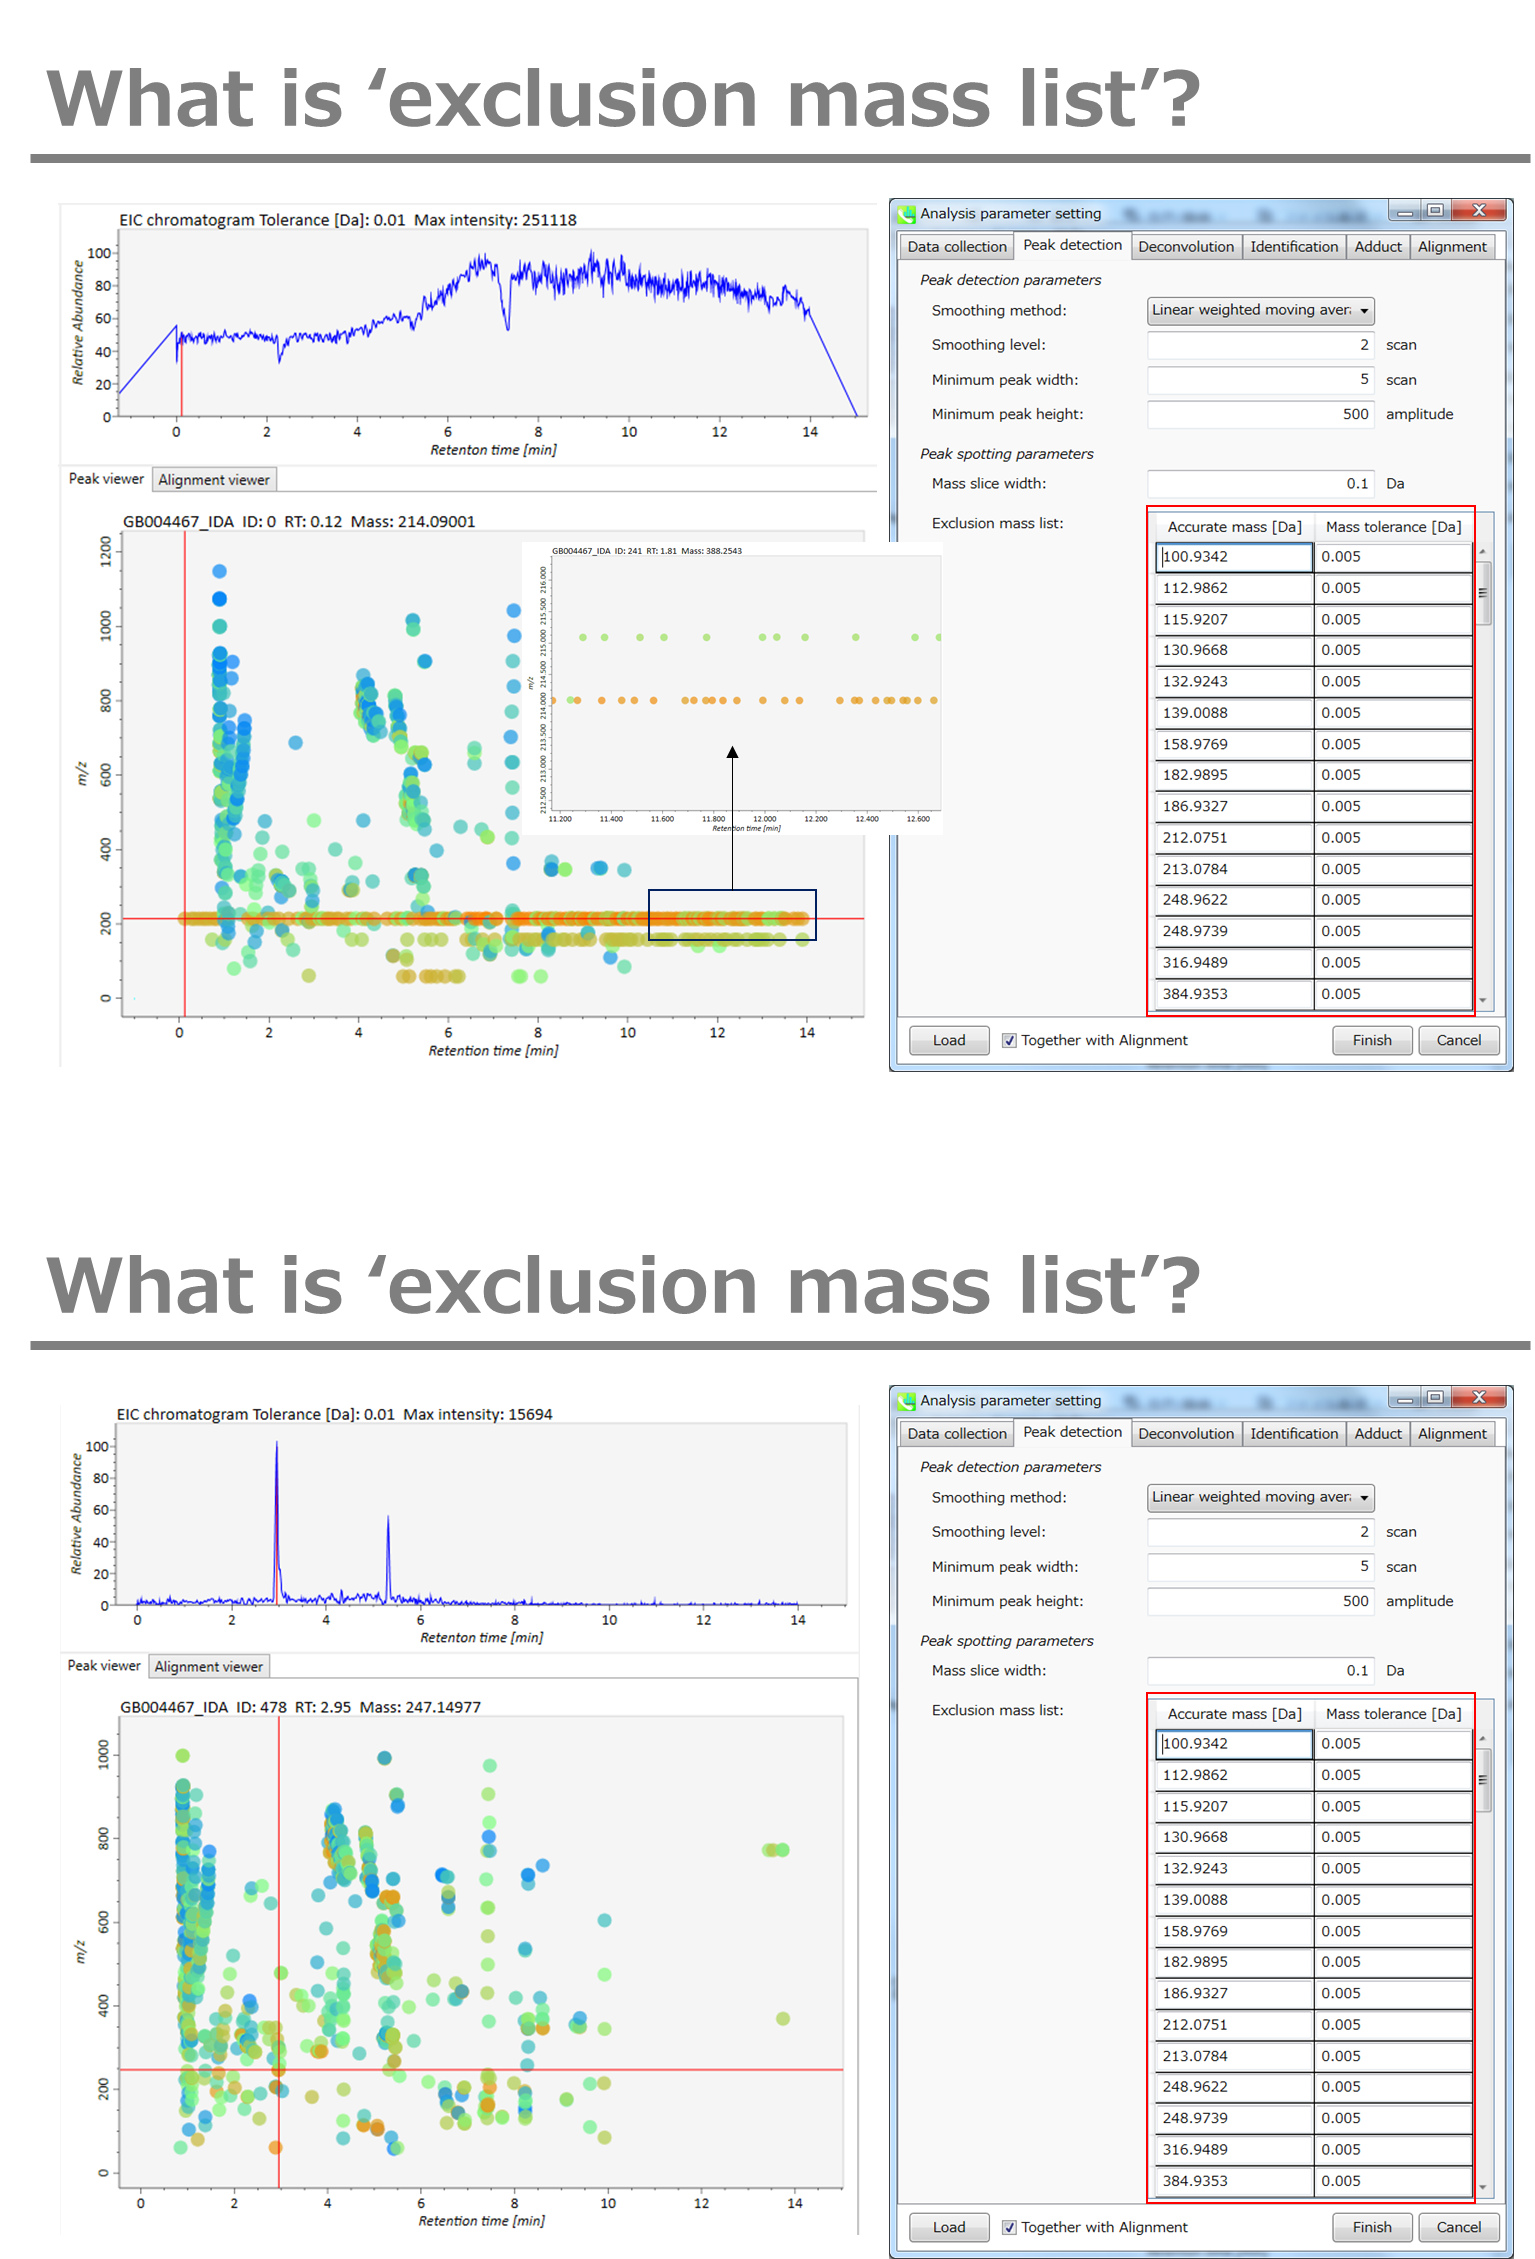
If you already know unwanted m/z peaks because of columns or solvent contaminants, you can specify them in the Exclusion mass list.
如果您已经知道由于色谱柱或溶剂污染物而产生的不需要的m/z峰,则可以在排除质量列表中指定它们。
A part of http://prime.psc.riken.jp/Metabolomics_Software/MS-DIAL/MS-DIAL%20FAQ-vs2.pdf
http://prime.psc.riken.jp/Metabolomics_Software/MS-DIAL/MS-DIAL%20FAQ-vs2.pdf 的一部分
Section 2-3-3 第 2-3-3 节
MS2Dec tab MS2Dec 选项卡
The sigma window value is highly affected by the resolution of deconvolutions. A higher value (0.7-1.0) will reduce the peak top resolutions, i.e. the number of resolved peaks will be decreased. On the other hand, a lower value (0.1-0.3) may also recognize many noise chromatographic peaks.
sigma 窗口值受反卷积分辨率的影响很大。较高的值(0.7-1.0)将降低峰值最高分辨率,即分离的峰值数量将减少。另一方面,较低的值(0.1-0.3)也可以识别许多噪声色谱峰。
You may be able to set a cut off value to reduce the MS noises (see Section 3-3 of Chapter 3).
您可以设置一个截止值来降低 MS 噪声(参见第 3 章第 3-3 节)。
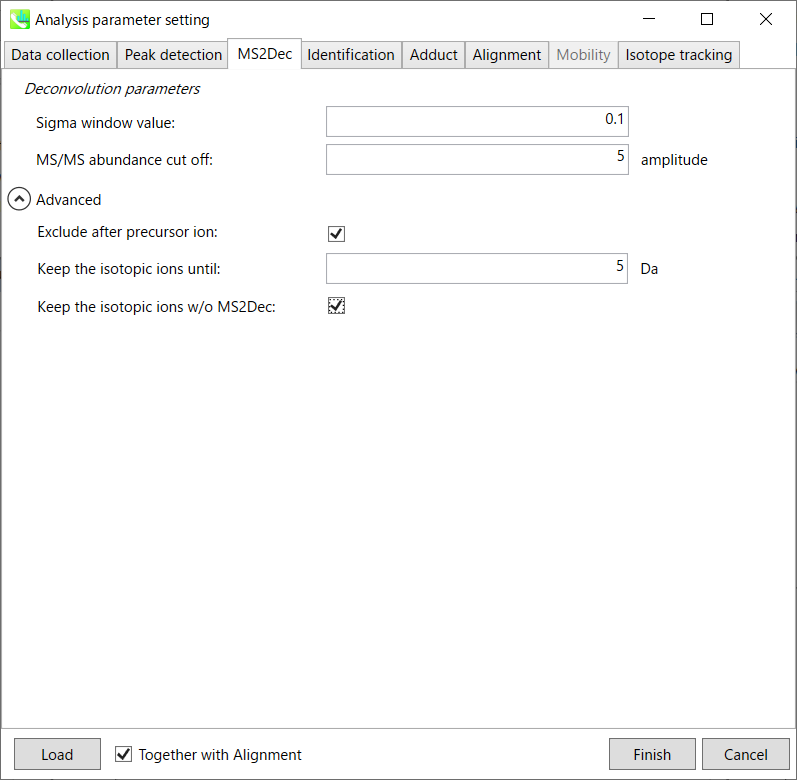
Exclude after precursor ion:
在母离子后排除:
If you want to remove the product ions after the focused precursor ion (recommended for metabolomics and lipidomics), check this box.
如果要去除聚焦母离子(推荐用于代谢组学和脂质组学)之后的子离子,请选中此框。
Keep the isotopic ions until:
保持同位素离子,直到:
In fact, the isotopic patterns in MS1 spectra are frequently disturbed. On the other hand, there are some cases that the isotopic patterns in MS/MS spectra are clearer than that of MS1 spectra, which can be used for the accurate annotation of molecular formula. If you set this parameter as 5 Da, the ions until precursor + 5 Da are kept after MS2Dec algorithm is finished.
事实上,MS1光谱中的同位素模式经常受到干扰。另一方面,在某些情况下,MS/MS谱图中的同位素模式比MS1谱图更清晰,可用于分子式的准确注释。如果将此参数设置为 5 Da,则在 MS2Dec 算法完成后,将保留母离子 + 5 Da 之前的离子。
Keep the isotopic ions w/o MS2Dec:
保持同位素离子不带MS2Dec:
The MS2Dec algorithm may sometimes erase the precursor’s isotopic ions due to the mathematics issues. Therefore, you can keep the raw MS/MS spectra only for the precursor’s isotopic ions by checking this option.
由于数学问题,MS2Dec算法有时可能会擦除母离子的同位素离子。因此,通过选中此选项,您可以仅保留母离子同位素离子的原始 MS/MS 谱图。
Section 2-3-4 第 2-3-4 节
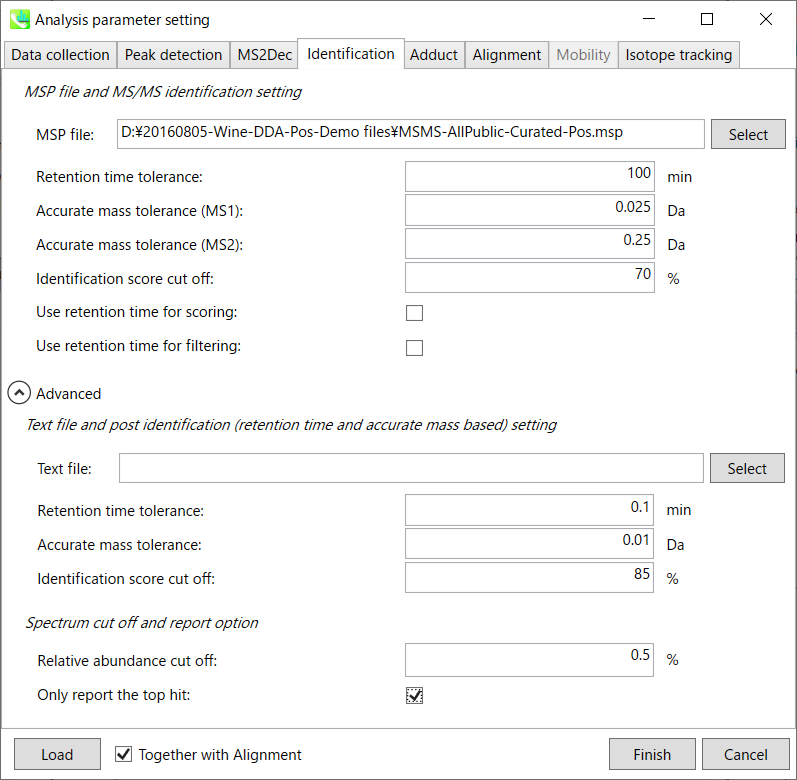
Identification tab “标识”选项卡
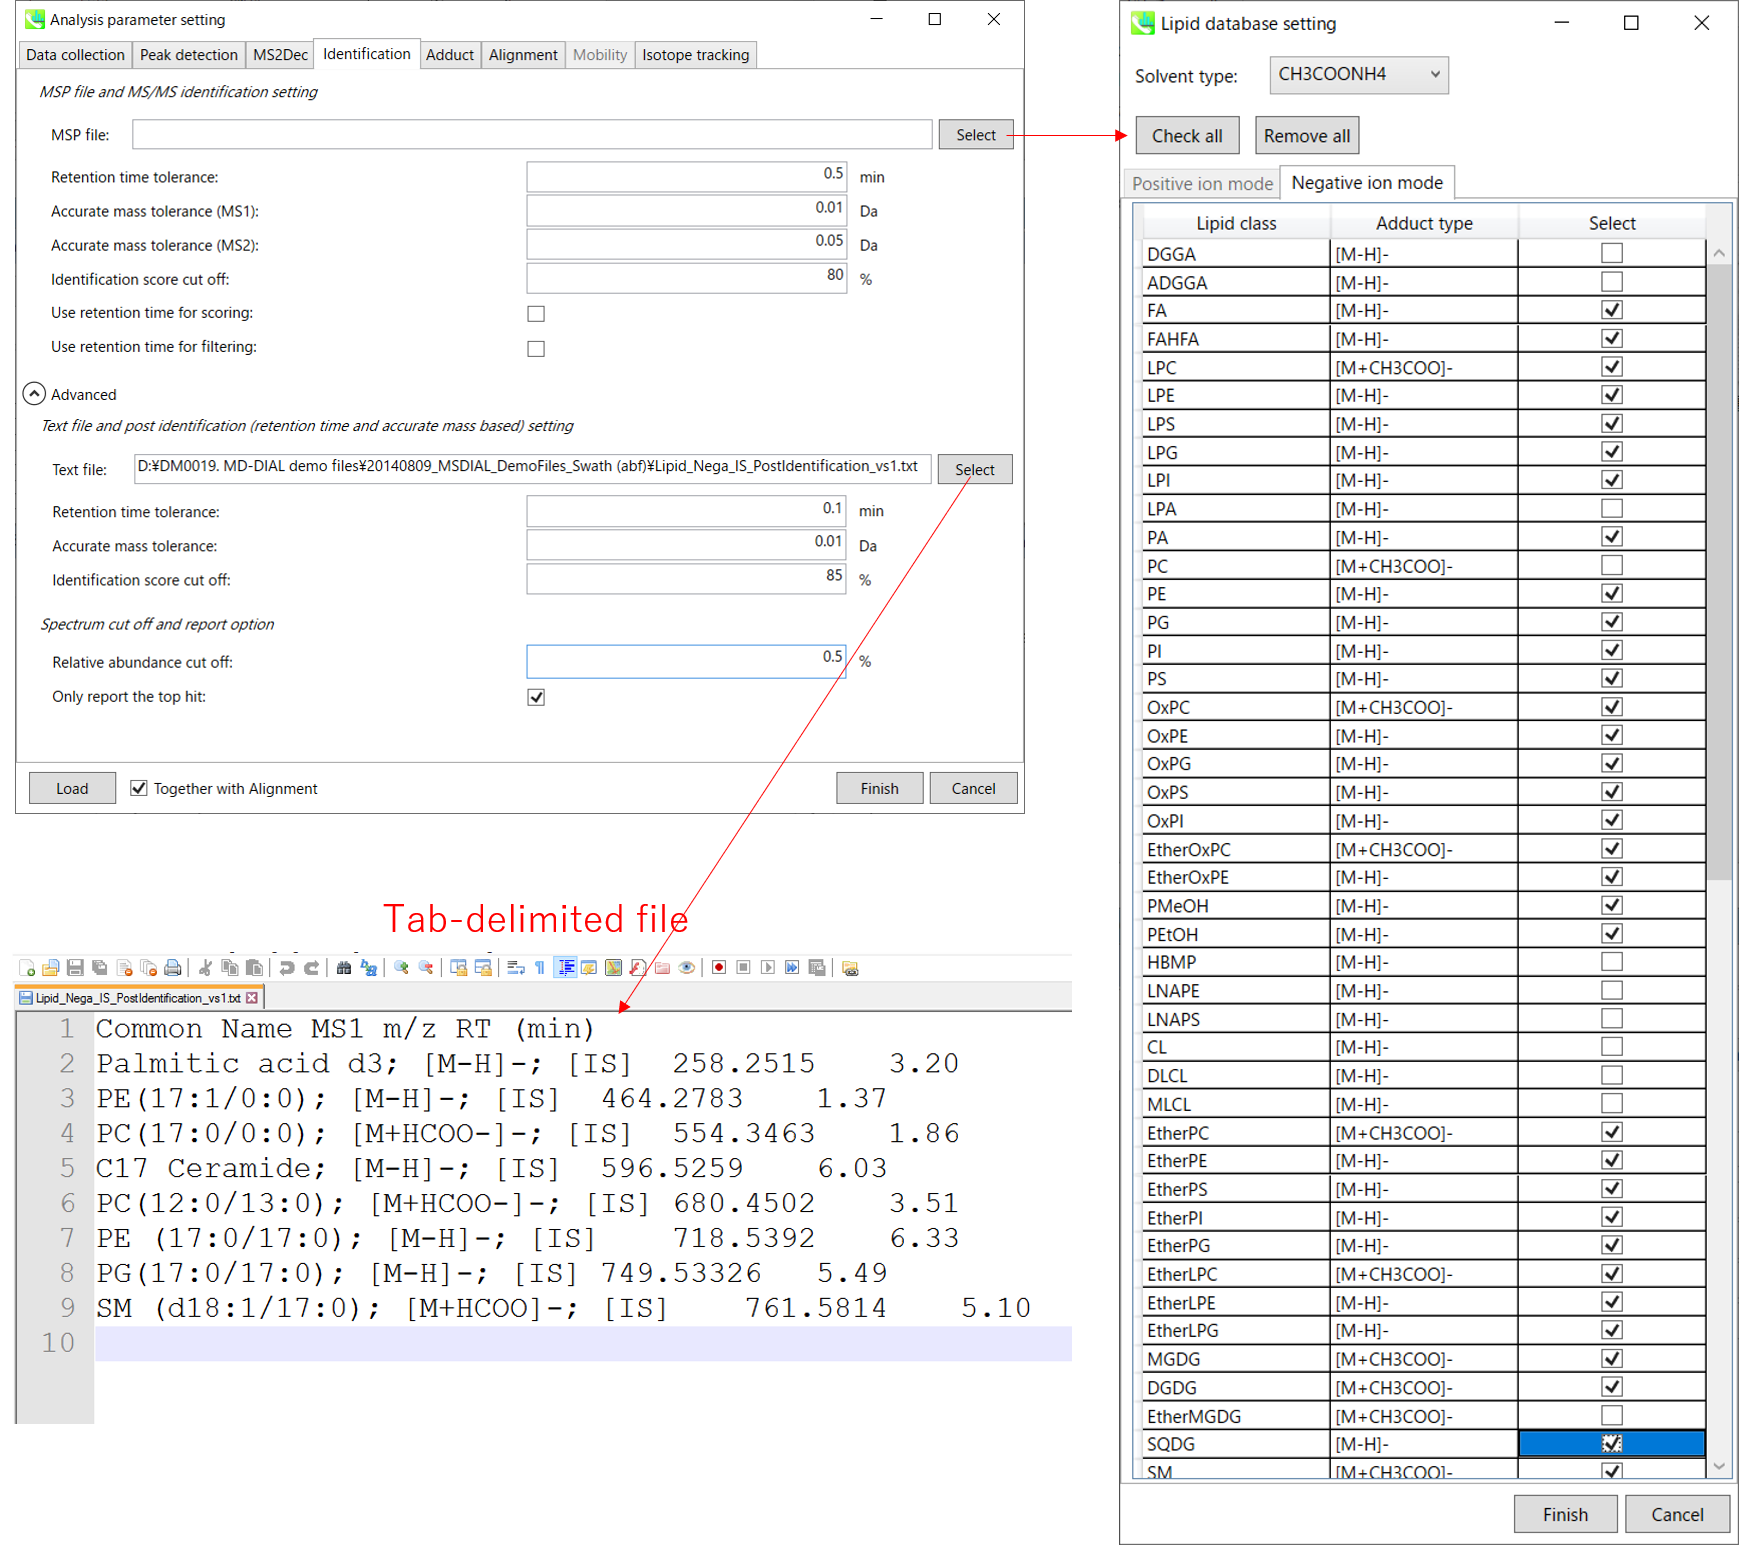
MSP file: MSP 文件:
In the case that you selected ‘lipidomics’ project, select what you want to annotate in your data sets for lipid profiling. Here, for algae lipidomics, tick the above figure’s lipids: FA, LPC, LPE, PA, PC, PE, PG, PI, PS, MGDG, DGDG, and SQDG.
如果您选择了“脂质组学”项目,请选择要在数据集中注释的内容以进行脂质分析。在这里,对于藻类脂质组学,勾选上图的脂质:FA、LPC、LPE、PA、PC、PE、PG、PI、PS、MGDG、DGDG 和 SQDG。
For this tutorial data, in which ammonium formate was used as modifier, select HCOONH4 (ammonium formate) as Solvent type in the window ‘Lipid database setting’, although nowadays CH3COONH4 (ammonium acetate) is basically used as modifier.
对于使用甲酸铵作为改性剂的本教程数据,在“脂质数据库设置”窗口中选择HCOONH4(甲酸铵)作为溶剂类型,尽管现在基本上使用CH3COONH4(醋酸铵)作为改性剂。
Parameters: 参数:
If you put retention time (RT) information in your MSP file, set the RT tolerance value . For example, our internal lipid DB includes the predicted RT information optimized for our 15 min LC method. Here RT time tolerance is set to 1.5 min for this demo data. If suitable RT information is unavailable, set the tolerance 100 (default) or larger (larger than your LC time). The two mass tolerances for MS1 and MS2 are required for the compound search and are dependent on your instrument performance.
如果将保留时间 (RT) 信息放在 MSP 文件中,请设置 RT 容差值。例如,我们的内部脂质数据库包括针对我们的 15 min LC 方法优化的预测 RT 信息。此处,此演示数据的 RT 时间容差设置为 1.5 分钟。如果没有合适的 RT 信息,请将容差设置为 100(默认)或更大(大于 LC 时间)。MS1 和 MS2 的两个质量允差是化合物搜索所必需的,具体取决于您的仪器性能。
The cutoff of the identification score should be greater than 70% or 80% to avoid false positives.
识别分数的临界值应大于 70% 或 80%,以避免误报。
Unless you check neither Use retention time for scoring nor Use retention time for filtering, the value of RT tolerance does not mean anything.
除非既未选中“使用保留时间进行评分”,也未选中“使用保留时间进行筛选”,否则 RT 容差的值没有任何意义。
Text file and post identification (retention time and accurate mass based) setting:
文本文件和柱子识别(保留时间和基于质量的准确)设置:
If you want to perform “post identification” processing, set your text file in Text file. (Tutorial data: Lipid_Nega_IS_PostIdentification_vs1.txt)
如果要执行“识别后”处理,请在“文本文件”中设置文本文件。(教程数据:Lipid_Nega_IS_PostIdentification_vs1.txt)
The meanings of parameters are the same as MSP based identification explained above.
参数的含义与上面解释的基于MSP的识别相同。
Relative abundance cut off:
相对丰度截止:
the mass spectrum peak less than the user-defined value will not be used for the MS/MS similarity calculation.
小于用户定义值的质谱图峰将不用于MS/MS相似性计算。
Only report the top hit:
仅报告最热门的点击:
Since some chromatogram peaks will be annotated as the same compound from the identification algorithm, this option allows us to determine only one candidate from such multiple results by means of the identification score.
由于某些色谱峰将在鉴定算法中被注释为同一化合物,因此此选项允许我们通过鉴定分数从此类多个结果中仅确定一个候选化合物。
Section 2-3-5 第 2-3-5 节
Adduct tab 加合物选项卡
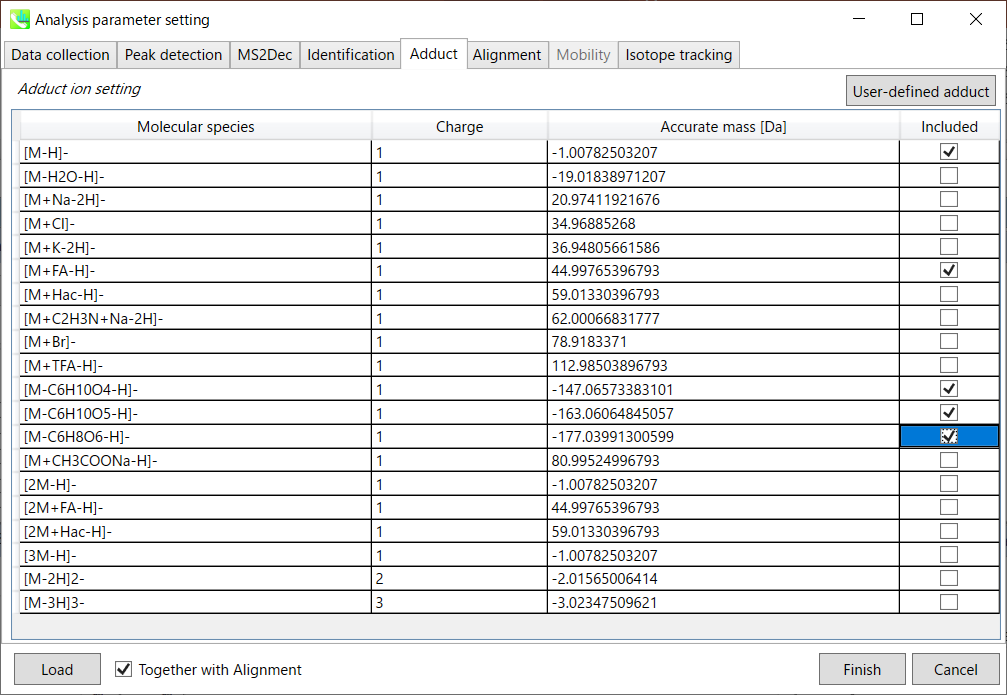
Adduct ion setting: You can tick the adduct ions and charge values to be considered.
加合离子设置:您可以勾选要考虑的加合离子和电荷值。
* see also the Section 1-6-2 of Chapter 1 for the explanation of how to determine your own adduct ion.
* 另请参阅第 1 章第 1-6-2 节,了解如何确定自己的加合物离子。
Section 2-3-6 第 2-3-6 节
Alignment tab “对齐方式”选项卡
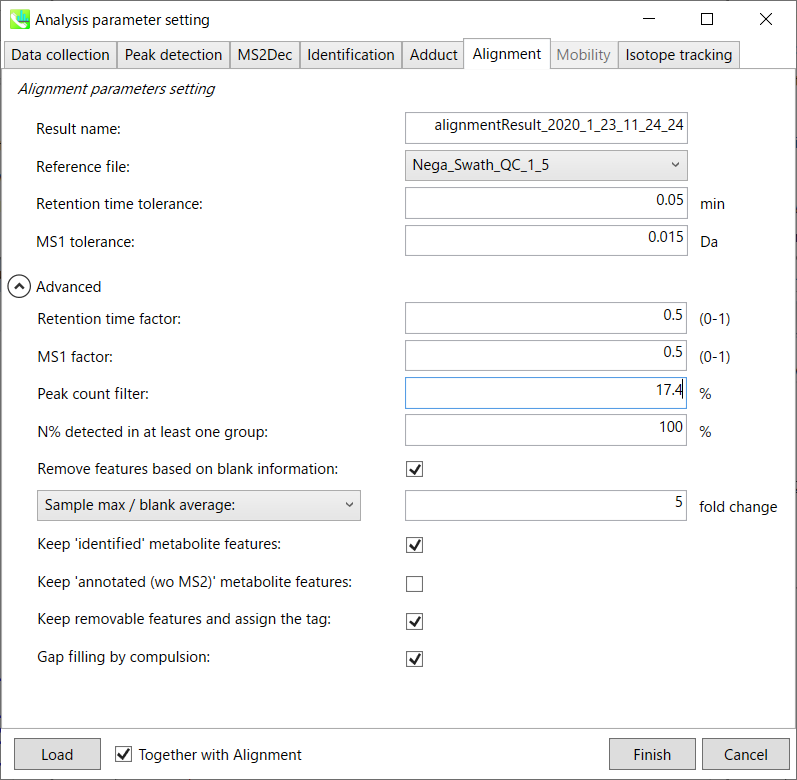
Parameters: 参数:
Refult name will be the name of each alignment shown at the pane ‘Alignement navigator’ in the main window.
Refult name 将是主窗口中“对齐导航器”窗格中显示的每个对齐的名称。
If you already have a suitable quality control (QC) data, typically a mixed sample data, then specify the QC file in Reference file. All sample data will be aligned to this QC file.
如果您已经有合适的质量控制 (QC) 数据(通常是混合样品数据),请在参考文件中指定 QC 文件。所有样品数据都将与此 QC 文件对齐。
The RT and MS1 tolerances for peak alignment depend on your chromatographic conditions (see MS-DIAL mathematics for details).
峰比对的RT和MS1允差取决于您的色谱条件(有关详细信息,请参见MS-DIAL数学)。
If you want to remove specific peaks that are not fully detected in the alignment, specify the peak count filter. For example, the tutorial data include at least 4 biological replicates with the same peak information and the total number of data is 23. Then, you may set the peak count filter as (4/23)∗100 = 17.4 %. This means peaks will be removed when they include missing values for more than 17.4%.
如果要删除在对齐中未完全检测到的特定峰,请指定峰计数过滤器。例如,教程数据包括至少 4 个具有相同峰信息的生物学重复,数据总数为 23。然后,您可以将峰值计数滤波器设置为 (4/23)∗100 = 17.4 %。这意味着当峰值包含超过 17.4% 的缺失值时,将删除峰值。
Moreover, in ‘N% detected in at least one group’, the filtering is done within each sample group. If it is set to 100%, the peaks should be detected in all of samples of a class.
此外,在“至少一组中检测到 N%”中,过滤在每个样本组内完成。如果设置为 100%,则应在一类的所有样本中检测到峰。
Retention time factor and MS1 factor: These values indicate the importance of either RT or MS1 to compare and evaluate the similarity of the spectra among samples based on RT and MS1 tolerance.
保留时间因子和MS1因子:这些值表明RT或MS1对于基于RT和MS1耐受性比较和评估样品之间谱图相似性的重要性。
Remove features based on blank information:
根据空白信息移除要素:
If you add information of blank samples and want to reflect the blank features information into the result of the analysis, tick this to evaluate the peaks of blank samples.
如果添加空白样本信息并希望将空白特征信息反映到分析结果中,请勾选此项以评估空白样本的峰值。
Checking this box allows you to edit the three checkboxes, Keep ‘Reference matched’ metabolite features, Keep ‘Suggested (without MS2)’ metabolite features, and Keep removable features and assign the tag.
选中此框后,您可以编辑三个复选框:保持'参考匹配'代谢物特征、保留'建议(无 MS2)'代谢物特征和保留可移动特征并分配标签。
After checking Remove features based on blank information, you will be able to edit the checkbox ‘blank filter’ on the pane ‘Peak spot navigator’ in the main window so that you can check which features were filtered as removable features unless you uncheck Keep removable features and assign the tag.
选中基于空白信息移除要素后,您将能够编辑主窗口中“峰点导航器”窗格中的“空白过滤器”复选框,以便您可以检查哪些要素被过滤为可移动要素,除非您取消选中保留可移动要素并分配标签。
Keep ‘Reference matched’ metabolite features:
保持“参考匹配”代谢物特征:
‘Reference matched’ metabolite means the metabolites by reference libraries (MSP or Text library).
“参考匹配”代谢物是指通过参考文库(MSP或文本文库)获得的代谢物。
Keep ‘Suggested (without MS2)’ metabolite features:
保留“建议(不含 MS2)”代谢物特征:
‘Suggested (without MS2)’ means that metabolites are annotated by the MS1 feature. Keep removable features and assign the tag:
“建议(不含 MS2)”表示代谢物由 MS1 特征注释。保留可移动功能并分配标记:
If you check this, even though the features do not exceed the blank feature threshold, the peaks will remain in all result features. But you can confirm the result by using “Blank filter” checkbox of MS-DIAL main window. If you uncheck this, removable features will be deleted and thus that blank features will not be included anymore in all analyzed data, meaning you cannot see the blank-oriented peak features in the main window after alignment.
如果选中此选项,即使要素未超过空白要素阈值,峰值仍将保留在所有结果要素中。但是您可以使用MS-DIAL主窗口的“空白过滤器”复选框来确认结果。如果取消选中此选项,则可移除要素将被删除,因此空白要素将不再包含在所有分析数据中,这意味着对齐后无法在主窗口中看到空白方向的峰值要素。
Gap filling by compulsion: If you check this, the peak recognition is performed by the average peak width of samples having the metabolite feature even though no local maximum is observed in the chromatogram. This is validated by default.
强制填空:如果选中此项,则峰识别是通过具有代谢物特征的样品的平均峰宽执行的,即使在色谱图中没有观察到局部最大值也是如此。默认情况下,将对此进行验证。
Note: When you execute the compound identification, the representative spectra with identification results are automatically determined from one of imported files which has the highest identification score. In the case that an alignment spot is not identified in any samples, the MS/MS spectrum of one sample which has the highest ion abundance in imported files is assigned as the representative spectrum.
注意:当您执行化合物鉴定时,将自动从鉴定分数最高的导入文件之一中确定具有鉴定结果的代表性谱图。如果在任何样品中未识别到对齐点,则将导入文件中离子丰度最高的一个样品的MS/MS谱图指定为代表性谱图。
Section 2-4 第2-4节
Data curation for the reduction of false positive identifications
减少误报标识的数据管理
MS-DIAL can automatically identify the metabolite peaks by the similarity calculation of retention time, precursor m/z, isotopic ratios, and MS/MS spectrum with the reference databases. However, unfortunately, there are also false positive identifications in the result of peak identifications as well as true positives. Therefore, as an analytical chemist, the result should be manually checked and sometimes some of identified peaks should be curated and modified. Of course, the ultimate goal is the perfect identification without any false positive- and negative identifications.
MS-DIAL可以通过与参考数据库的保留时间、母离子m/z、同位素比值和MS/MS谱图的相似性计算来自动识别代谢物峰。然而,不幸的是,在峰鉴定结果中也存在假阳性鉴定和真阳性。因此,作为分析化学家,应手动检查结果,有时应整理和修改一些已鉴定的峰。当然,最终目标是完美识别,没有任何假阳性和假阴性识别。
Practically, what to manually curate the identification result of your representative alignment file since the identification result of its alignment file will be reflected in the final output such as ‘peak height’ matrix etc. Using the GUI of MS-DIAL, you can check if an aligned spot is a false positive/negative identification or not. For further information about GUI of MS-DIAL, see Chapter 5.
实际上,手动管理代表性对齐文件的识别结果,因为其对齐文件的识别结果将反映在最终输出中,例如“峰高”矩阵等。使用 MS-DIAL 的 GUI,您可以检查对齐的点是否为假阳性/假阴性识别。有关 MS-DIAL 的 GUI 的更多信息,请参阅第 5 章。
Chapter 3 第 3 章
LC/MS or LC/MS/MS (data dependent MS/MS) project with user-defined MS/MS database (MSP format) in MS-DIAL
LC/MS或LC/MS/MS(数据相关MS/MS)项目,采用MS-DIAL格式,用户定义MS/MS数据库(MSP格式)
Here, a project from data dependent MS/MS acquisition in combination with a user-defined MSP library (an integration library of MassBank, GNPS, and Respect) is demonstrated. The experimental protocol is described in the previous research: http://pubs.acs.org/doi/abs/10.1021/acs.jafc.5b04890. The ABF files for this demonstration can be downloaded from our website: http://prime.psc.riken.jp/Metabolomics_Software/MS-DIAL/index.html.
在这里,演示了一个基于数据的 MS/MS 采集项目,该项目结合了用户定义的 MSP 库(MassBank、GNPS 和 Respect 的集成库)。实验方案在之前的研究中有所描述:http://pubs.acs.org/doi/abs/10.1021/acs.jafc.5b04890。此演示的 ABF 文件可以从我们的网站下载:http://prime.psc.riken.jp/Metabolomics_Software/MS-DIAL/index.html。
This section uses total 6 files and the MSP file is contained in the same folder of this demonstration. Also, there is a parameter file (Param.med) in this folder to be used in MS-DIAL for the quick start.
本节总共使用 6 个文件,MSP 文件包含在本演示的同一文件夹中。此外,此文件夹中还有一个参数文件 (Param.med),可在 MS-DIAL 中用于快速入门。
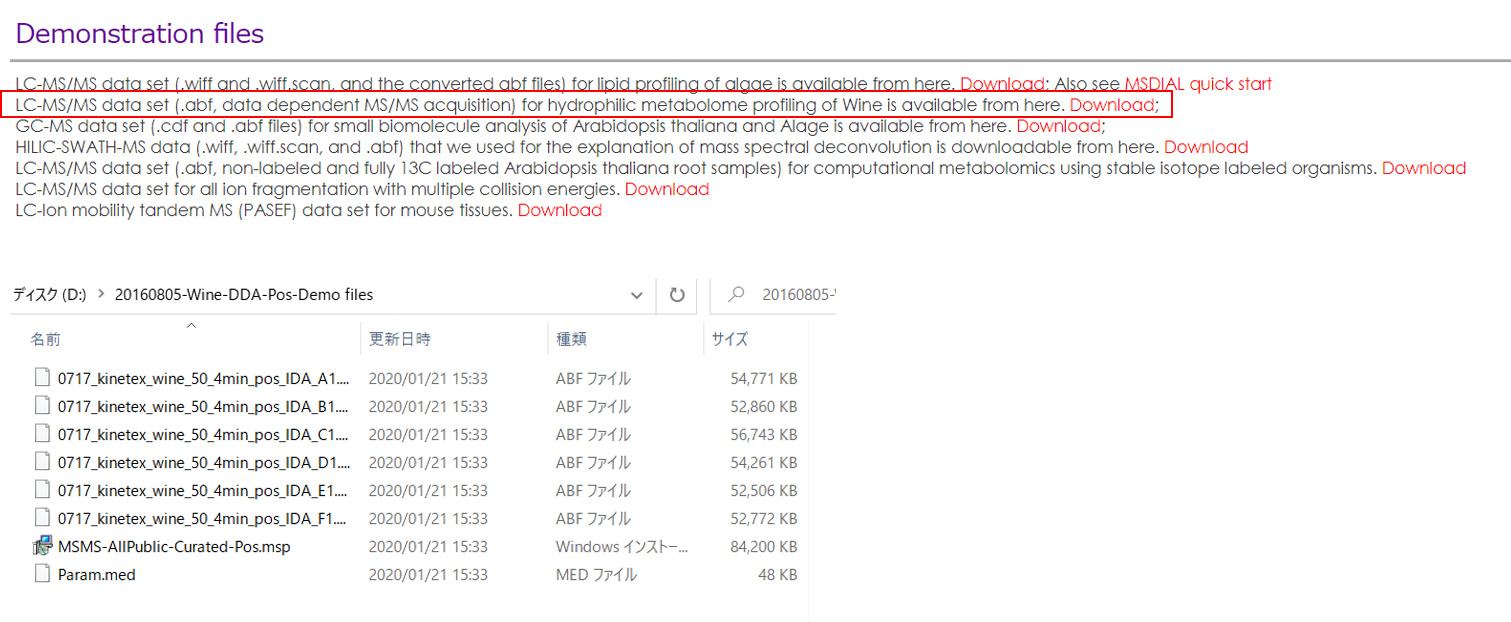
Experiment summary: 实验总结:
Liquid chromatography: total 4 min run per sample with Kinetex C18 2.6 μm (50×1.0 mm).
液相色谱法:使用Kinetex C18 2.6 μm (50×1.0 mm)对每个样品进行总共4分钟的运行。
Solvent A: water with 0.1% acetic acid
溶剂A:含0.1%乙酸的水
Solvent B: acetonitrile with 0.1% acetic acid
溶剂B:含0.1%乙酸的乙腈
Mass spectrometer: data dependent method with positive ion mode.
质谱仪:具有正离子模式的数据依赖性方法。
Collision energy, 35 V
碰撞能量,35 V
Collision energy spread, 15 V
碰撞能量扩散,15 V
Cycle time, 125 ms
循环时间,125 ms
Mass range, m/z 60-1250
质量范围,m/z 60-1250
Section 3-1 第 3-1 节
Starting up your project
启动项目
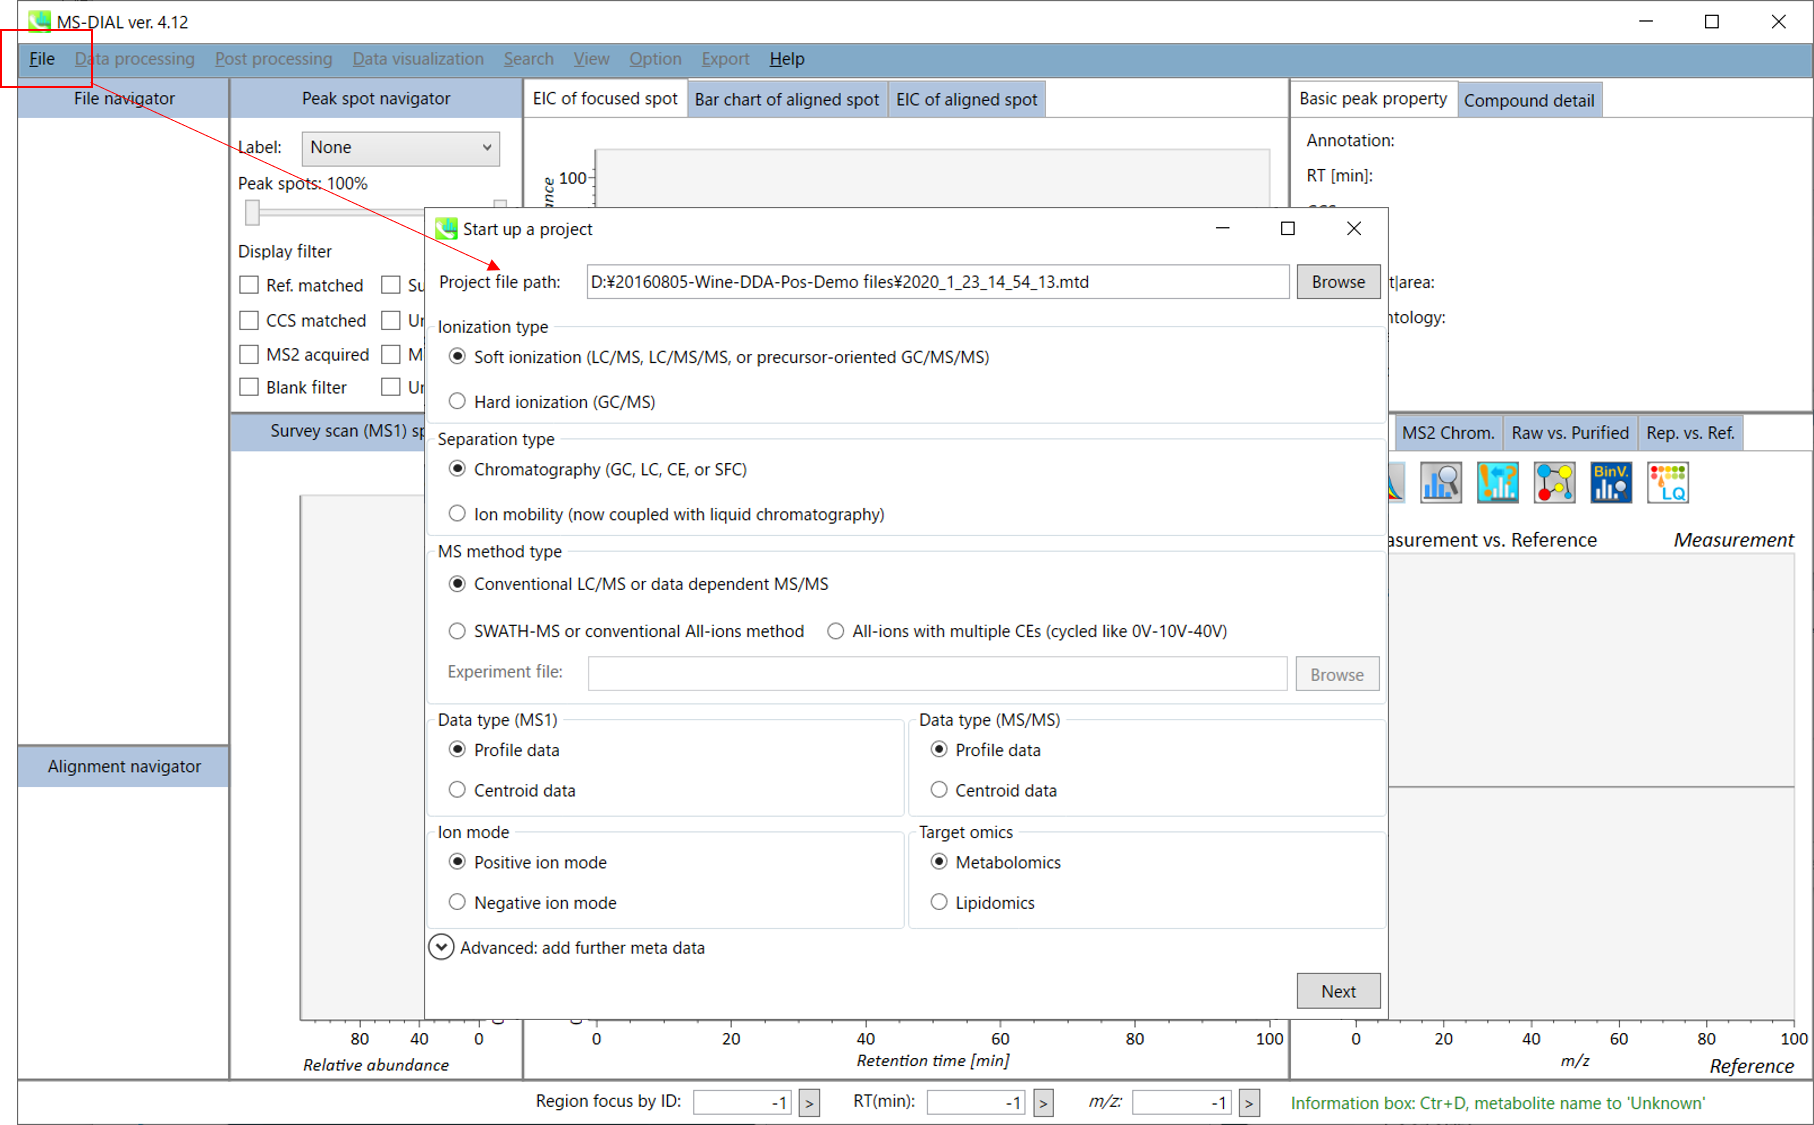
File -> new project
文件 -> 新项目
Set your project file path to the directory of your ABF files
将项目文件路径设置为 ABF 文件的目录
Select your MS method type as ‘Conventional LC/MS or data dependent MS/MS’
选择MS方法类型为“常规LC/MS或数据相关MS/MS”
Choose data type profile data for both MS1 and MS/MS
为 MS1 和 MS/MS 选择数据类型配置文件数据
Choose positive ion mode
选择正离子模式
Choose target omics as ‘Metabolomics’
选择目标组学作为“代谢组学”
If you select ‘lipidomics’ project, you do not have to prepare NIST MSP format library since MS-DIAL internally contains the theoretical MS/MS spectra of lipids (and actually, the fragment ions are future evaluated by the decision tree algorithm to provide the proper lipid structure representation.). Instead, you should select lipid subclasses needed by your data sets (see Chapter 2). On the other hand, when you select ‘metabolomics’ project, your own MSP file will be required for compound identification (see this chapter).
如果选择“脂质组学”项目,则无需准备NIST MSP格式库,因为MS-DIAL内部包含脂质的理论MS/MS谱图(实际上,决策树算法将来会评估碎片离子,以提供正确的脂质结构表示)。相反,您应该选择数据集所需的脂质亚类(参见第 2 章)。另一方面,当您选择“代谢组学”项目时,化合物鉴定将需要您自己的MSP文件(见本章)。
* see section 4 of chapter 1 as well for more detail* 详见第 1 章第 4 节
Section 3-2 第 3-2 节
Importing ABF files 导入 ABF 文件
Select ABF files 选择 ABF 个文件
If the file is a “quality control (QC)” sample for peak alignment, then set the type as such. (in this example, you do not have to change this setting.)
如果文件是用于峰对齐的“质量控制 (QC)”样品,则按此方式设置类型。(在此示例中,您不必更改此设置。
Edit Class ID of the files to divide sample data into each experimental group (Blank, QC, Group A, Group B, etc.). Sample files are allocated to each group and after analysis is finished the bar chart (or box plot) of each group will be appeared in the pane “Bar chart of aligned spot” of the main window (See Section 2-4).
编辑文件的类 ID,将样本数据划分为每个实验组(空白组、QC、A 组、B 组等)。样本文件被分配给每个组,分析完成后,每个组的条形图(或箱形图)将出现在主窗口的“对齐点条形图”窗格中(参见第 2-4 节)。
Note: 注意:
Please finalize your file name here otherwise you cannot change it anymore (these finalized file names will be appeared in the pane “File navigator” of the main window after finishing this analysis. See Section 2-4 for details).
请在此处最终确定您的文件名,否则您将无法再更改它(完成此分析后,这些最终的文件名将出现在主窗口的“文件导航器”窗格中。有关详细信息,请参阅第 2-4 节)。
If you want to define the injection volume of each file, you can additionally type each volume in the column “Inject. volume (μL)”.
如果要定义每个文件的进样量,可以在“注入”列中另外键入每个卷。体积 (μL)”。
Section 3-3 第3-3节
Setting parameters 设置参数
Section 3-3-1 第 3-3-1 节
Data collection tab “数据收集”选项卡
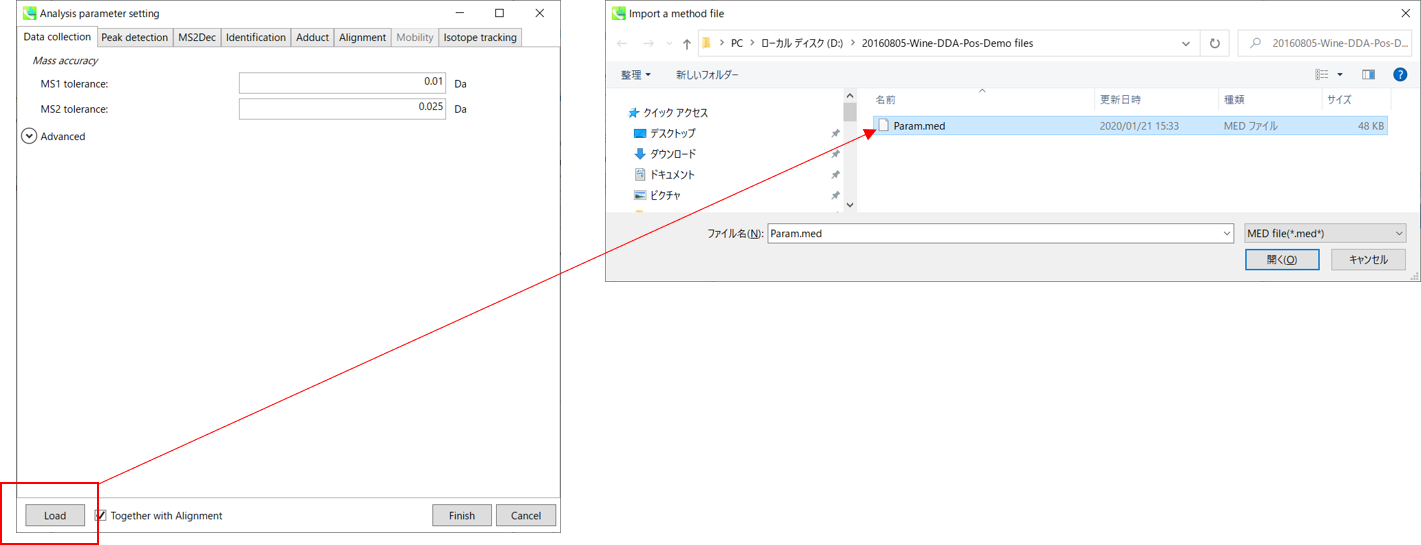
* For the quick start and its explanations, load ‘Param.med’ as shown above.
* 有关快速入门及其说明,请加载“Param.med”,如上所示。
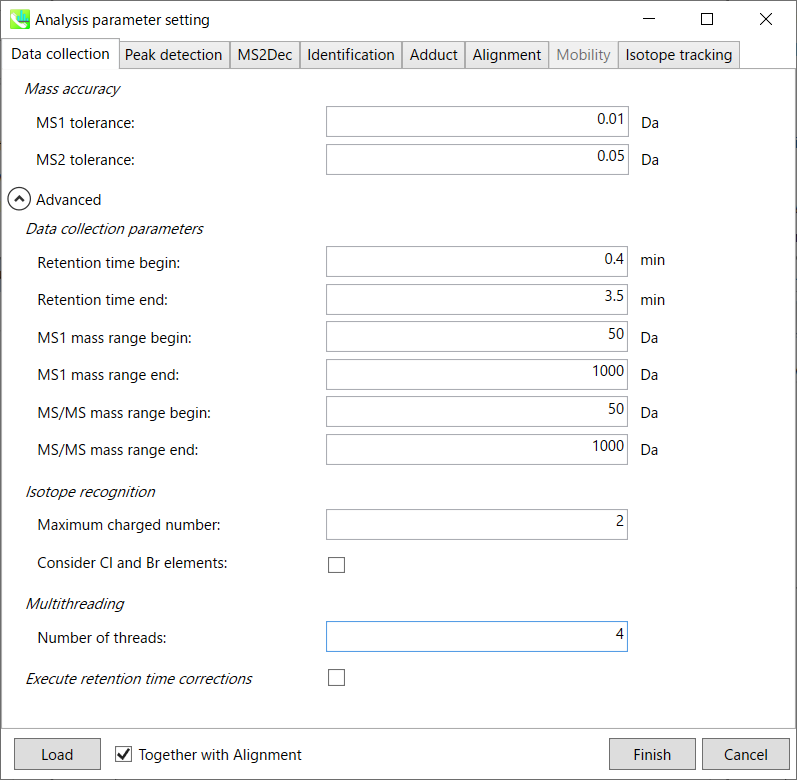
Mass accuracy: 质量精度:
After the peak detection algorithm is applied along the MS axis with a very low threshold, MS-DIAL performs spectral centroiding. By default, mass spectrum of ±0.01 and ±0.05 Da range from each peak top is integrated in MS1 and MS2, respectively. Importantly, this MS2 tolerance value is also used to build the MS/MS chromatogram for a certain m/z trace. The MS/MS chromatograms are dedicated to the MS2Dec deconvolution program.
在以非常低的阈值沿MS轴应用峰值检测算法后,MS-DIAL执行光谱质心。默认情况下,MS1 和 MS2 分别积分每个峰顶的 ±0.01 和 ±0.05 Da 范围的质谱图。重要的是,该MS2容差值还用于构建特定m/z迹线的MS/MS色谱图。MS/MS色谱图专用于MS2Dec反卷积程序。
Data collection parameters:
数据采集参数:
You can set analysis ranges (RT, MS1 and MS/MS axis). In this demonstration, your expected data range is 0.4-3.5 min for 50-1000 Da.
您可以设置分析范围(RT、MS1 和 MS/MS 轴)。在本演示中,对于 50-1000 Da,您的预期数据范围为 0.4-3.5 分钟。
Isotope recognition: 同位素识别:
As long as you focus on small molecule researches (less than 2000 Da), the maximum charged number can be set to 2. On the other hand, the parameter can be changed to 8 or more to process proteome or snRNA research data.
只要专注于小分子研究(小于2000 Da),最大充电数可以设置为2。另一方面,可以将参数更改为 8 或更多以处理蛋白质组或 snRNA 研究数据。
Check Consider Cl and Br elements if you assume that compounds in your samples contain chloride (Cl) or bromide (Br) as the formula element showing the unique isotopic patterns.
如果您假设样品中的化合物含有氯化物 (Cl) 或溴化物 (Br) 作为显示独特同位素模式的公式元素,请选中考虑 Cl 和 Br 元素。
Multithreading: 多线程:
Please set the count of threads that you want to use. You can check the maximum thread counts in resource monitor. (open task manager->open resource monitor)
请设置要使用的线程数。您可以在资源监视器中检查最大线程计数。(打开任务管理器->打开资源监视器)
Execute retention time corrections:
执行保留时间更正:
For detail, visit ‘The tutorial and parameter files for MS-DIAL ALF dataprocessing and spectral library construction methodology’ in the website of MS-DIAL shown below(URL: http://prime.psc.riken.jp/Metabolomics_Software/MS-DIAL/).
详情请见下图所示的MS-DIAL网站中的“MS-DIAL ALF数据处理和谱库构建方法的教程和参数文件”(URL:http://prime.psc.riken.jp/Metabolomics_Software/MS-DIAL/)。
Section 3-3-2 第 3-3-2 节
Peak detection tab 峰值检测选项卡
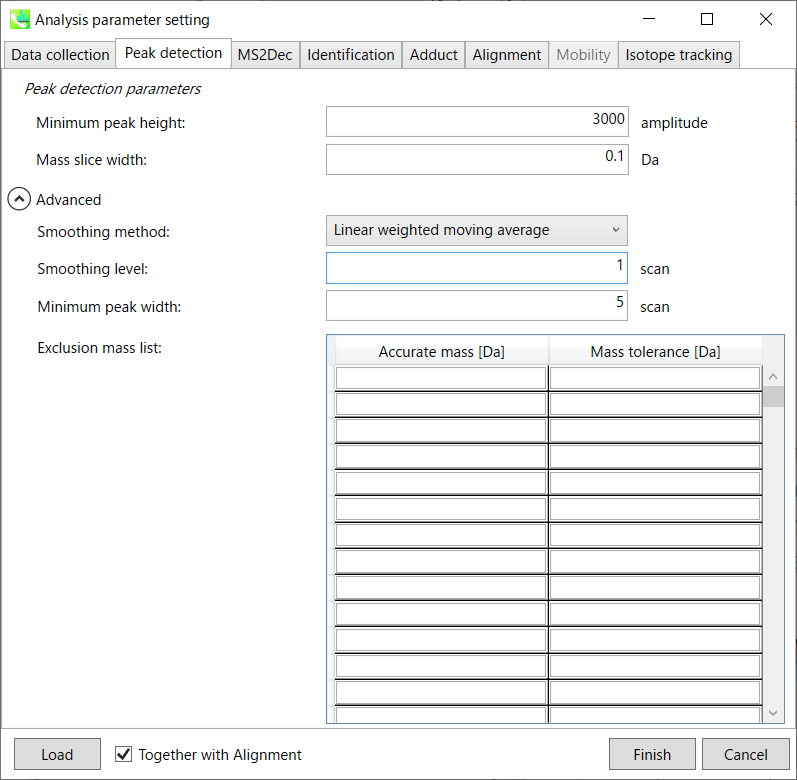 MS-DIAL provides two simple thresholds: minimum values for peak width and height. Peaks below these thresholds are ignored (see also MS-DIAL mathematics: http://prime.psc.riken.jp/Metabolomics_Software/MS-DIAL/MS-DIAL%20FAQ-vs2.pdf).
MS-DIAL提供了两个简单的阈值:峰宽和峰高的最小值。低于这些阈值的峰值将被忽略(另请参阅 MS-DIAL 数学:http://prime.psc.riken.jp/Metabolomics_Software/MS-DIAL/MS-DIAL%20FAQ-vs2.pdf)。
It is ideal that users put values here based on your own experience that you got looking at the trend of your data. However FYI (based on our experience) the minimum peak height may be set to 500 as a default value for this demo data of Sciex.
理想情况下,用户应根据您自己查看数据趋势的经验将值放在这里。但是,仅供参考(根据我们的经验),最小峰高可能设置为 500 作为 Sciex 演示数据的默认值。
Besides, for FT-ICR or Orbirap data, the minimum peak height may be 50,000 or more.
此外,对于FT-ICR或Orbirap数据,最小峰高可能为50,000或更高。
Minimum peak width indicates a threshold of peak width for filtering. See detail by reading the second slide (title ‘In MS-DIAL program’) below.
最小峰宽表示滤波峰宽的阈值。通过阅读下面的第二张幻灯片(标题“在 MS-DIAL 程序中”)查看详细信息。
The width of mass slice is set here. From our experience, 0.1 and 0.05 are suitable for Q-TOF and Orbitrap, respectively.
此处设置了质量切片的宽度。根据我们的经验,0.1 和 0.05 分别适用于 Q-TOF 和 Orbitrap。
Smoothing method: 平滑方法:
Linear-weighted moving average is used for the peak detection as default to accurately determine the peak left- and right edges.
线性加权移动平均线默认用于峰值检测,以准确确定峰值左边缘和右边缘。
The recommended smoothing level is 1-3.
建议的平滑级别为 1-3。
If you already know unwanted m/z peaks because of columns or solvent contaminants, you can specify them in the Exclusion mass list.
如果您已经知道由于色谱柱或溶剂污染物而产生的不需要的m/z峰,则可以在排除质量列表中指定它们。
* see Section 2-3-2 and http://prime.psc.riken.jp/Metabolomics_Software/MS-DIAL/MS-DIAL%20FAQ-vs2.pdf for more detail
* 有关详细信息,请参阅第 2-3-2 节和第 http://prime.psc.riken.jp/Metabolomics_Software/MS-DIAL/MS-DIAL%20FAQ-vs2.pdf 节
Section 3-3-3 第 3-3-3 节
MS2Dec tab MS2Dec 选项卡
Unless you have data independent MS/MS data sets, you can skip this part. However, as shown below, you may set a cutoff value to reduce the MS noises. Note that what is shown below is not the same as data sets described earlier, but we found that this parameter was very important to reduce the computational time and the underestimation of spectral similarities especially in Waters or Agilent instruments.
除非您有与数据无关的 MS/MS 数据集,否则可以跳过此部分。但是,如下图所示,您可以设置一个截止值来降低 MS 噪声。请注意,下面显示的内容与前面描述的数据集不同,但我们发现该参数对于减少计算时间和低估光谱相似性非常重要,尤其是在沃特世或安捷伦仪器中。
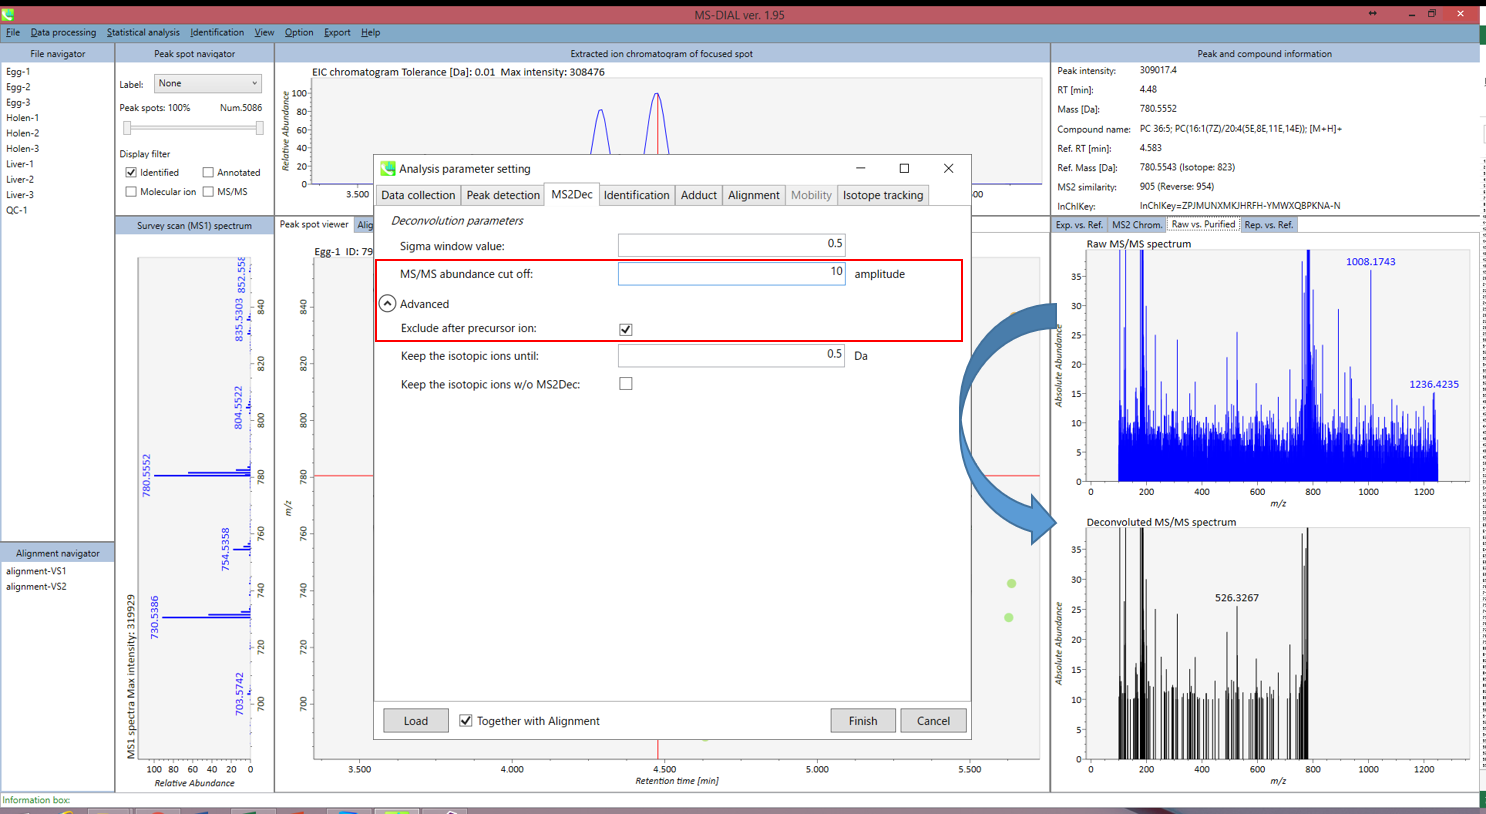 Figure: Explanation about purification parameters
图:纯化参数说明
Section 3-3-4 第 3-3-4 节
Identification tab “标识”选项卡
MSP file: MSP 文件:
Set your MSP file here. (Tutorial data: MSMS-AllPublic-Curated-Pos.msp.) In the case that you selected ‘lipidomics’ project, please select what you want to find in your data sets for lipid profiling (see Section 2-3-4).
在此处设置您的 MSP 文件。(教程数据:MSMS-AllPublic-Curated-Pos.msp。如果您选择了“脂质组学”项目,请选择您想在数据集中找到的内容以进行脂质分析(参见第 2-3-4 节)。
Parameters: 参数:
For this demo data, retention time is not used for scoring or filtering so you just do NOT tick Use retention time for scoring and Use retention time for filtering.
对于此演示数据,保留时间不用于评分或筛选,因此只需不勾选“使用保留时间进行评分”和“使用保留时间进行筛选”即可。
If you put retention time (RT) information in your MSP file, set the RT tolerance value.
如果将保留时间 (RT) 信息放在 MSP 文件中,请设置 RT 容差值。
Text file and post identification (retention time and accurate mass based) setting:
文本文件和柱子识别(保留时间和基于质量的准确)设置:
If you want to perform “post identification” processing, set your text file here. (There is no text DB for this demonstration.)
如果要执行“后识别”处理,请在此处设置文本文件。(此演示没有文本数据库。
Relative abundance cut off:
相对丰度截止:
the mass spectrum peak less than the user-defined value will not be used for the MS/MS similarity calculation.
小于用户定义值的质谱图峰将不用于MS/MS相似性计算。
Only report the top hit:
仅报告最热门的点击:
Since some chromatogram peaks will be annotated as the same compound from the identification algorithm, this option allows us to determine only one candidate from such multiple results by means of the identification score.
由于某些色谱峰将在鉴定算法中被注释为同一化合物,因此此选项允许我们通过鉴定分数从此类多个结果中仅确定一个候选化合物。
Section 3-3-5 第 3-3-5 节
Adduct tab 加合物选项卡
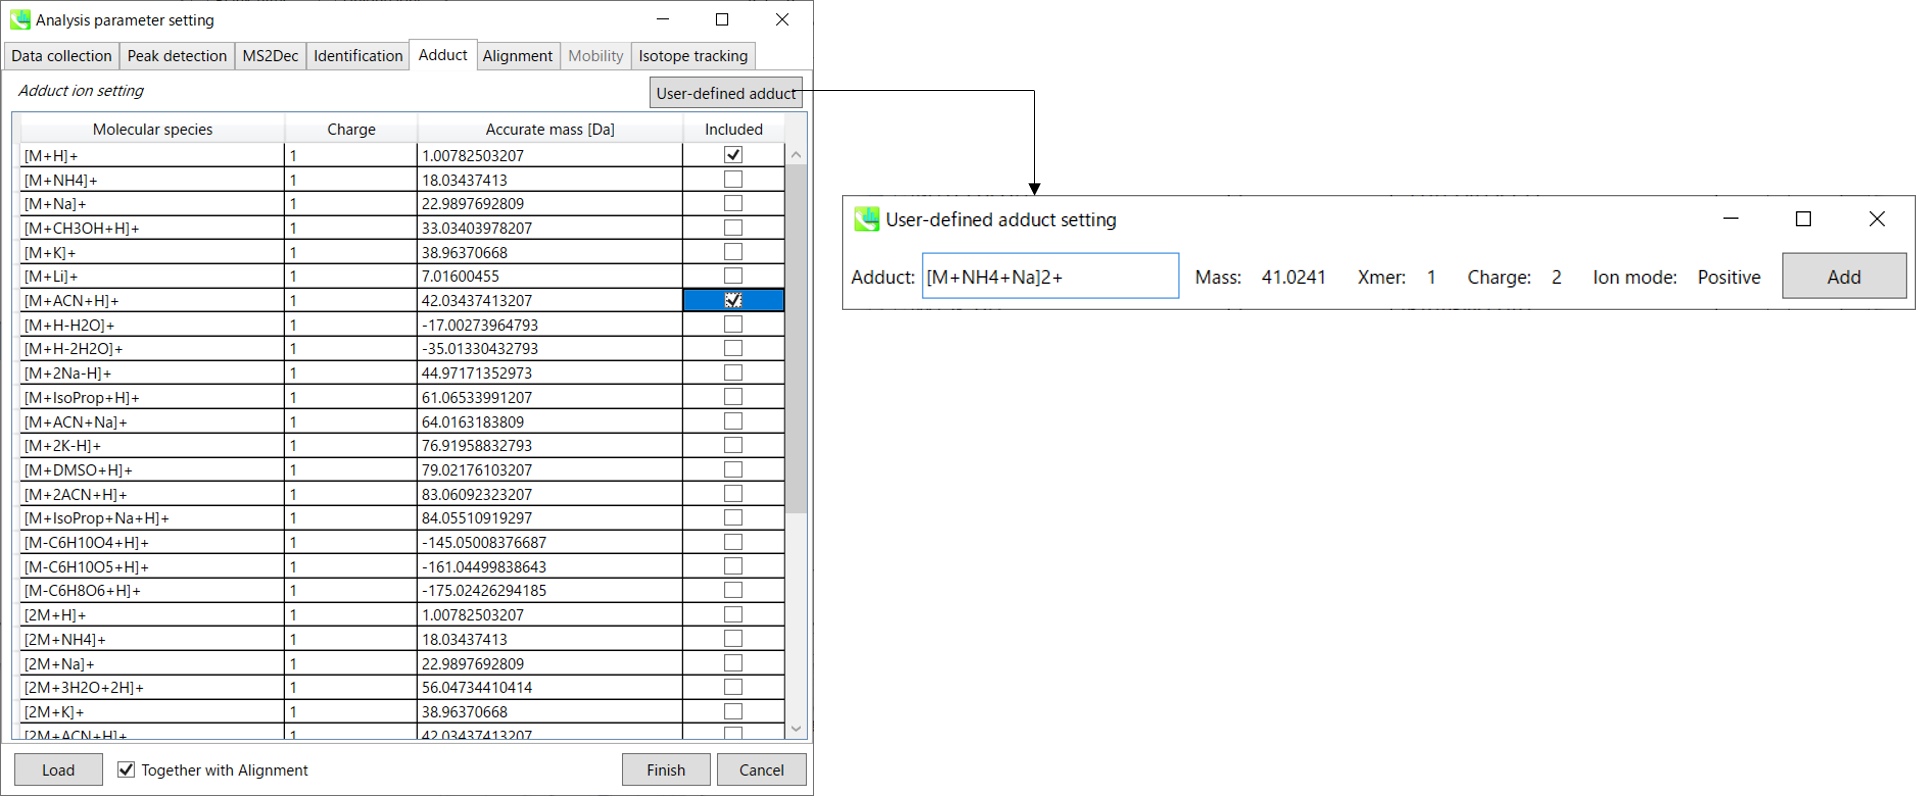
You can tick the adduct ions and charge values to be considered.
您可以勾选要考虑的加合离子和电荷值。
In addition, own definition for adduct ions can be set. (see the adduct format in Section 1-6-2 of Chapter 1)
此外,还可以设置加合离子的自定义定义。(参见第 1 章第 1-6-2 节中的加合物格式)
Section 3-3-6 第 3-3-6 节
Alignment tab “对齐方式”选项卡
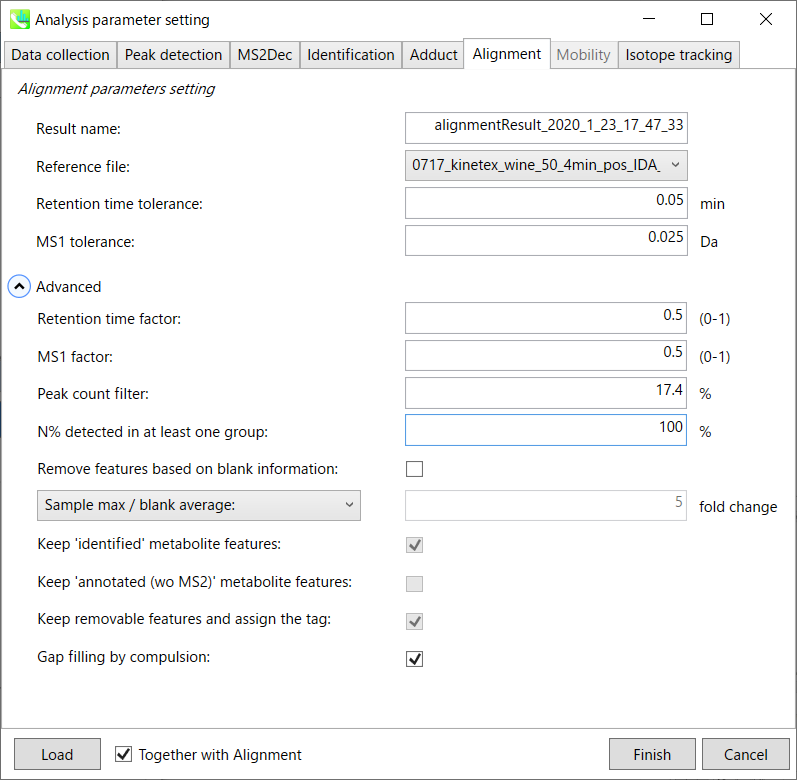
Result name will be the name of each alignment shown at the pane ‘Alignement navigator’ in the main window.
结果名称将是主窗口中“路线导航器”窗格中显示的每个路线的名称。
The RT and MS1 tolerances for peak alignment depend on your chromatographic conditions (see MS-DIAL mathematics for details).
峰比对的RT和MS1允差取决于您的色谱条件(有关详细信息,请参见MS-DIAL数学)。
If you want to remove specific peaks that are not fully detected in the alignment, specify the peak count filter. For example, the tutorial data include at least 4 biological replicates with the same peak information and the total number of data is 23. Then, you may set the peak count filter as (4/23)∗100 = 17.4 %. This means peaks will be removed when they include missing values for more than 17.4%.
如果要删除在对齐中未完全检测到的特定峰,请指定峰计数过滤器。例如,教程数据包括至少 4 个具有相同峰信息的生物学重复,数据总数为 23。然后,您可以将峰值计数滤波器设置为 (4/23)∗100 = 17.4 %。这意味着当峰值包含超过 17.4% 的缺失值时,将删除峰值。
Moreover, in ‘N% detected in at least one group’, the filtering is done within each sample group. If it is set to 100%, the peaks should be detected in all of samples of a class.
此外,在“至少一组中检测到 N%”中,过滤在每个样本组内完成。如果设置为 100%,则应在一类的所有样本中检测到峰。
Retention time factor and MS1 factor: These values indicate the importance of either RT or MS1 to compare and evaluate the similarity of the spectra among samples based on RT and MS1 tolerance.
保留时间因子和MS1因子:这些值表明RT或MS1对于基于RT和MS1耐受性比较和评估样品之间谱图相似性的重要性。
Remove features based on blank information:
根据空白信息移除要素:
If you add information of blank samples and want to reflect the blank features information into the result of the analysis, tick this to evaluate the peaks of blank samples.
如果添加空白样本信息并希望将空白特征信息反映到分析结果中,请勾选此项以评估空白样本的峰值。
Checking this box allows you to edit the three checkboxes, Keep ‘Reference matched’ metabolite features, Keep ‘Suggested (without MS2)’ metabolite features, and Keep removable features and assign the tag.
选中此框后,您可以编辑三个复选框:保持'参考匹配'代谢物特征、保留'建议(无 MS2)'代谢物特征和保留可移动特征并分配标签。
After checking Remove features based on blank information, you will be able to edit the checkbox ‘blank filter’ on the pane ‘Peak spot navigator’ in the main window so that you can check which features were filtered as removable features unless you uncheck Keep removable features and assign the tag.
选中基于空白信息移除要素后,您将能够编辑主窗口中“峰点导航器”窗格中的“空白过滤器”复选框,以便您可以检查哪些要素被过滤为可移动要素,除非您取消选中保留可移动要素并分配标签。
Note: Check this only when you have any blank sample, otherwise error will occur.
注意:仅当您有任何空白样品时才检查此项,否则会发生错误。
Keep ‘Reference matched’ metabolite features:
保持“参考匹配”代谢物特征:
‘Reference matched’ metabolite means the metabolites by reference libraries (MSP or Text library).
“参考匹配”代谢物是指通过参考文库(MSP或文本文库)获得的代谢物。
Keep ‘Suggested (without MS2)’ metabolite features:
保留“建议(不含 MS2)”代谢物特征:
‘Suggested (without MS2)’ means that metabolites are annotated by the MS1 feature. Keep removable features and assign the tag:
“建议(不含 MS2)”表示代谢物由 MS1 特征注释。保留可移动功能并分配标记:
If you check this, even though the features do not exceed the blank feature threshold, the peaks will remain in all result features. But you can confirm the result by using “Blank filter” checkbox of MS-DIAL main window. If you uncheck this, removable features will be deleted and thus that blank features will not be included anymore in all analyzed data, meaning you cannot see the blank-oriented peak features in the main window after alignment.
如果选中此选项,即使要素未超过空白要素阈值,峰值仍将保留在所有结果要素中。但是您可以使用MS-DIAL主窗口的“空白过滤器”复选框来确认结果。如果取消选中此选项,则可移除要素将被删除,因此空白要素将不再包含在所有分析数据中,这意味着对齐后无法在主窗口中看到空白方向的峰值要素。
Gap filling by compulsion: If you check this, the peak recognition is performed by the average peak width of samples having the metabolite feature even though no local maximum is observed in the chromatogram. This is validated by default.
强制填空:如果选中此项,则峰识别是通过具有代谢物特征的样品的平均峰宽执行的,即使在色谱图中没有观察到局部最大值也是如此。默认情况下,将对此进行验证。
Note: When you execute the compound identification, the representative spectra with identification results are automatically determined from one of imported files which has the highest identification score. In the case that an alignment spot is not identified in any samples, the MS/MS spectrum of one sample which has the highest ion abundance in imported files is assigned as the representative spectrum.
注意:当您执行化合物鉴定时,将自动从鉴定分数最高的导入文件之一中确定具有鉴定结果的代表性谱图。如果在任何样品中未识别到对齐点,则将导入文件中离子丰度最高的一个样品的MS/MS谱图指定为代表性谱图。
Section 3-4 第3-4节
Data curation to reduce false positive identifications
数据管理以减少误报识别
MS-DIAL can automatically identify the metabolite peaks by the similarity calculation of retention time, precursor m/z, isotopic ratios, and MS/MS spectrum with the reference databases. However, unfortunately, there are also false positive identifications in the result of peak identifications. Therefore, as an analytical chemist, the result should be manually checked and sometimes some of identified peaks should be curated and modified.
MS-DIAL可以通过与参考数据库的保留时间、母离子m/z、同位素比值和MS/MS谱图的相似性计算来自动识别代谢物峰。然而,不幸的是,在峰鉴定结果中也存在假阳性鉴定。因此,作为分析化学家,应手动检查结果,有时应整理和修改一些已鉴定的峰。
Practically, what you have to do is to curate the identification result of an alignment file since the identification result of its alignment file will be reflected in the final output like ‘peak height’ data matrix. Using the GUI of MS-DIAL, you can check if an aligned spot is false positive/negative identification or not. For further information about GUI of MS-DIAL, see Chapter 5.
实际上,您所要做的是整理对齐文件的识别结果,因为其对齐文件的识别结果将反映在最终输出中,例如“峰高”数据矩阵。使用 MS-DIAL 的 GUI,您可以检查对齐的点是否为假阳性/假阴性识别。有关 MS-DIAL 的 GUI 的更多信息,请参阅第 5 章。
Chapter 4 第 4 章
Gas chromatography coupled with mass spectrometry is a robust and stable technique for metabolic profiling. Practically, it should be the first choice for untargeted metabolome analyses in terms of easier operation and maintenance over LC/MS. Moreover, the compound identification of GC/MS is currently straightforward owing to huge amount of retention time (and retention index) and EI spectrum databases.
气相色谱法与质谱法相结合是一种稳健而稳定的代谢分析技术。实际上,它应该是非靶向代谢组分析的首选,因为与LC/MS相比,它更容易操作和维护。此外,由于大量的保留时间(和保留指数)和EI谱图数据库,GC/MS的化合物鉴定目前非常简单。
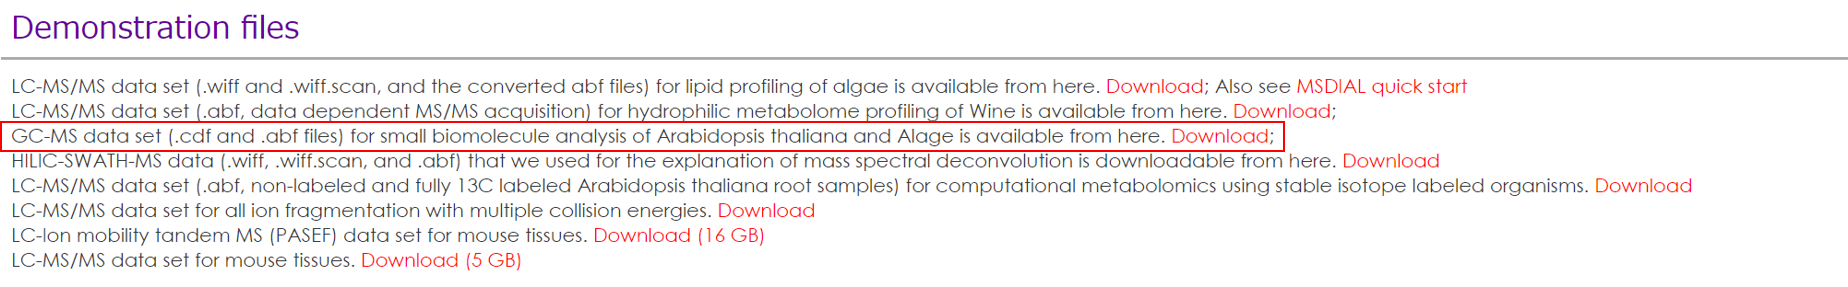
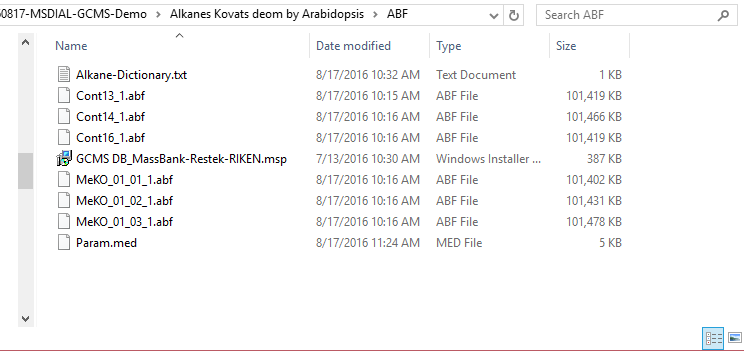
Here, a project using GC/MS data sets of Arabidopsis knock out mutants (a part of this study) is demonstrated. The detail is shown in http://prime.psc.riken.jp/meko/. The alkane mixture based retention index (Kovats) is used. The other methods using FAME mixture based retention index (Fiehn) or retention times are also explained. The files used for this demonstration can be downloaded from http://prime.psc.riken.jp/Metabolomics_Software/MS-DIAL/.
在这里,展示了一个使用拟南芥敲除突变体的GC / MS数据集的项目(本研究的一部分)。详细信息显示在 http://prime.psc.riken.jp/meko/ 中。使用基于烷烃混合物的保留指数(Kovats)。还介绍了使用基于FAME混合物的保留指数(Fiehn)或保留时间的其他方法。用于此演示的文件可以从 http://prime.psc.riken.jp/Metabolomics_Software/MS-DIAL/ 下载。
Section 4-1 第4-1节
Starting up your project
启动项目
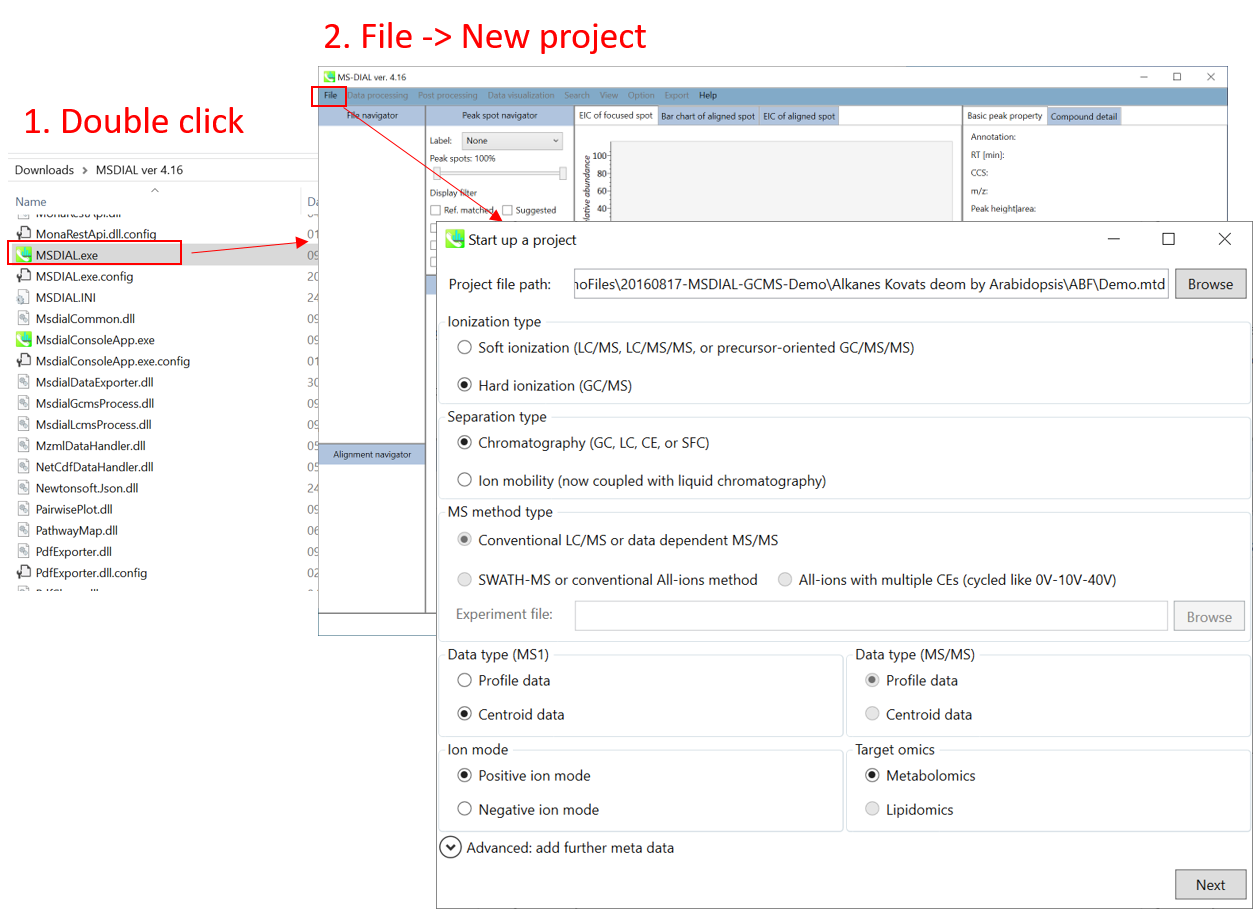
File -> new project
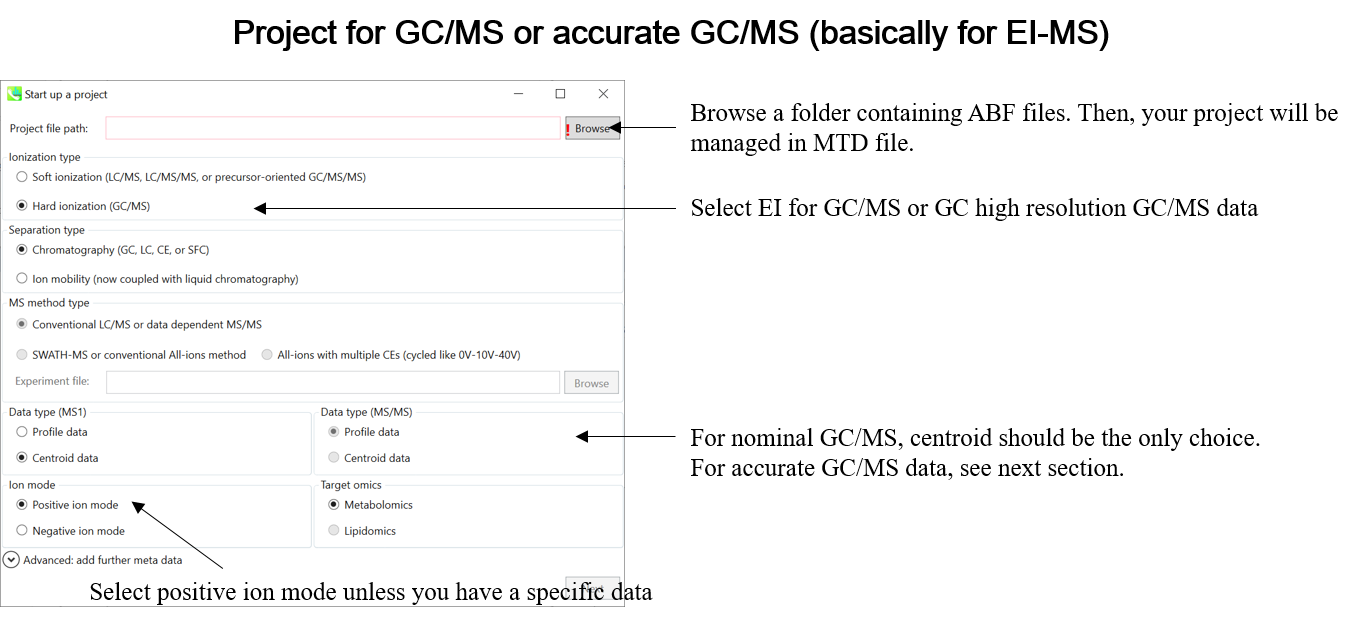
文件 -> 新项目
Set your project file path to the directory of your ABF files
将项目文件路径设置为 ABF 文件的目录
Select your ionization type as EI (GC/MS)
选择电离类型为 EI (GC/MS)
Choose data type centroid data
选择数据类型质心数据
Choose positive ion mode
选择正离子模式
* see section 4 of chapter 1 as well for the explanation of ‘Data type’.
* 有关“数据类型”的解释,请参阅第 1 章第 4 节。
FAQ: 常见问题:
MS-DIAL can also process your LC/MS data like GC/MS.
MS-DIAL还可以处理您的LC/MS数据,如GC/MS。
If you have accurate GC/MS data, a parameter to set its accuracy is given in the parameter setting section.
如果您有准确的GC/MS数据,则在参数设置部分给出了设置其准确性的参数。
If your data is a kind of precursor oriented GC/MS/MS technique such as GC-CI- (chemical ionization), GC-FI- (field ionization), GC-PI- (photonic ionization), and GC-APCI-MS, it should be dedicated to ‘ESI (LC/MS, LC/MS/MS, or precursor-oriented GC/MS/MS’ part as ionization type. See chapter 3.
如果您的数据是一种面向前驱体的 GC/MS/MS 技术,例如 GC-CI-(化学电离)、GC-FI-(场电离)、GC-PI-(光子电离)和 GC-APCI-MS,则应专用于“ESI(LC/MS、LC/MS/MS 或前驱体取向 GC/MS/MS”部分作为电离类型。请参阅第 3 章。
Section 4-2 第 4-2 节
Importing ABF files 导入 ABF 文件
Select ABF files 选择 ABF 个文件
If the file is a “quality control” sample for peak alignment, then set the type as such. (in this example, you do not have any QC sample.)
如果文件是用于峰对齐的“质量控制”样本,则按此方式设置类型。(在此示例中,您没有任何 QC 样品。
Note: Please finalize your file name here, because you cannot change it later.
注意:请在此处完成您的文件名,因为您以后无法更改它。
Section 4-3 第 4-3 节
Setting parameters 设置参数
Section 4-3-1 第 4-3-1 节
Data collection tab “数据收集”选项卡
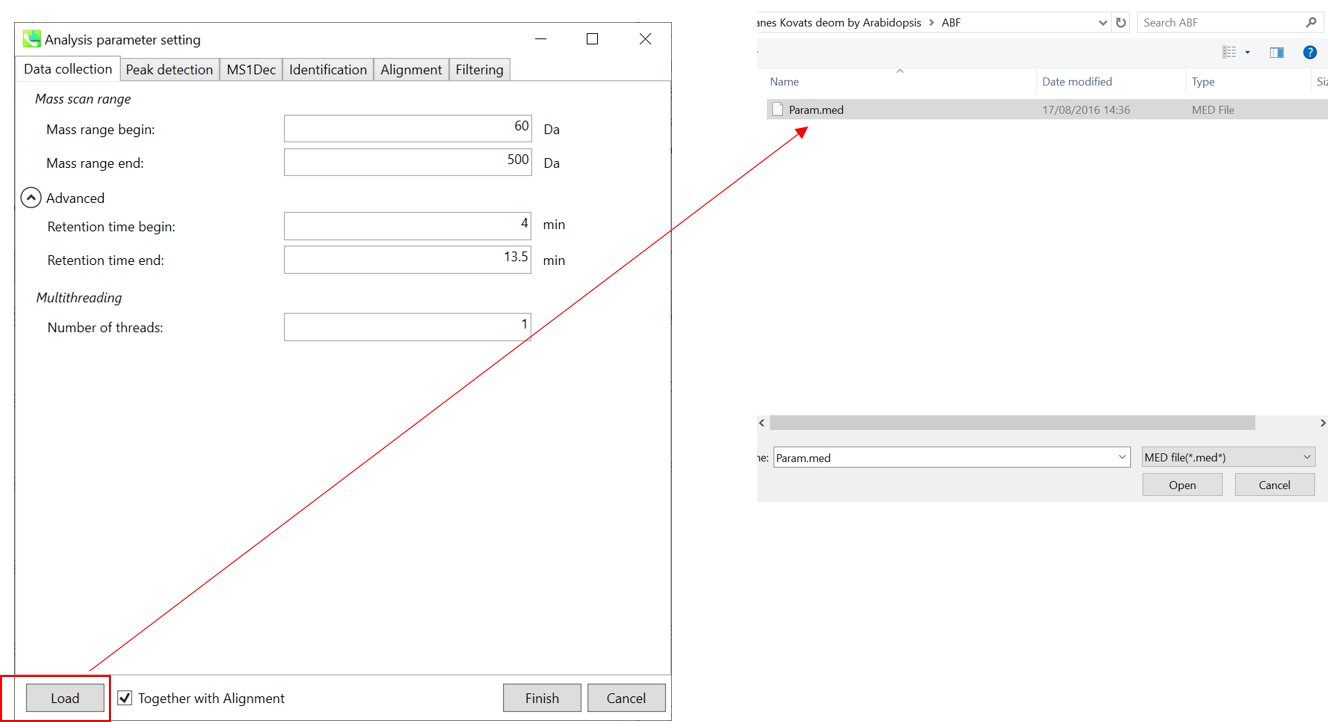
* For the quick start and its explanations, load ‘Param.med’ as shown above.
* 有关快速入门及其说明,请加载“Param.med”,如上所示。
Mass scan range: You can set analysis ranges (RT and MS1 axis). For example, if your expected (meaningful) data range is 4-13.5 min for 60-500 Da (in this example), so set the parameters.
质量扫描范围:可以设置分析范围(RT和MS1轴)。例如,如果 60-500 Da 的预期(有意义的)数据范围为 4-13.5 分钟(在本例中),则设置参数。
Multithreading: Please set the count of threads that you want to use. You can check the maximum thread counts in resource monitor. (open task manager->open resource monitor)
多线程:请设置要使用的线程数。您可以在资源监视器中检查最大线程计数。(打开任务管理器->打开资源监视器)
Section 4-3-2 第 4-3-2 节
Peak detection tab 峰值检测选项卡
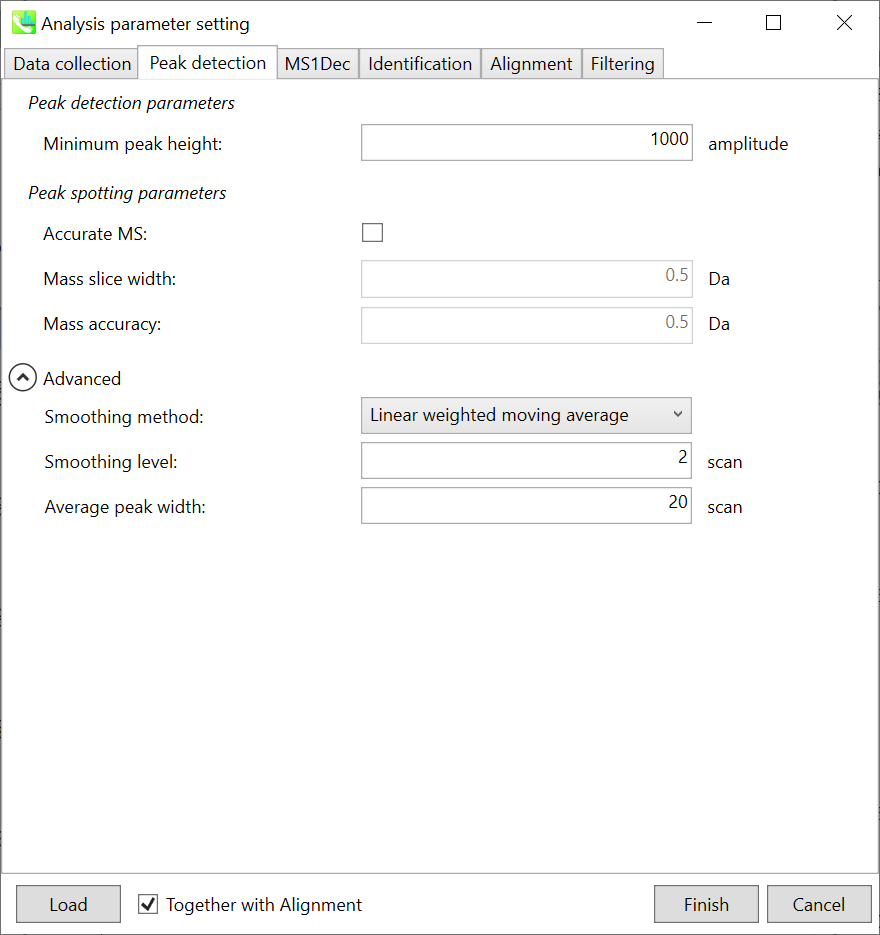
Peak detection parameters: The workflow of GC/MS deconvolution is 1) peak picking in each m/z chromatogram, and 2) deconvolution on the basis of detected peak spots. The algorithm of this peak picking is the same as LC/MS parts except for exclusion mass list which was removed from the parameter list in GC/MS processing.
峰检测参数:GC/MS反卷积的工作流程是1)在每个m/z色谱图中拾取峰,以及2)基于检测到的峰点进行反卷积。该峰拾取的算法与LC/MS部件相同,但排除质量数列表已从GC/MS处理中的参数列表中删除。
Linear-weighted moving average is used for the peak detection by default to accurately determine the peak left- and right edges. The recommended smoothing level is 1-3. MS-DIAL provides two simple thresholds: minimum values for peak width and height. Peaks below these thresholds are ignored (see also MS-DIAL mathematics: http://prime.psc.riken.jp/Metabolomics_Software/MS-DIAL/MS-DIAL%20FAQ-vs2.pdf). For GC-Q-Exactive data, the minimum peak height should be 50,000 or more (at a first trial).
默认情况下,峰值检测使用线性加权移动平均线,以准确确定峰值左边缘和右边缘。建议的平滑级别为 1-3。MS-DIAL提供了两个简单的阈值:峰宽和峰高的最小值。低于这些阈值的峰值将被忽略(另请参阅 MS-DIAL 数学:http://prime.psc.riken.jp/Metabolomics_Software/MS-DIAL/MS-DIAL%20FAQ-vs2.pdf)。对于GC-Q-Exactive数据,最小峰高应为50,000或更高(在第一次试验中)。
Peak spotting parameters: If your data is obtained by high resolution GCMS such as Agilent GC-QTOFMS and GC-QExactive, check ‘accurate MS’. Then, set the width of mass slice. From our experience, 0.1 or 0.05 is suitable for accurate GCMS. In addition, put the mass accuracy which is used for the construction of EI-chromatograms followed by the deconvolution (MS1Dec) program.
峰点样参数:如果您的数据是通过高分辨率GCMS(如Agilent GC-QTOFMS和GC-QExactive)获得的,请检查“准确的MS”。然后,设置质量切片的宽度。根据我们的经验,0.1 或 0.05 适用于准确的 GCMS。此外,将用于构建EI色谱图的质量精度放在反卷积(MS1Dec)程序中。
Section 4-3-3 第 4-3-3 节
MS1Dec tab MS1Dec 选项卡
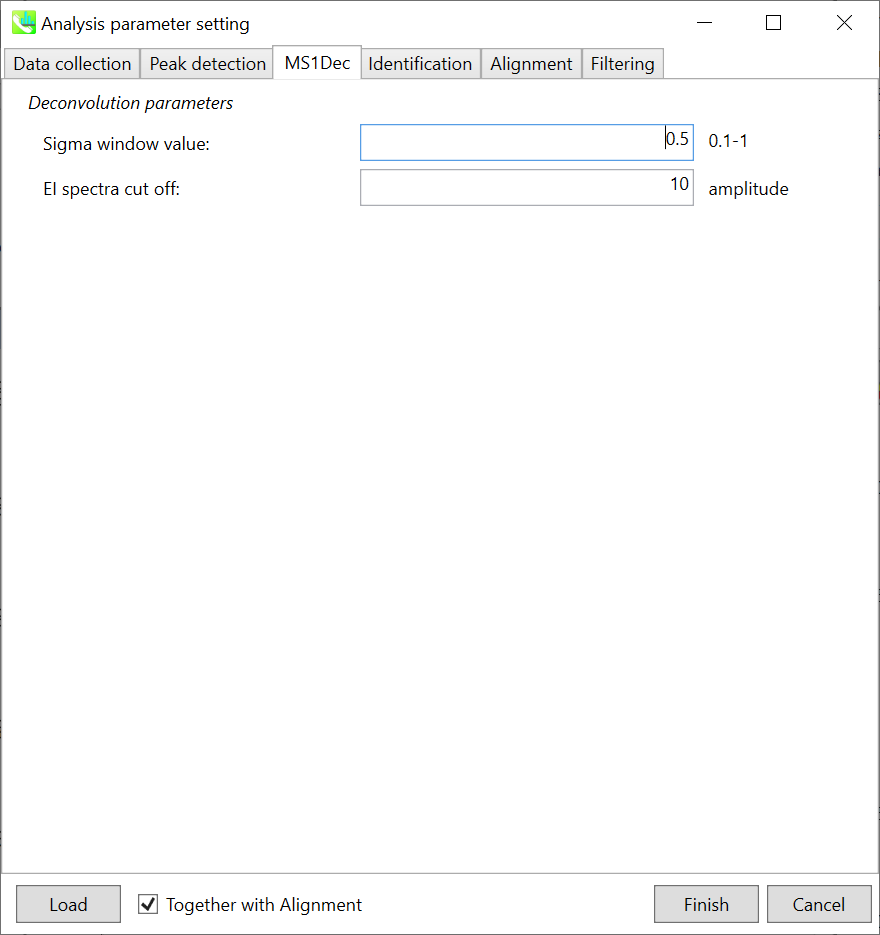
The sigma window value is highly affected by the resolution of deconvolutions. A higher value (0.7-1.0) will reduce the peak top resolutions, i.e. the number of resolved chromatographic peaks will be decreased. On the other hand, a lower value (0.1-0.3) may also recognize many noise chromatographic peaks.
sigma 窗口值受反卷积分辨率的影响很大。较高的值(0.7-1.0)会降低峰的顶部分离度,即分离的色谱峰的数量会减少。另一方面,较低的值(0.1-0.3)也可以识别许多噪声色谱峰。
In addition, you may set a cutoff value to reduce the MS noises (see Section 3-3 of Chapter 3). This is the same as LC/MS part.
此外,您可以设置一个截止值来降低 MS 噪声(参见第 3 章第 3-3 节)。这与LC/MS部分相同。
Section 4-3-4 第 4-3-4 节
Identification tab “标识”选项卡
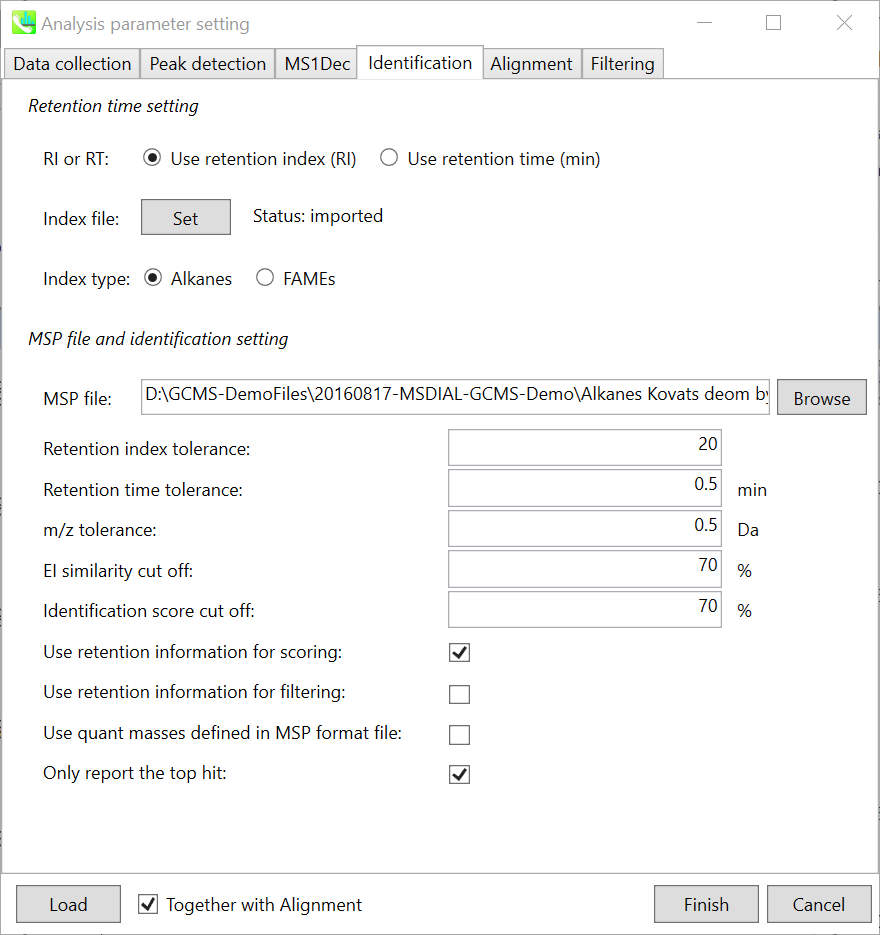
The peak identification of GC/MS based untargeted analysis is straightforward, but you have to carefully check your conditions especially about retention index for the comprehensive identification of metabolites. In fact, MS-DIAL can use ‘retention time’ as the index of retention information, but it is highly recommended to use retention indexes for the routine identifications. * Since there is retention time information as well in our curated MSP DBs, you may be able to choose ‘retention time’ as the index. However, you should use larger retention time tolerance, at the cost of increasing false positives.
基于GC/MS的非靶向分析的峰鉴定非常简单,但您必须仔细检查条件,尤其是保留指数,以便全面鉴定代谢物。事实上,MS-DIAL可以使用“保留时间”作为保留信息的索引,但强烈建议使用保留索引进行常规识别。* 由于我们精选的 MSP 数据库中也有保留时间信息,因此您可以选择“保留时间”作为索引。但是,应使用更大的保留时间容差,但代价是增加误报。
There are two methods to calculate retention indexes: 1) Kovats on the basis of alkane mixture, and 2) Fiehn on the basis on FAME (fatty acid methyl ester) mixture. These mixtures can be bought for example from Sigma-Aldrich (49452-U for C7-C40 saturated alkane mixture) and from Agilent (http://www.agilent.com/cs/library/usermanuals/Public/G1676-90001_Fiehn.pdf). Here, you have to prepare a tab-delimited file which includes the pair-list of carbon number and its retention time.
有两种方法可以计算保留指数:1)基于烷烃混合物的Kovats,以及2)基于FAME(脂肪酸甲酯)混合物的Fiehn。例如,可以从Sigma-Aldrich(C7-C40饱和烷烃混合物为49452-U)和安捷伦(http://www.agilent.com/cs/library/usermanuals/Public/G1676-90001_Fiehn.pdf)购买这些混合物。在这里,您必须准备一个制表符分隔的文件,其中包括碳数及其保留时间的对列表。
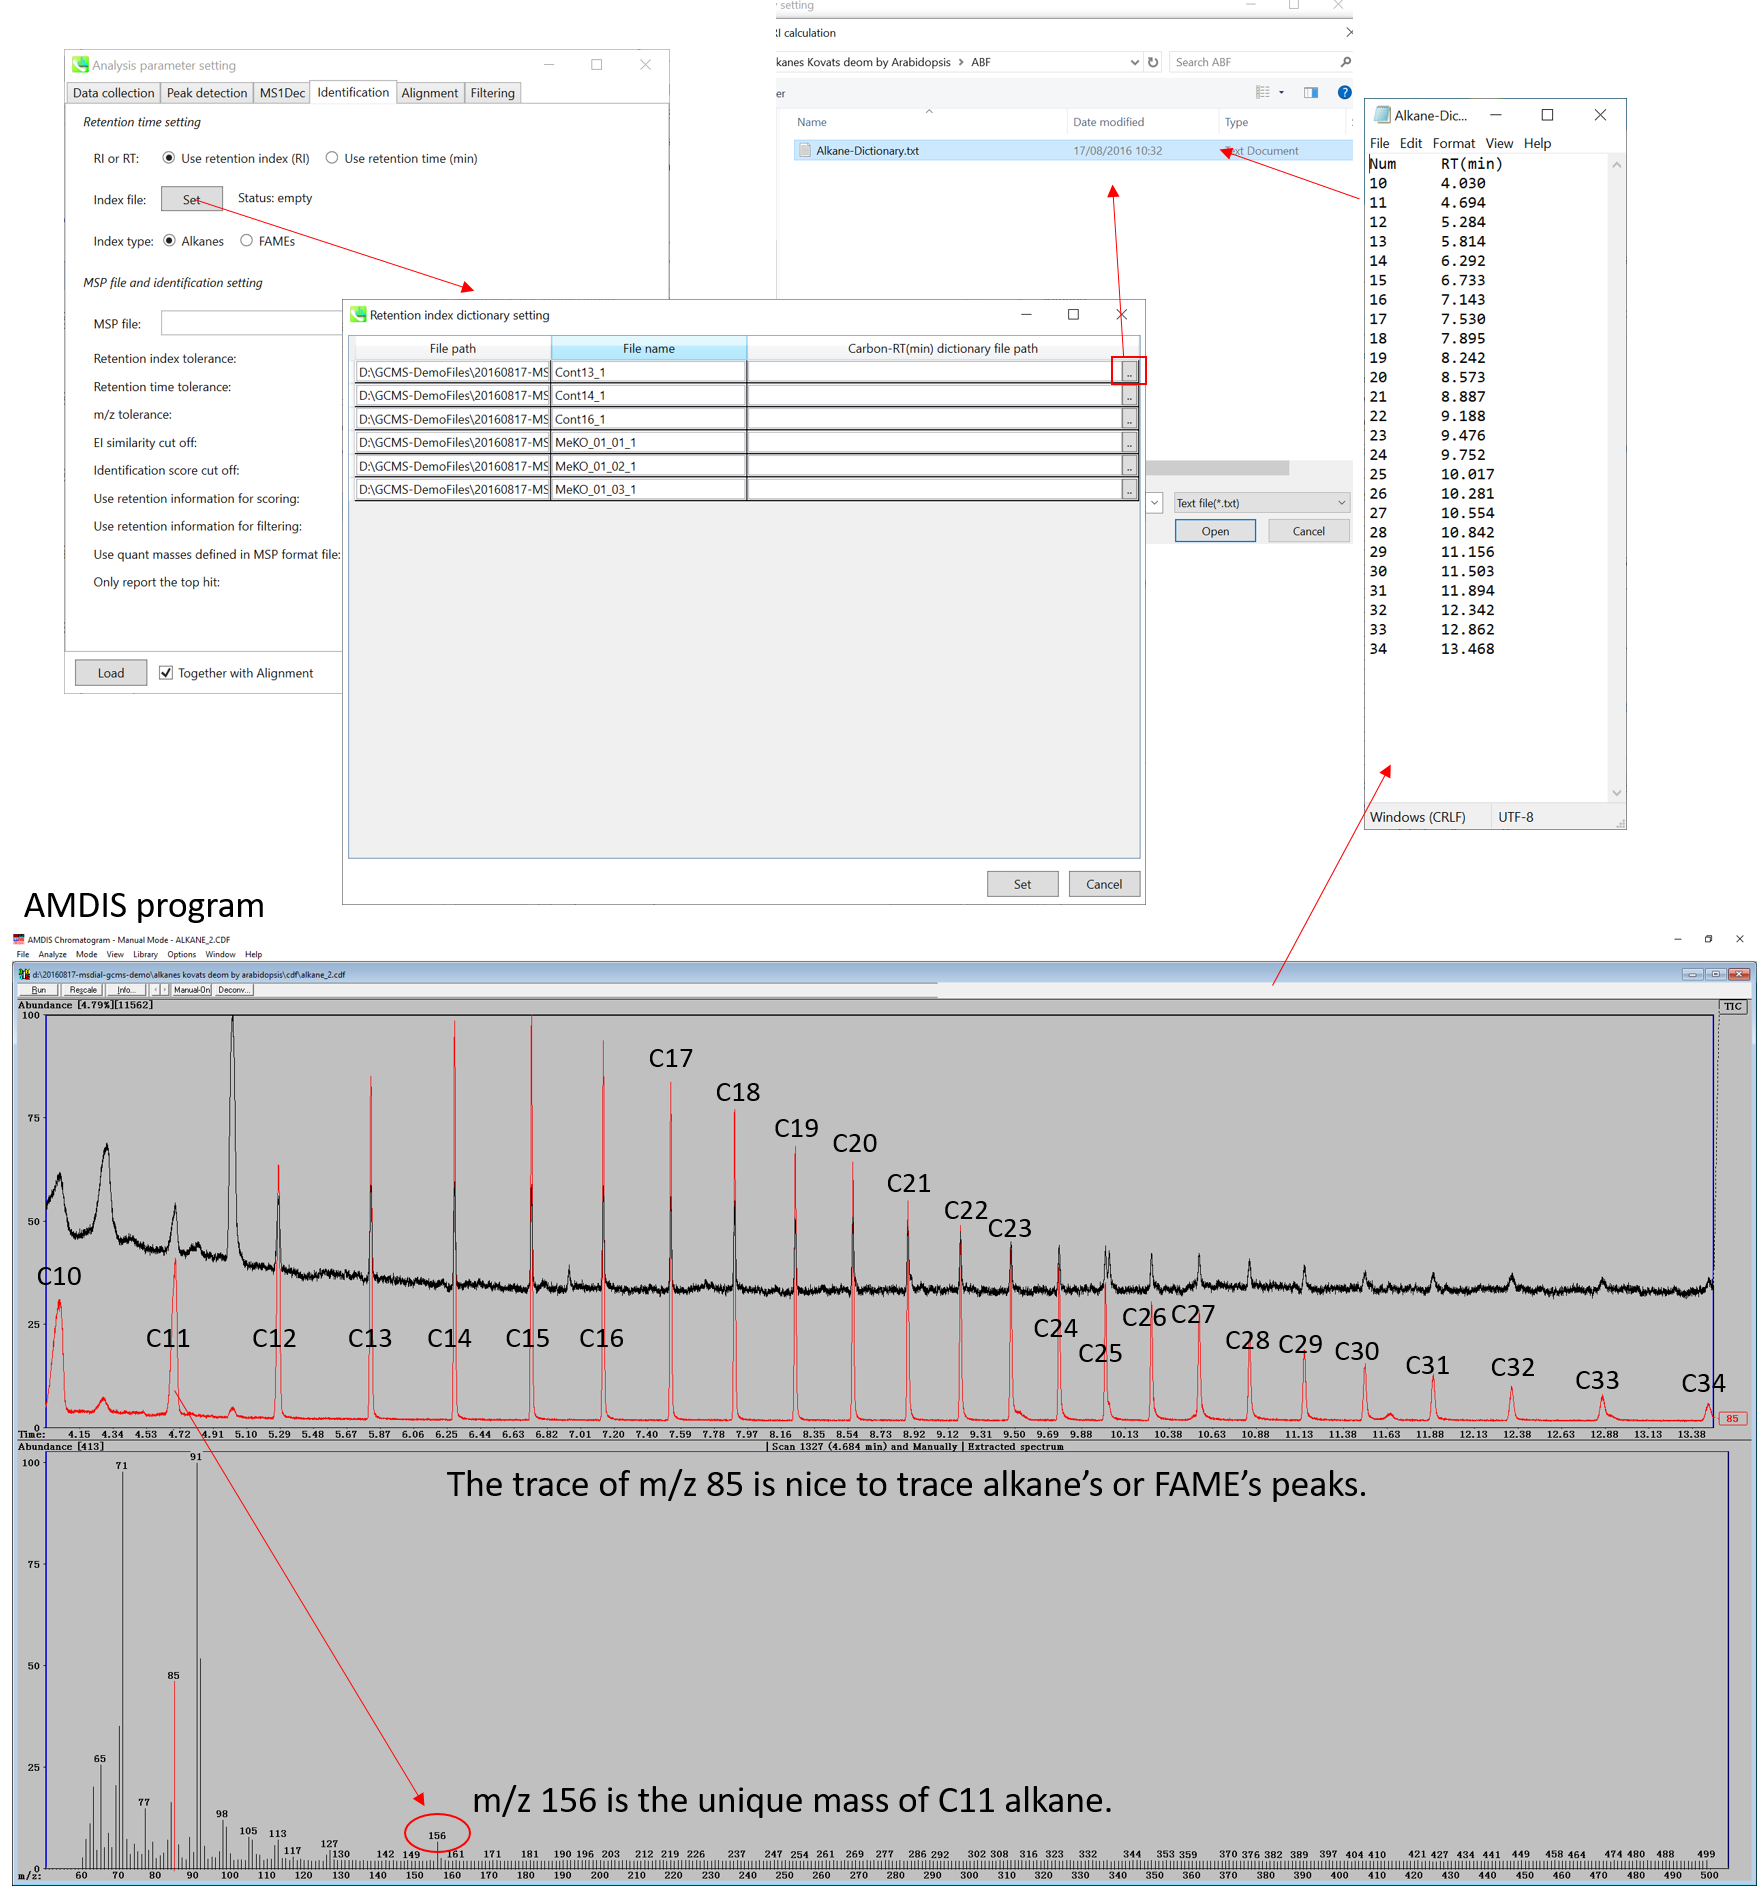
The figure above describes the way to check the retention times of Alkane mixture (using AMDIS), and the same way can be used for FAME mixture. Note that for FAME based Fiehn RI calculation, you MUST prepare all of retention information of C8, C9, C10, C12, C14, C16, C18, C20, C22, C24, C26, C28, and C30 to calculate Fiehn RIs. On the other hand, all of alkanes is not required for the Kovats calculation.
上图描述了检查烷烃混合物保留时间的方法(使用AMDIS),FAME混合物也可以使用相同的方法。请注意,对于基于FAME的Fiehn RI计算,您必须准备C8、C9、C10、C12、C14、C16、C18、C20、C22、C24、C26、C28和C30的所有保留信息来计算Fiehn RI。另一方面,Kovats 计算不需要所有烷烃。
From version 2.42, MS-DIAL supports ‘retention index’ based peak alignment. Some metabolomics studies can be acquired over months / years. Cutting 10-15 cm of the GC column during instrument maintenance makes retention times shorter but this does not influence retention index. In some cases, there are many isomers (e.g., analysis of volatiles), thus, use of wide retention time tolerance (e.g., 0.5-1 min) could lead to wrong peak alignment. In order to deal with this requirement, users have to define the ‘pair’ of analysis file path and carbon-RT dictionary file in the parameter setting. Use ‘auto fill’ of context menu to apply a dictionary file into all of the other analysis files.
从2.42版本开始,MS-DIAL支持基于“保留指数”的峰对齐。一些代谢组学研究可以在数月/数年内获得。在仪器维护期间切割 10-15 cm 的 GC 色谱柱可缩短保留时间,但这不会影响保留指数。在某些情况下,存在许多异构体(例如,挥发物分析),因此,使用较宽的保留时间公差(例如,0.5-1 min)可能导致错误的峰对齐。为了满足这一要求,用户必须在参数设置中定义分析文件路径和carbon-RT字典文件的“对”。使用上下文菜单的“自动填充”将字典文件应用于所有其他分析文件。
* AMDIS (http://chemdata.nist.gov/mass-spc/amdis/downloads/) is a nice and very robust program for GC/MS analysis. It can also be used to check the retention times of both alkanes and FAMEs since you can directly see your raw data without any processing. In contrast, MS-DIAL has to be executed first to check raw data sets.
* AMDIS ( http://chemdata.nist.gov/mass-spc/amdis/downloads/) 是一个用于 GC/MS 分析的非常强大且非常强大的程序。它还可用于检查烷烃和FAME的保留时间,因为您可以直接查看原始数据,而无需进行任何处理。相比之下,必须首先执行 MS-DIAL 才能检查原始数据集。
MSP file: Set your MSP file here. (Tutorial data: GCMS DB_MassBank-Restek-RIKEN.msp.) Importantly, as long as you use FAME mixture, you do not have to prepare your own MSP since MS-DIAL internally has the Fiehn BinBase spectra records. Of course, you can choose your own MSP file for FAME based GC/MS metabolome analysis.
MSP 文件:在此处设置您的 MSP 文件。(教程数据:GCMS DB_MassBank-Restek-RIKEN.msp。重要的是,只要您使用FAME混合物,您就不必准备自己的MSP,因为MS-DIAL内部有Fiehn BinBase光谱记录。当然,您可以选择自己的MSP文件进行基于FAME的GC/MS代谢组分析。
Parameters: If you put retention time (RT) information in your MSP file, set the RT tolerance value (default is 0.5). In the case that you choose ‘retention index’ as the identification index, set about 10-20 for alkane (Kovats index) and about 2000-3000 for FAME (Fiehn index) for ‘Retention index tolerance’.
参数:如果将保留时间 (RT) 信息放入 MSP 文件中,请设置 RT 容差值(默认值为 0.5)。如果您选择“保留指数”作为识别指数,则将烷烃(Kovats指数)设置为10-20左右,将FAME(Fiehn指数)设置为“保留指数耐受性”约2000-3000。
Even if you use accurate GC/MS data, 0.5 for m/z tolerance is recommended unless you have your own high resolution EI library. The EI similarity cut off is used for the first filtering of compound identifications, and then the cutoff of the identification score which is the total score of retention time similarity and EI spectral similarity will be used for the final ranking of compound identification.
即使您使用准确的 GC/MS 数据,除非您有自己的高分辨率 EI 库,否则建议 m/z 容差为 0.5。EI相似性截止值用于化合物鉴定的首次过滤,然后使用鉴定分数的截止值,即保留时间相似度和EI谱相似度的总分,用于化合物鉴定的最终排名。
Section 4-3-5 第 4-3-5 节
Alignment tab “对齐方式”选项卡
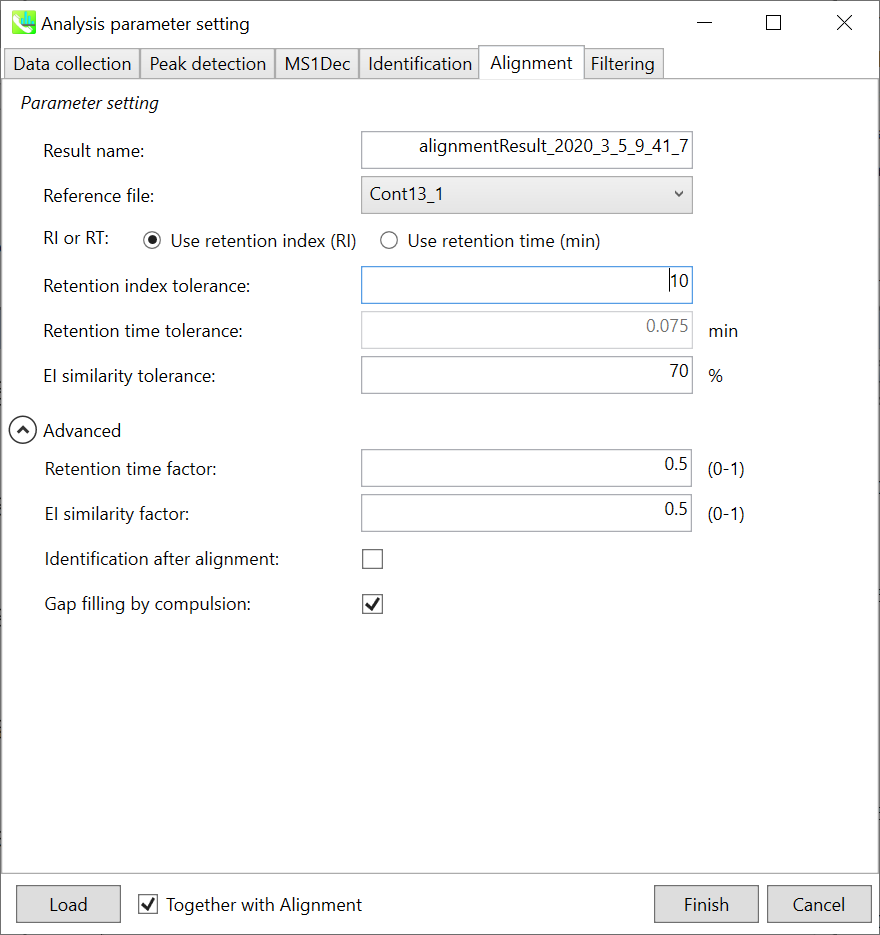
Parameters: If you already have a suitable quality control (QC) data, typically a mixed sample data, then specify the QC file here. All sample data will be aligned to this QC file. When no QC file is available, select one of imported files (blank sample is not suitable). The metabolite peaks of a specific sample which are not monitored in the representative file can be automatically interpolated by the algorithm of MS-DIAL (gap-filling).
参数:如果您已经有合适的质量控制 (QC) 数据,通常是混合样品数据,请在此处指定 QC 文件。所有样品数据都将与此 QC 文件对齐。当没有可用的QC文件时,选择导入的文件之一(空白样品不合适)。代表性文件中未监测的特定样品的代谢物峰可以通过MS-DIAL(间隙填充)算法自动插值。
In this demonstration, Const13_1 is selected as the representative file. The RT and EI similarity tolerances for peak alignment depend on your chromatographic conditions (set 0.075 min and 70% here). Note that you can use retention index as the criteria for peak alignment once the carbon-RT dictionary files are defined correctly in the identification tab (see the identification tab section).
在本演示中,选择Const13_1作为代表文件。峰比对的RT和EI相似性容差取决于您的色谱条件(此处设置0.075 min和70%)。请注意,在鉴定选项卡中正确定义碳-RT字典文件后,可以使用保留指数作为峰比对标准(参见鉴定选项卡部分)。
Note: When you execute the compound identification, the representative spectra with identification results are automatically determined from one of imported files which has the highest identification score. In the case that an alignment spot is not identified in any samples, the EI spectrum of one sample which has the highest ion abundance in imported files is assigned as the representative spectrum.
注意:当您执行化合物鉴定时,将自动从鉴定分数最高的导入文件之一中确定具有鉴定结果的代表性谱图。如果在任何样品中未识别出对齐点,则将导入文件中离子丰度最高的一个样品的EI光谱指定为代表性光谱。
Section 4-3-6 第 4-3-6 节
Filtering tab “筛选”选项卡
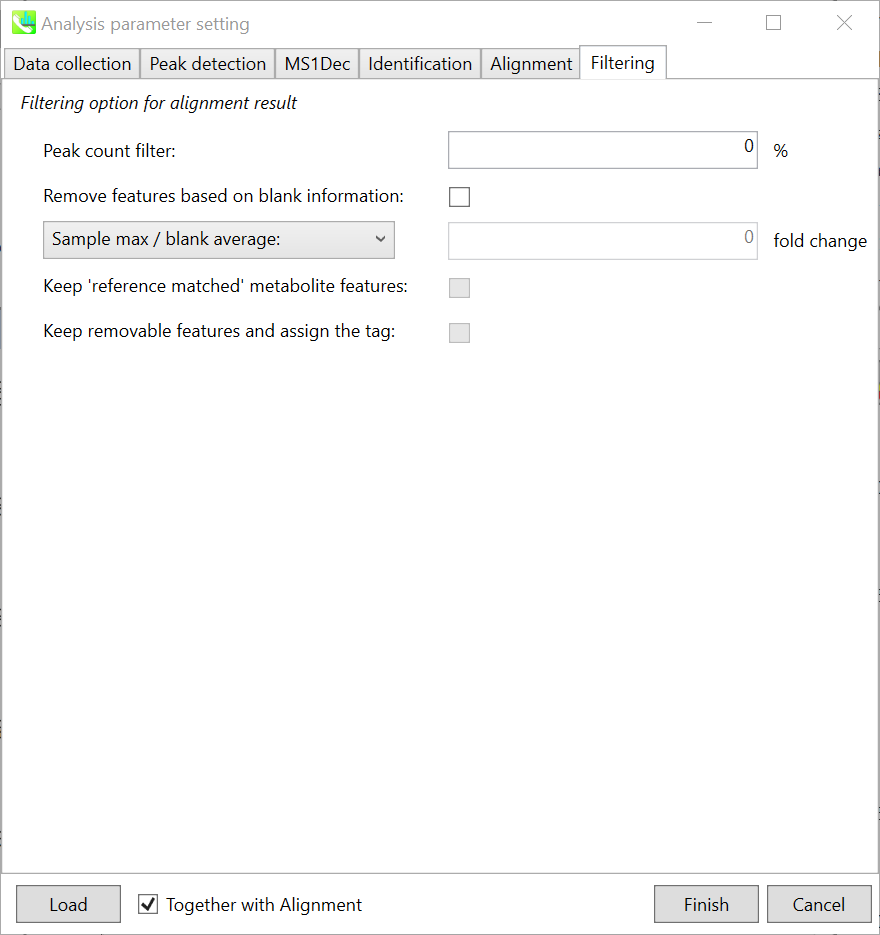
Peak count filter: 峰值计数过滤器:
If you want to remove specific peaks that are not fully detected in the alignment, specify the peak count filter.
如果要删除在对齐中未完全检测到的特定峰,请指定峰计数过滤器。
Remove features based on blank information:
根据空白信息移除要素:
If you add information of blank samples and then reflect them into the result of the analysis, check this to measure the peak of blank samples. Checking this box allows you to edit the two checkboxes, Keep ‘reference matched’ metabolite features and Keep removable features and assign the tag.
如果添加空白样品的信息,然后将其反映到分析结果中,请选中此项以测量空白样品的峰值。选中此框后,您可以编辑两个复选框,即“保持'参考匹配'代谢物特征和保留可移动特征并分配标签。
Keep ‘reference matched’ metabolite features:
保持“参考匹配”代谢物特征:
‘reference matched’ metabolite means the metabolites in accord with any reference under the threshold you set.
“参比匹配”代谢物是指代谢物符合您设定的阈值下的任何参比物。
Keep removable features and assign the tag:
保留可移动功能并分配标记:
If you check this, even the features removed as they did not reached the threshold you set will remain in all result features.
如果选中此选项,则即使因未达到您设置的阈值而移除的要素也将保留在所有结果要素中。
Section 4-4 第 4-4 节
Data curation for the reduction of false positive identifications
减少误报标识的数据管理
MS-DIAL can automatically identify the metabolite peaks by the similarity calculation of retention index (or retention time) and EI spectrum with the reference databases. However, there are also false positive identifications in the result of peak identifications as well as true positives. Therefore, as an analytical chemist, the result should be manually checked and sometimes some of identified peaks should be curated and modified.
MS-DIAL可以通过与参考数据库的保留指数(或保留时间)和EI谱图的相似性计算,自动识别代谢物峰。然而,在峰鉴定结果中也存在假阳性鉴定和真阳性。因此,作为分析化学家,应手动检查结果,有时应整理和修改一些已鉴定的峰。
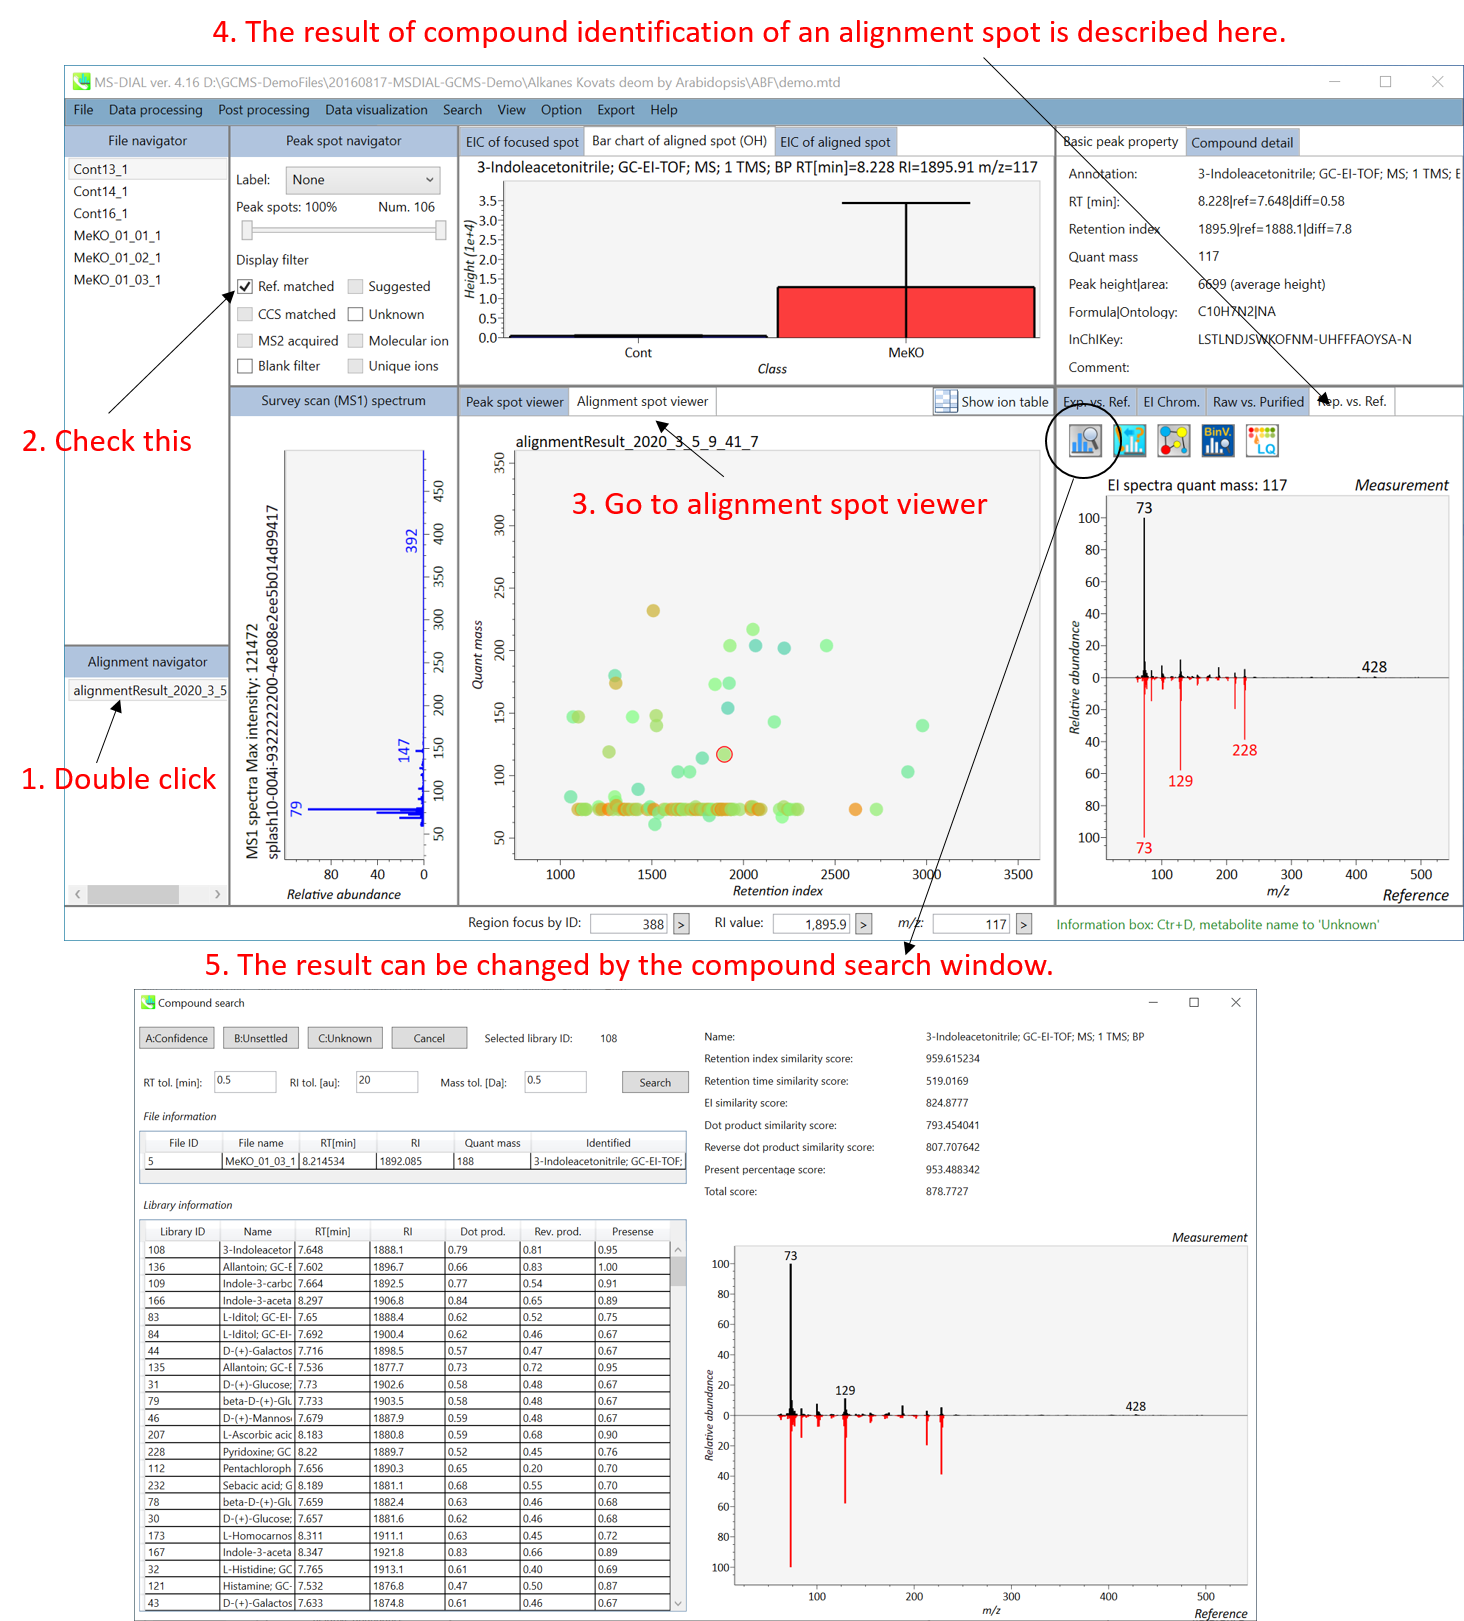
Practically, what you have to do is to curate the identification result of an alignment result file registered in ‘Alignment navigator’ since the identification result of its alignment file will be reflected as the final output. By the GUI of MS-DIAL, you can check if an aligned spot is false positive/negative identification or not. For further information about GUI of MS-DIAL, see Chapter 5.
实际上,您所要做的就是管理在“对齐导航器”中注册的对齐结果文件的识别结果,因为其对齐文件的识别结果将反映为最终输出。通过MS-DIAL的GUI,您可以检查对齐的点是否为假阳性/假阴性识别。有关 MS-DIAL 的 GUI 的更多信息,请参阅第 5 章。
* Note: in contrast to LC/MS (precursor oriented data), each alignment spot does not describe a ‘precursor’ ion of metabolite but instead describe the quant mass (or unique mass, unique m/z) of the deconvoluted peak. The representative quant mass is determined by the voting way from quant masses of all biological samples.
*注意:与LC/MS(母离子导向数据)相比,每个比对斑点不描述代谢物的“母离子”,而是描述去卷积峰的定量质量数(或唯一质量数,唯一m/z)。代表性定量质量数由所有生物样品的定量质量数的投票方式确定。
Chapter 5 第 5 章
Graphical user interface of MS-DIAL
MS-DIAL 的图形用户界面
Section 5-1 第 5-1 节
Mouse function 鼠标功能
Mouse functions described below are available within the area surrounded by pink and green rectangles.
下面描述的鼠标功能在粉红色和绿色矩形包围的区域内可用。
Operation 操作 Action 行动 Hold right button and drag
按住右键并拖动
zoom in and out (only vertical zoom-in/-out within the green area)
放大和缩小(仅在绿色区域内垂直放大/缩小)
Click left button 单击左键 select 选择 Hold left button and drug
按住左键和药物
scroll 滚动 Double click left button
双击左键
reset range and select files in the file navigator
重置范围并在文件导航器中选择文件
Wheel 轮子 zoom in and out
放大和缩小
Click right button 点击右键 popup context menu 弹出上下文菜单
Section 5-2 第 5-2 节
Overview of the MS-DIAL main window in LC/MS (precursor oriented) project
LC/MS(前驱体导向)项目中的MS-DIAL主窗口概述
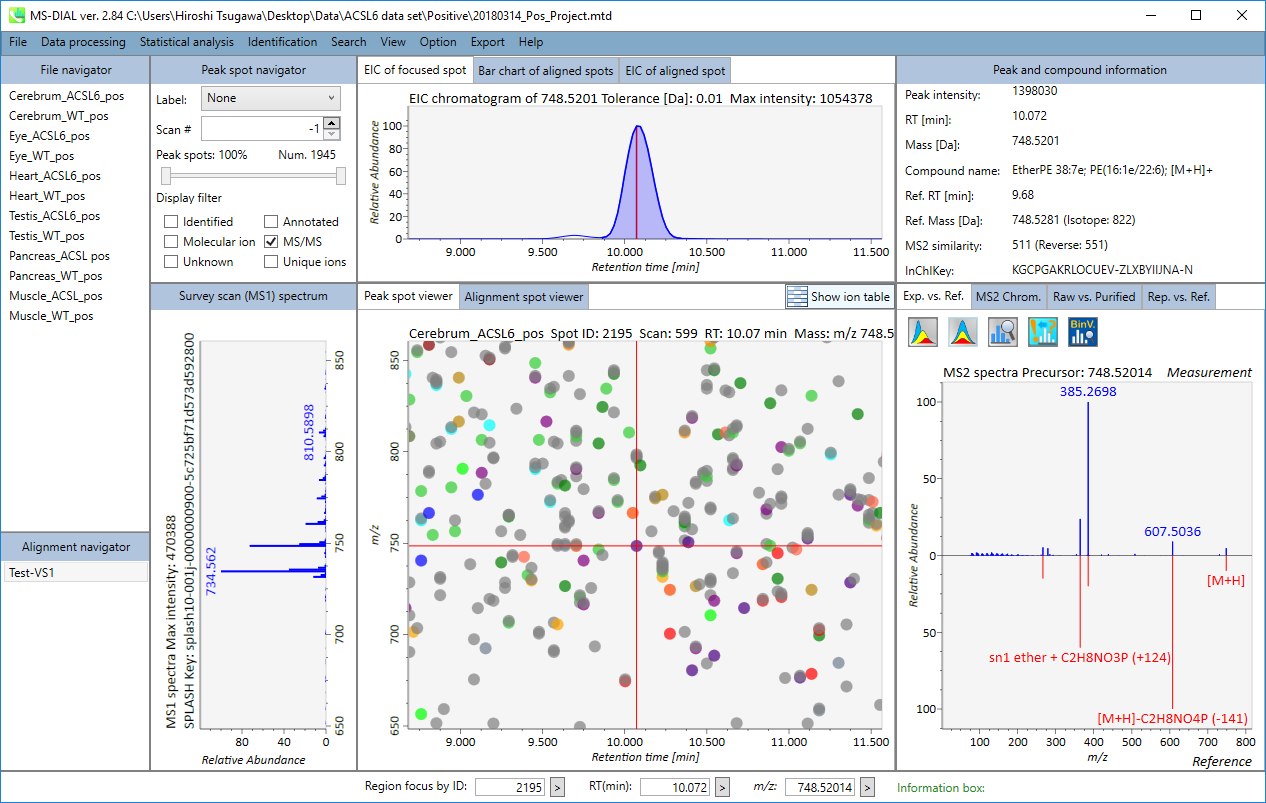
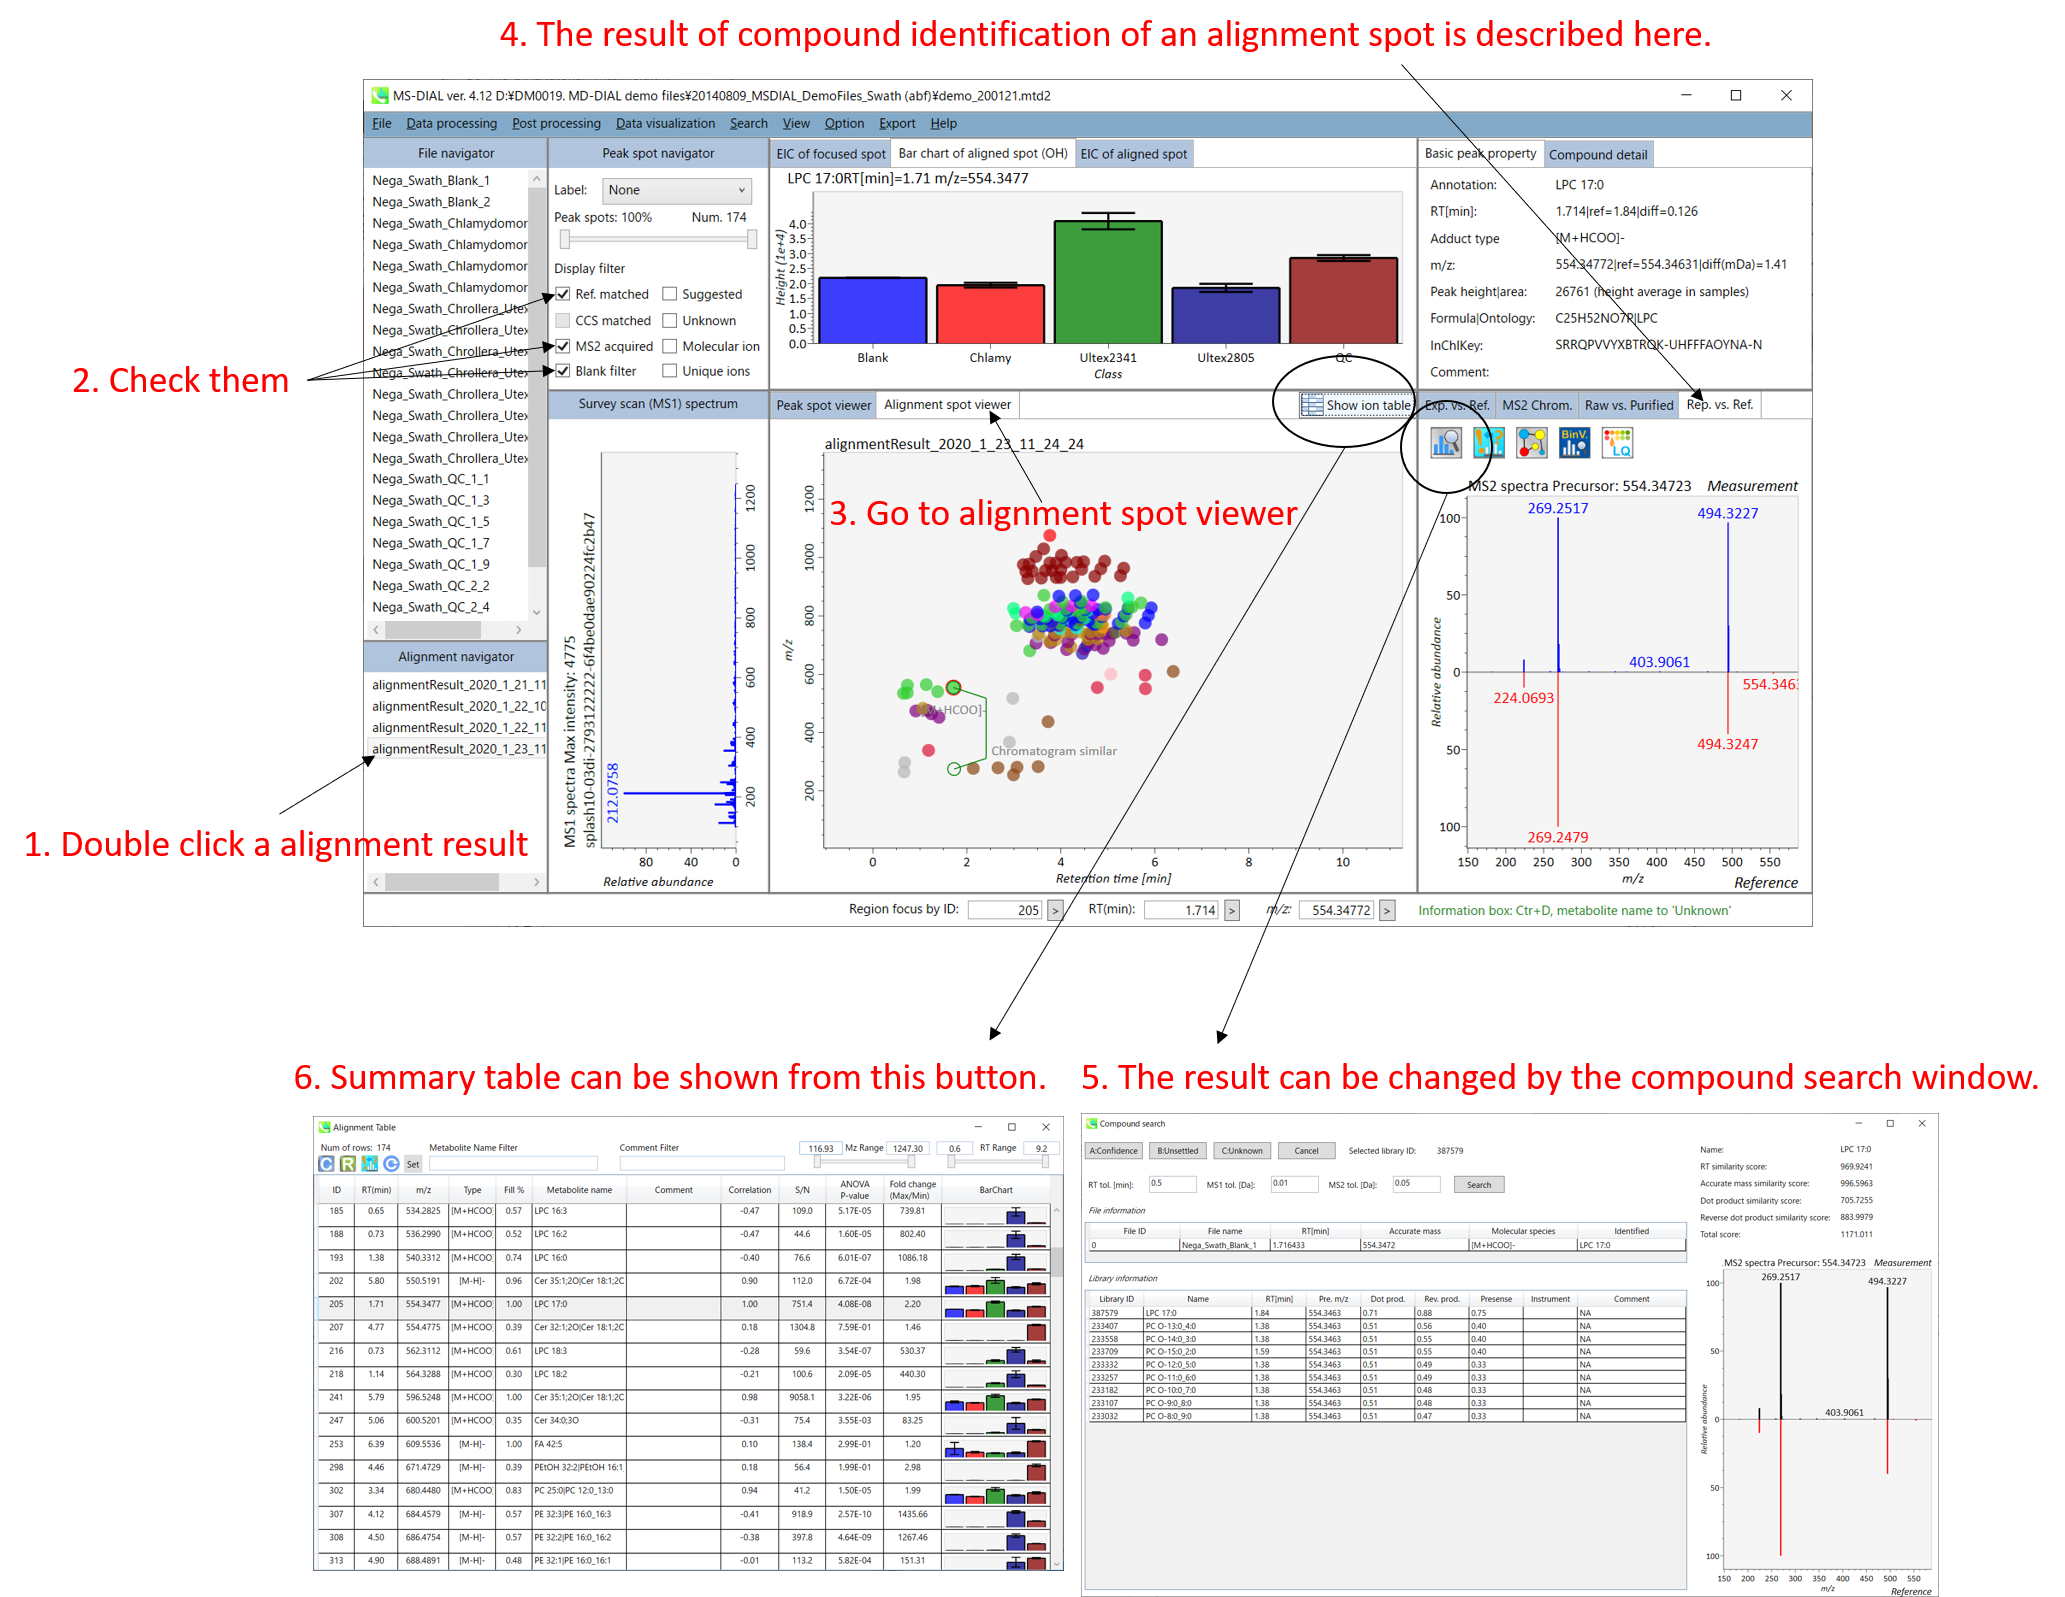
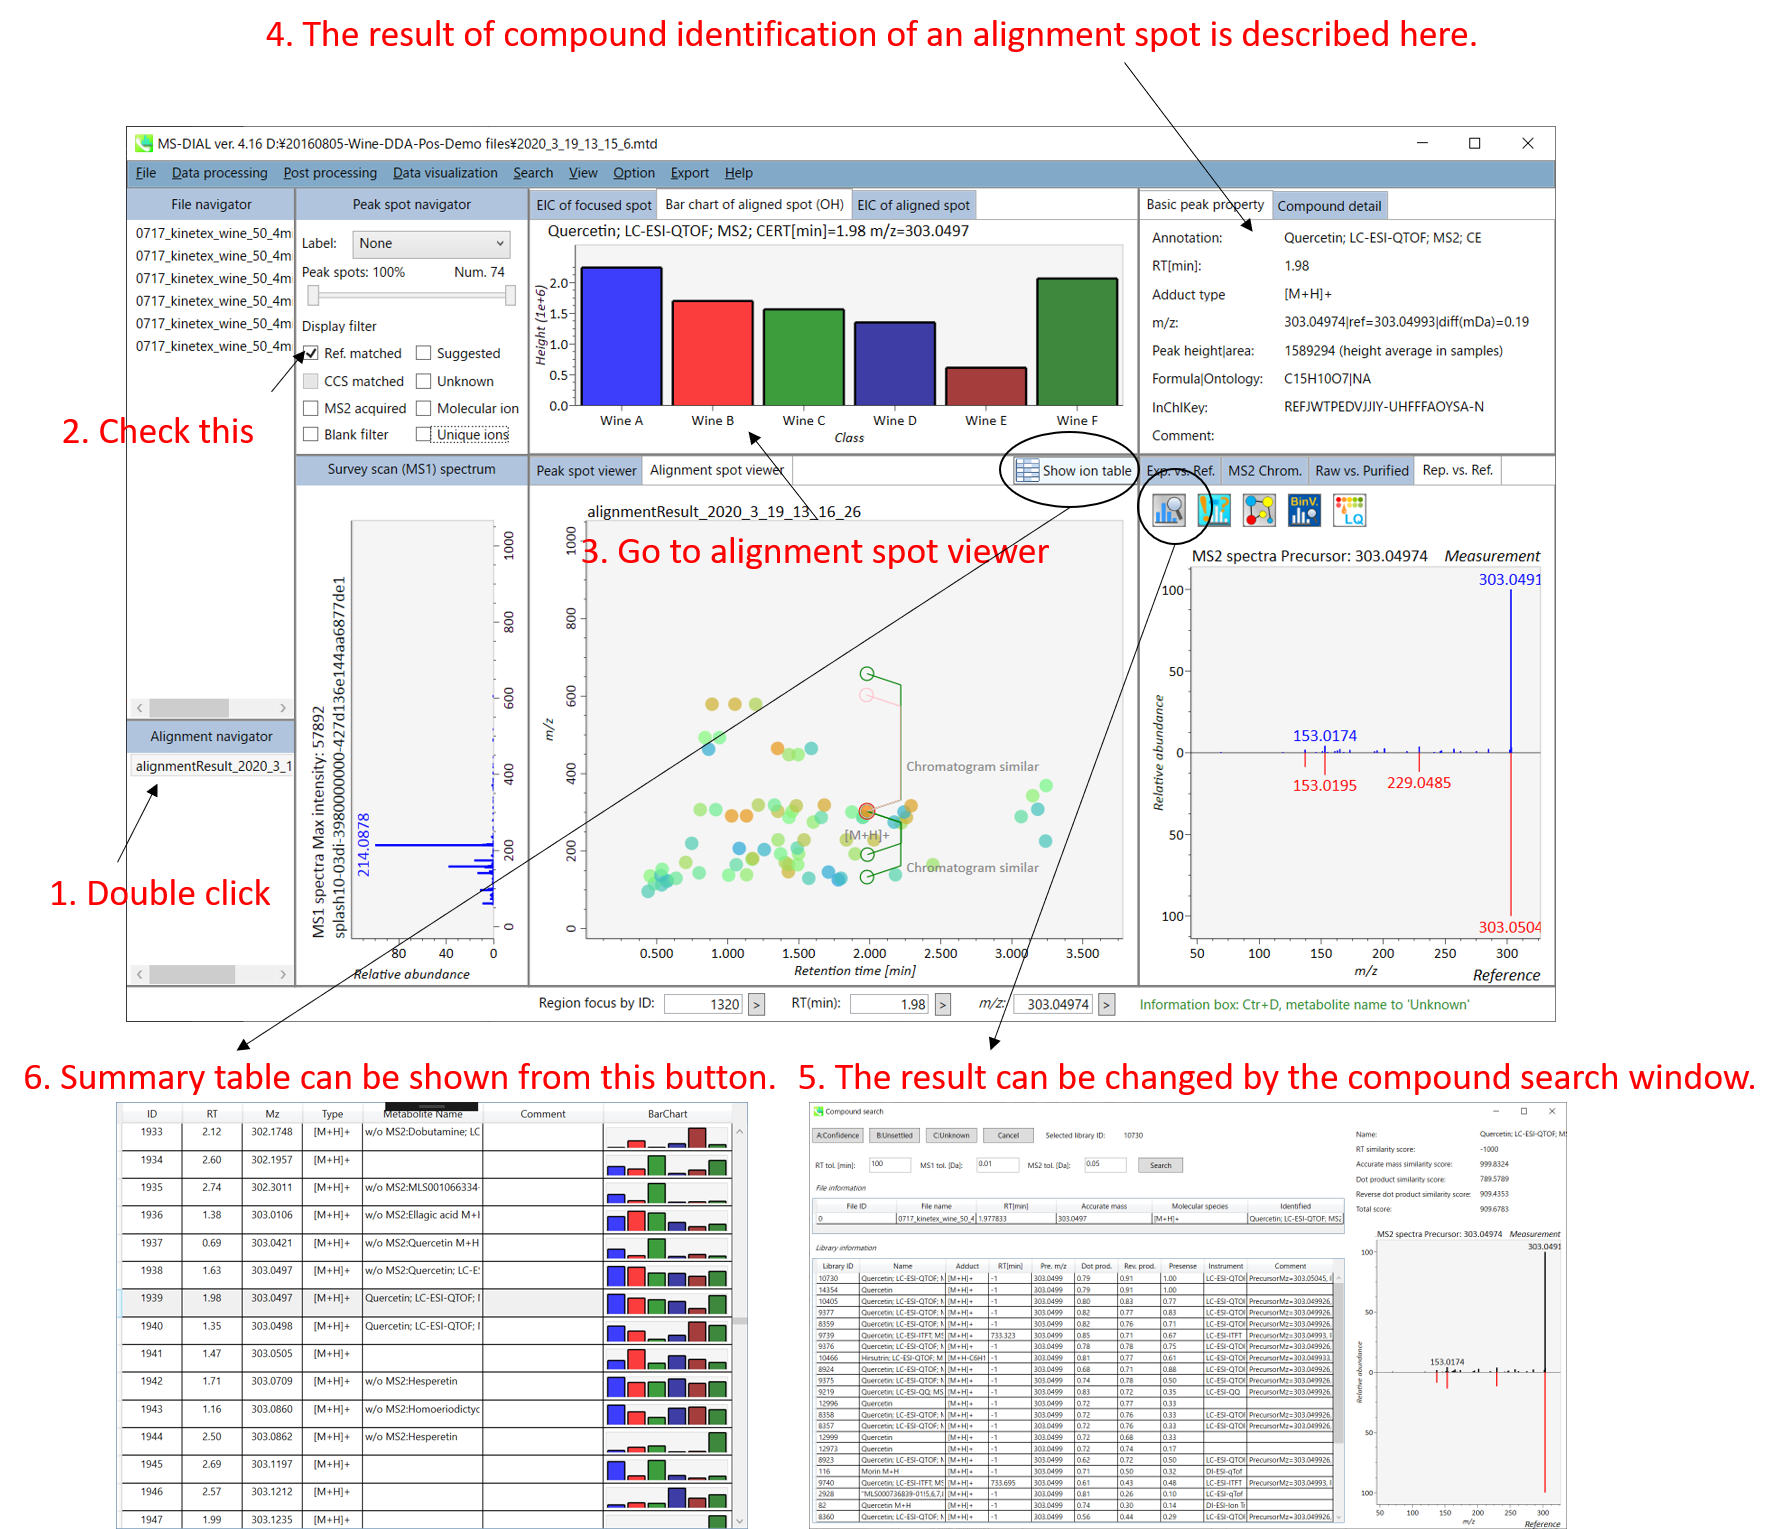
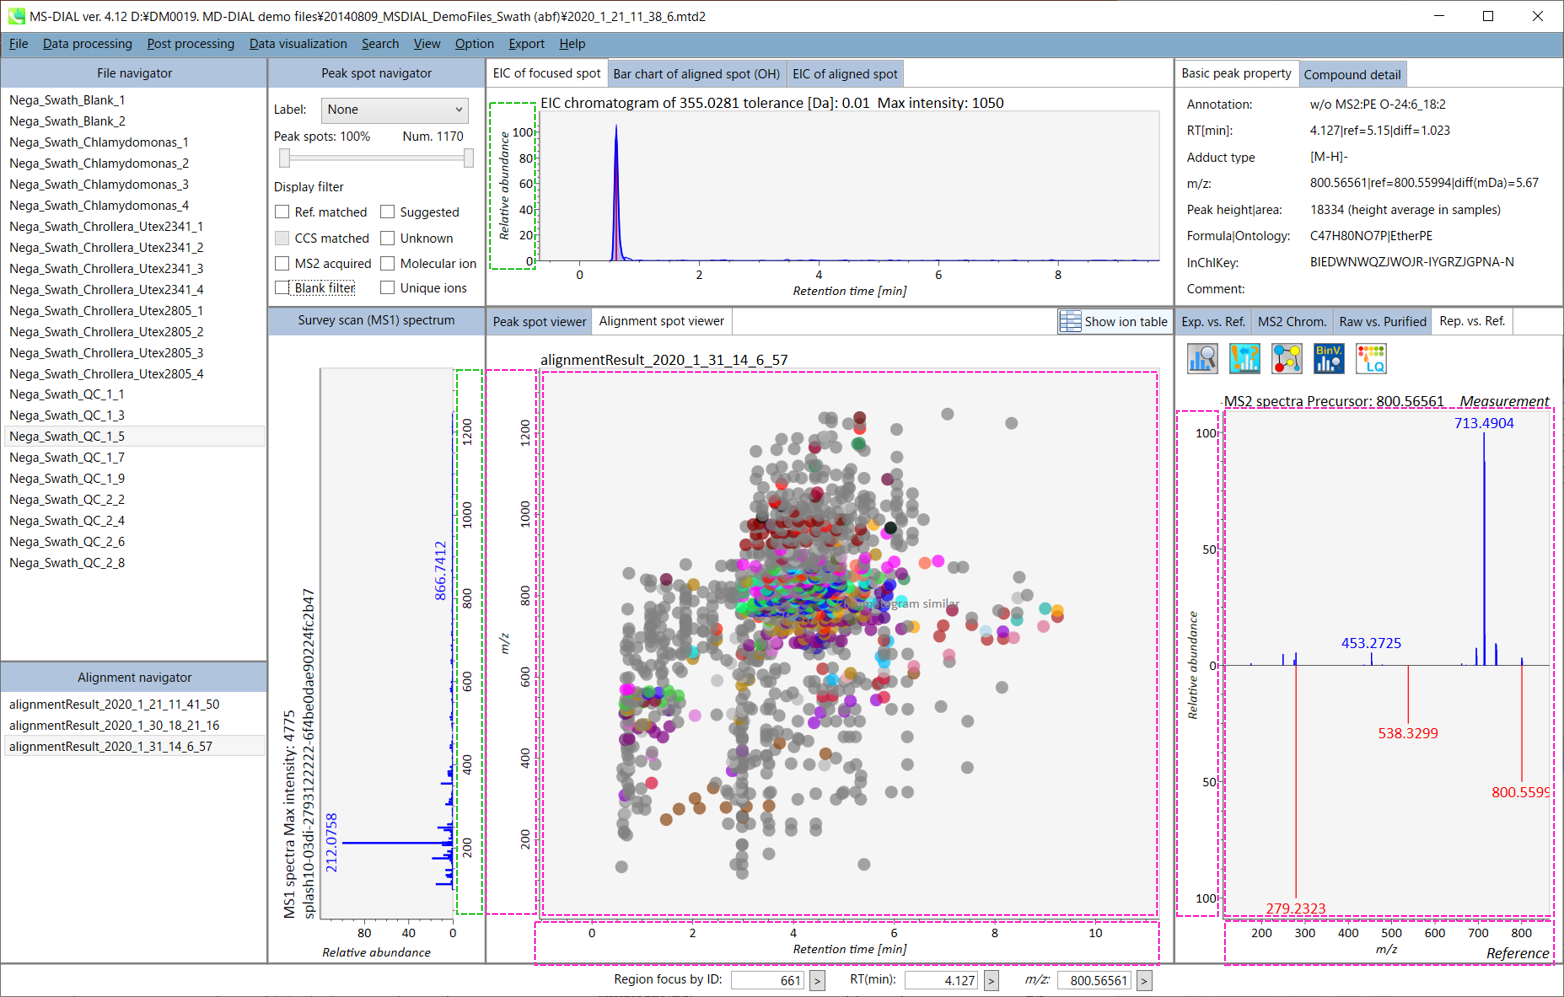
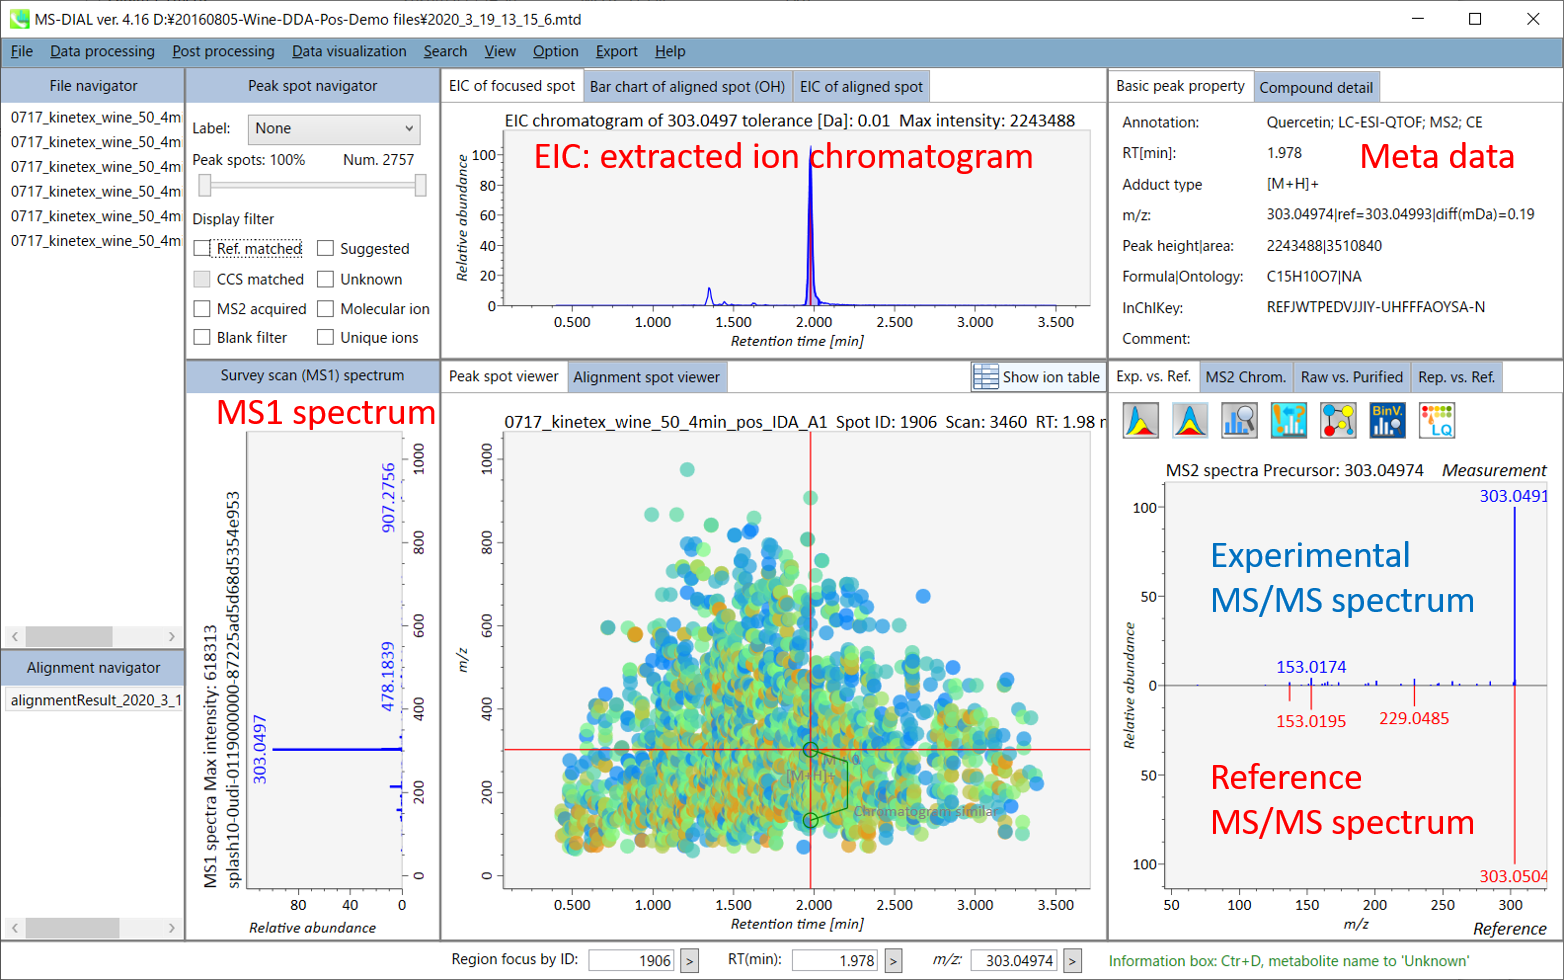
In the main viewer of MS-DIAL, the detected peak information is shown in the central window by double clicking the file name in the File navigator. In the bottom-center window (Peak spot viewer), each spot denotes the detected peak (precursor ion) information: blue spots describe peaks of lower abundance in the sample, red spots describe peaks of higher abundance, and green spots describe peaks of middle abundance. In a lipidomics project, the spot color will mean a specific lipid class such as PC, PE, and TAG etc. The left window (Survey scan (MS1) spectrum) displays the MS1 spectrum of the focused peak and the upper window (EIC of focused spot) displays the extracted ion chromatogram of the focused peak. The right window (Exp. vs. Ref.) displays the MS/MS spectrum (blue or black) and the reference MS/MS spectrum (red). In data independent MS/MS project, the detail of deconvolution is shown in ‘MS2 Chrom.’ and ‘Raw vs. Purified’ tabs of the right panel. The MS/MS chromatograms (both raw- and deconvoluted) are depicted in ‘MS2 Chrom.’. In addition, the raw- and deconvoluted (purified) MS/MS spectrum were depicted in ‘Raw vs. Purified’ tab. Other peak information (metadata) is displayed in the top-right of this window.
在MS-DIAL的主查看器中,通过双击文件导航器中的文件名,检测到的峰值信息显示在中央窗口中。在底部中心窗口(峰斑查看器)中,每个斑点表示检测到的峰(母离子)信息:蓝色斑点表示样品中丰度较低的峰,红色斑点表示丰度较高的峰,绿色斑点表示中丰度的峰。在脂质组学项目中,专色将表示特定的脂质类别,例如 PC、PE 和 TAG 等。左侧窗口(勘测扫描(MS1)谱图)显示聚焦峰的MS1谱图,上部窗口(聚焦斑点的EIC)显示聚焦峰的提取离子色谱图。右侧窗口(实验与参考)显示MS/MS谱图(蓝色或黑色)和参考MS/MS谱图(红色)。在与数据无关的 MS/MS 项目中,反卷积的详细信息显示在右侧面板的“MS2 Chrom.”和“Raw vs. Purified”选项卡中。MS/MS色谱图(原始色谱图和去卷积色谱图)在“MS2色谱图”中描述。此外,原始和去卷积(纯化)MS/MS谱图在“原始与纯化”选项卡中描述。其他峰值信息(元数据)显示在此窗口的右上角。
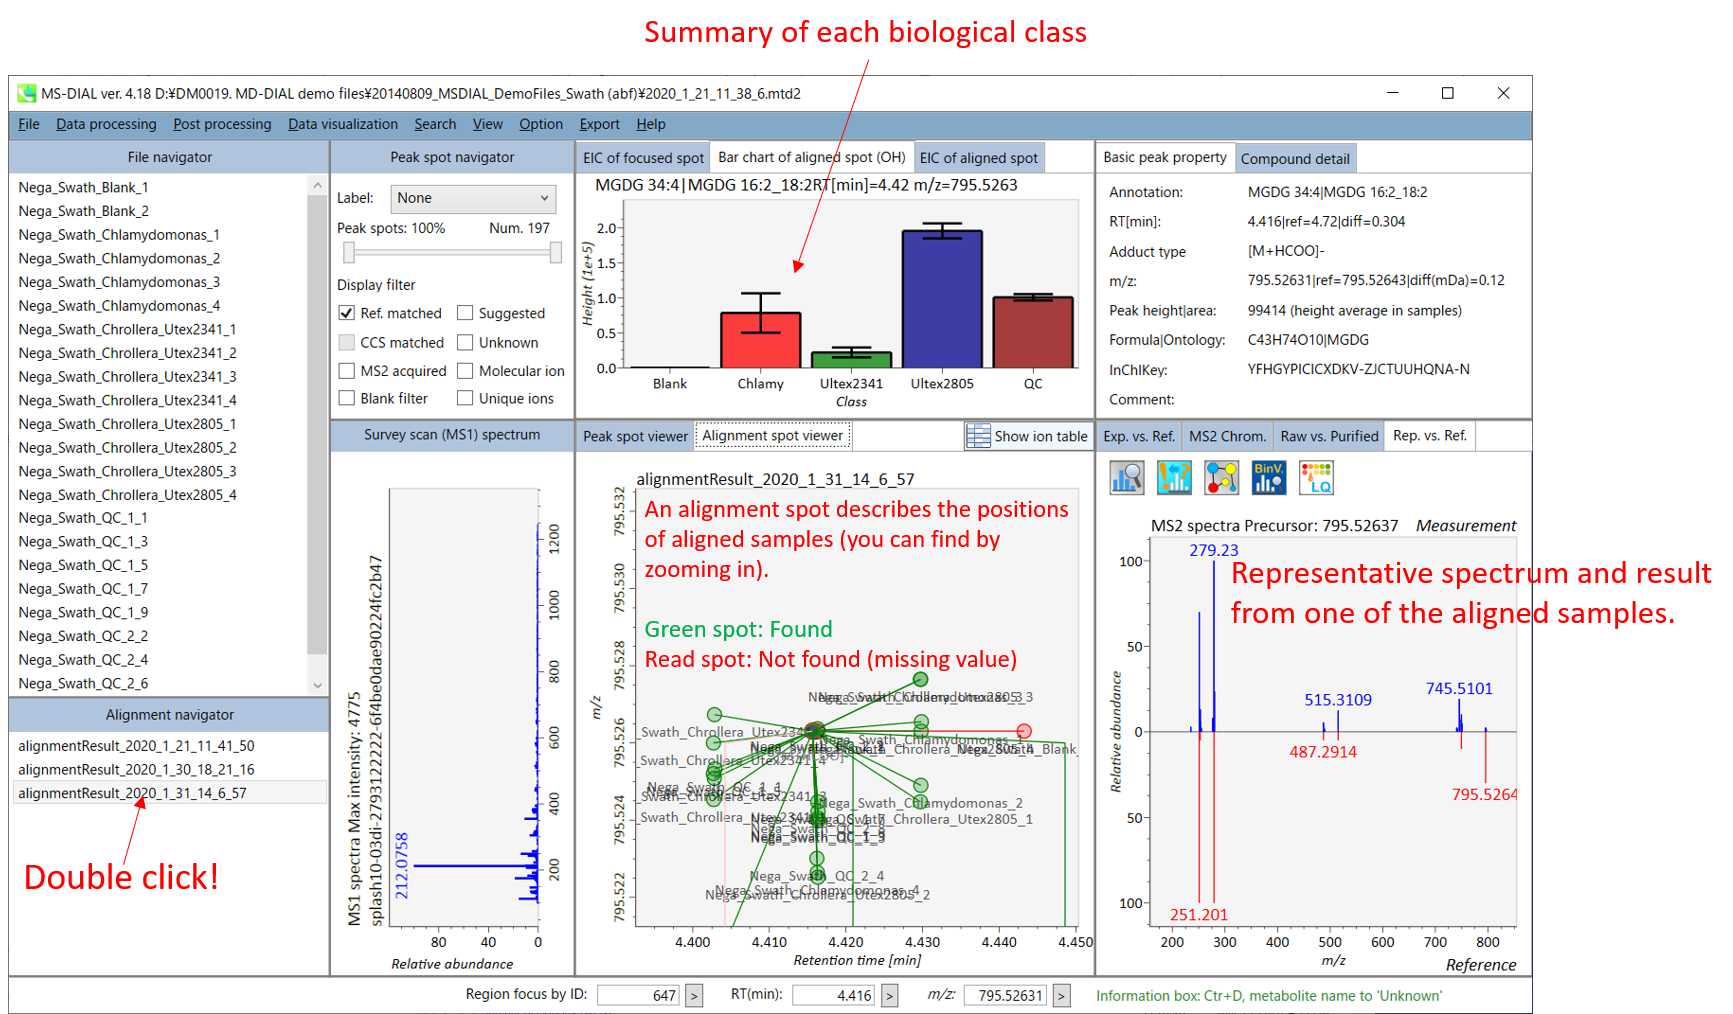
On Alignment spot viewer of the bottom-center window, each spot shows an aligned spot including all retention time, accurate mass, intensity, and MS/MS spectrum of all samples. As described above, in the Peak spot viewer, red, blue, and green “alignment” spot denotes higher, lower, and middle abundance (on average) in the alignment, respectively. By clicking each spot, you can check all retention times and accurate masses of aligned samples. The green spot is associated with the “detected” flag, showing whether all samples contain the spot. The red spot is associated with the “interpolated” flag, showing whether the software program augmented originally missing values.
在底部中心窗口的对齐斑点查看器上,每个斑点都显示一个对齐点,包括所有样品的所有保留时间、准确质量数、强度和MS/MS谱图。如上所述,在峰值点查看器中,红色、蓝色和绿色“对齐”点分别表示对齐中较高、较低和中等丰度(平均)。通过单击每个点,您可以检查所有保留时间和对齐样品的准确质量数。绿点与“检测到”标志相关联,显示是否所有样本都包含该斑点。红点与“插值”标志相关联,显示软件程序是否增加了最初缺失的值。
On Rep. vs. Ref. tab of bottom-right panel, in combination with the Alignment spot viewer, you can compare a representative MS/MS spectrum and a reference MS/MS spectrum. The representative MS/MS is automatically selected as the spectrum of the highest identification score for all samples aligned to the focused alignment spot.
在右下角面板的“代表与参考”选项卡上,结合“对准点”查看器,您可以比较具有代表性的 MS/MS 谱图和参考 MS/MS 谱图。代表性的MS/MS被自动选为与聚焦对齐点对齐的所有样品的最高鉴定分数谱图。
On Bar chart of aligned spot (OH) of top panel, you can see the summary of the target ion abundances by means of its average and standard deviation (SD) of the specific biological class. The biological classes can be defined from ‘Option -> File property setting’.
在上图的对齐斑点 (OH) 条形图上,您可以通过特定生物类别的平均值和标准偏差 (SD) 来查看目标离子丰度的摘要。生物类可以从“选项 -> 文件属性设置”中定义。
Section 5-3 第 5-3 节
Overview of the MS-DIAL main window in GC/MS project
GC/MS项目中MS-DIAL主窗口概述
The main viewer of MS-DIAL GC/MS is mostly the same as the viewer of LC/MS part. The specific difference between GC/MS part and LC/MS part are in ‘Peak spot viewer’. The peak picking and deconvolution results of a GC/MS file are shown in the center window by mouse left double click of the file name in the File navigator. In the center window (Peak spot viewer), each circle spot denotes the detected peak on each mass (m/z) trace: blue spots describe peaks of lower abundance in the sample, red spots describe peaks of higher abundance, and green spots describe peaks of middle abundance. However, in contrast to LC/MS part, these circle spots are not meaningful very much. Instead, the reverse triangle is the important description to recognize detected metabolites.
MS-DIAL GC/MS 的主查看器与 LC/MS 部分的查看器基本相同。GC/MS部分和LC/MS部分的具体区别在于“峰点查看器”。GC/MS文件的峰拾取和反卷积结果显示在中心窗口中,方法是在文件导航器中鼠标左键双击文件名。在中心窗口(峰斑查看器)中,每个圆斑表示每个质量数 (m/z) 迹线上检测到的峰:蓝色斑点表示样品中丰度较低的峰,红色斑点表示丰度较高的峰,绿色斑点表示丰度中等的峰。然而,与LC/MS部分相比,这些圆斑没有多大意义。相反,反向三角形是识别检测到的代谢物的重要描述。
Once you click one of the reverse triangles, you can see the detail of detected (deconvoluted) peak. The left window (Survey scan (MS1) spectrum) displays the MS1 spectrum of the focused peak and the upper window (EIC of focused spot) displays the extracted ion chromatogram of the quant mass of focused peak. The right window (Exp. vs. Ref.) displays the EI spectrum (blue or black) and the reference MS/MS spectrum (red). The detail of deconvolution is shown in ‘EI Chrom.’ And ‘Raw vs. Purified’ tabs of the right panel. The EI chromatograms (both raw- and deconvoluted) are depicted in ‘EI Chrom.’. In addition, the raw- and deconvoluted (purified) EI spectrum were depicted in ‘Raw vs. Purified tab. Other peak information (metadata) is displayed in the top-right of this window.
单击其中一个反向三角形后,您可以看到检测到的(去卷积)峰的详细信息。左窗口(巡视扫描(MS1)谱图)显示聚焦峰的MS1谱图,上窗口(聚焦斑点的EIC)显示聚焦峰定量质量数的提取离子色谱图。右侧窗口(Exp. vs. Ref.)显示EI谱图(蓝色或黑色)和参考MS/MS谱图(红色)。反卷积的细节显示在“EI Chrom”中。以及右侧面板的“原始与纯化”选项卡。EI色谱图(原始色谱图和去卷积色谱图)在“EI色谱图”中描述。此外,原始和去卷积(纯化)EI谱图在“原始与纯化”选项卡中进行了描述。其他峰值信息(元数据)显示在此窗口的右上角。
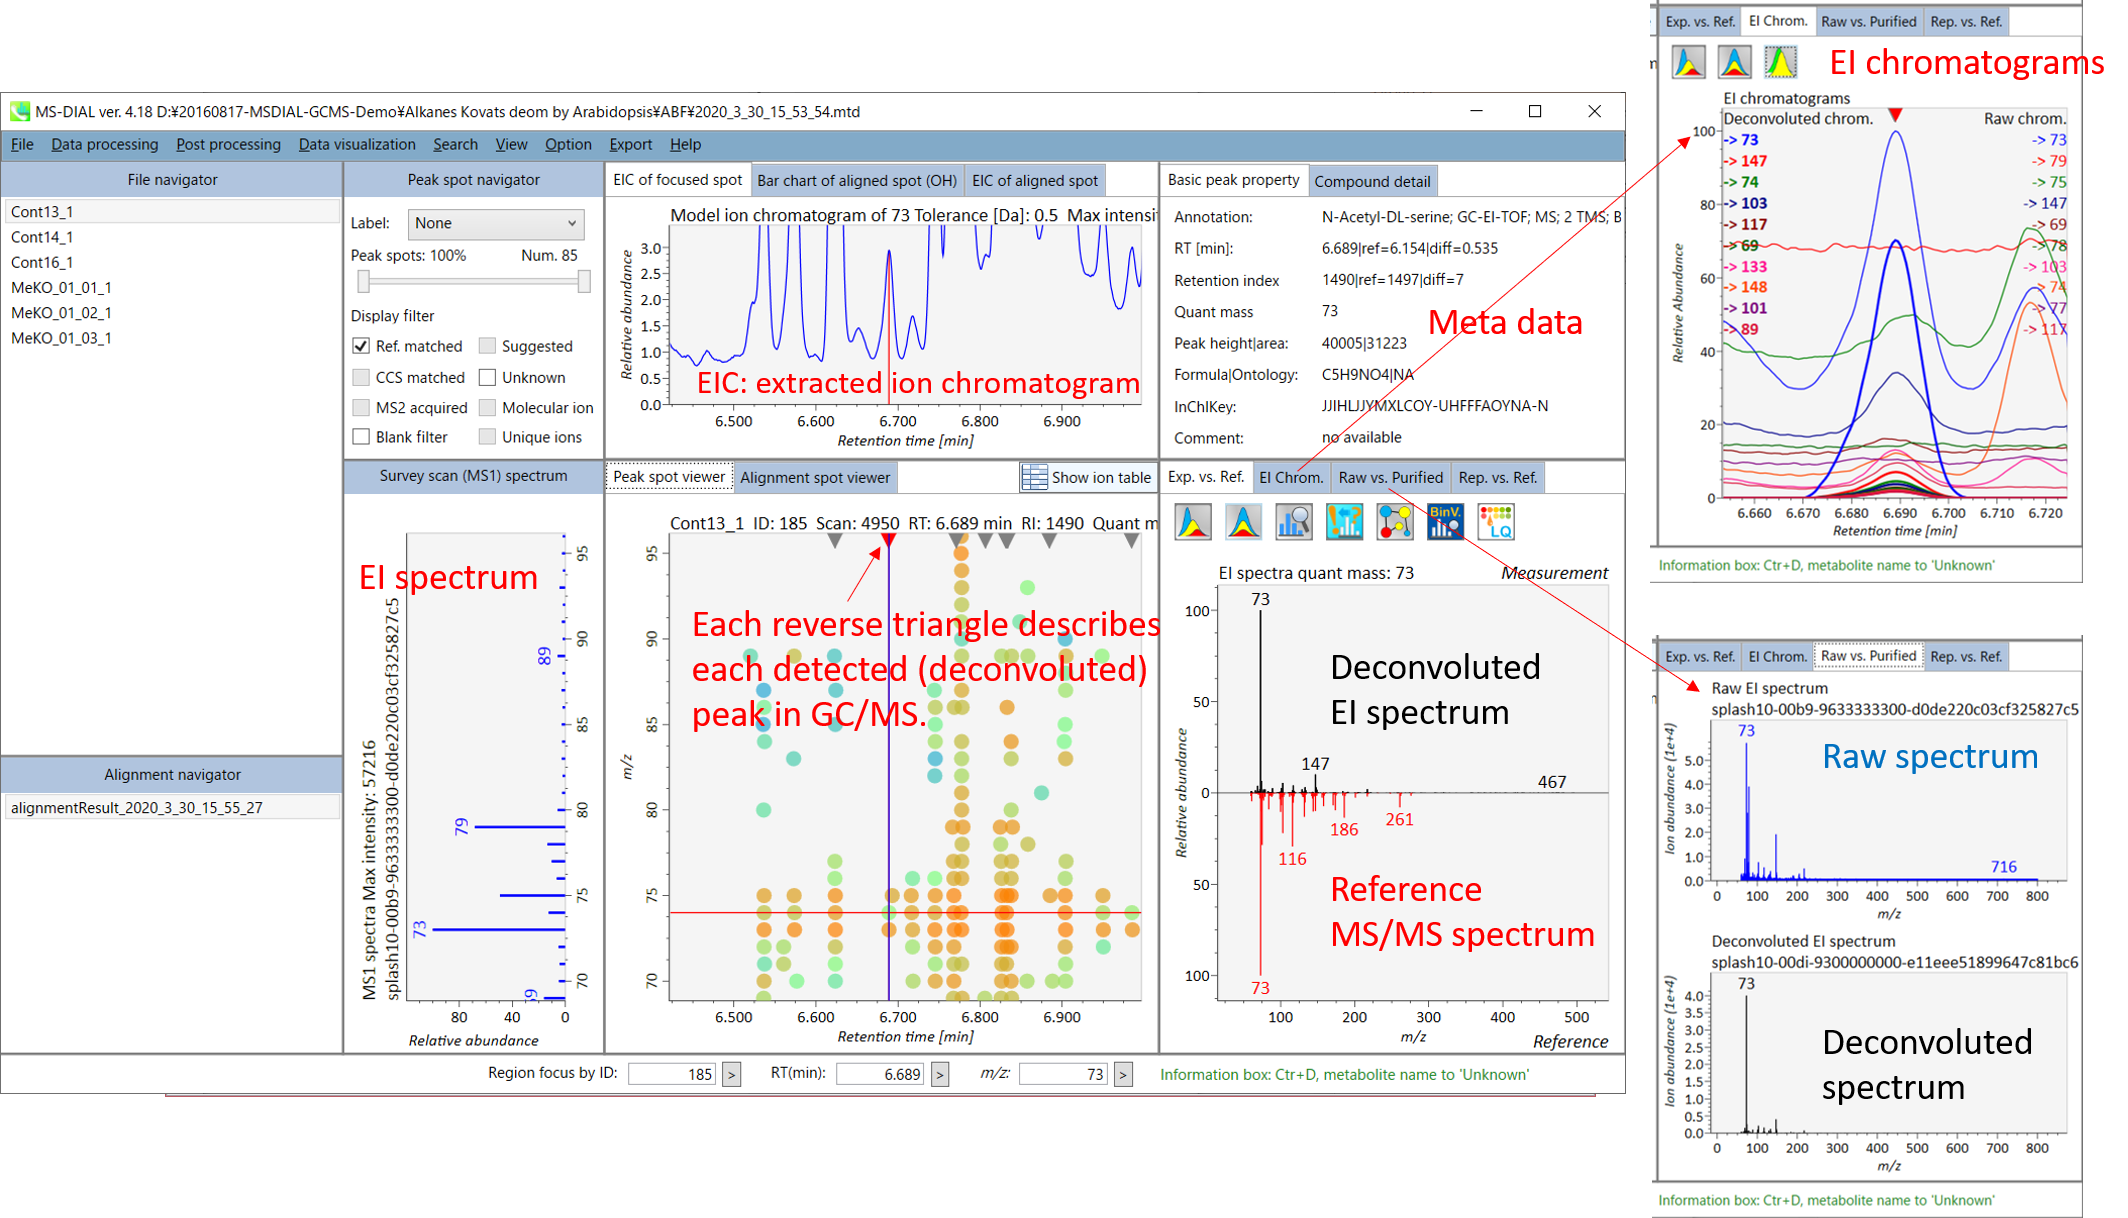
On Alignment spot viewer, the description is also mostly the same as that of LC/MS part. Each spot shows an aligned spot including all retention time, quant mass, intensity, and EI spectrum of all samples. As in the Peak spot viewer, red, blue, and green “alignment” spot denotes higher, lower, and middle abundance (on average) in the alignment, respectively. By clicking each spot, you can check the difference of retention times of aligned samples. Note that the difference of Y-axis does not have any physical meaning: the drawing of Y-axis is performed randomly to separately draw each samples. The green spot is associated with the “detected” flag, showing whether all samples contain the spot. The red spot is associated with the “interpolated” flag, showing whether the software program augmented originally missing values.
在Alignment spot viewer上,描述也与LC/MS部分的描述基本相同。每个斑点显示一个对齐的斑点,包括所有样品的所有保留时间、定量质量数、强度和EI谱图。与峰值点查看器一样,红色、蓝色和绿色“对齐”点分别表示对齐中较高、较低和中等丰度(平均)。通过单击每个点,您可以检查对齐样品的保留时间差异。请注意,Y 轴的差异没有任何物理意义:Y 轴的绘制是随机进行的,以分别绘制每个样本。绿点与“检测到”标志相关联,显示是否所有样本都包含该斑点。红点与“插值”标志相关联,显示软件程序是否增加了最初缺失的值。
On Rep. vs. Ref. tab of right panel, in combination with the Alignment spot viewer, the window compares a representative EI spectrum and a reference EI spectrum. The representative EI is automatically selected as the spectrum of the highest identification score for all samples aligned to the focused alignment spot.
在右侧面板的“代表”与“参考”选项卡上,结合“对齐点”查看器,该窗口将比较具有代表性的 EI 光谱和参考 EI 光谱。代表性EI被自动选为与聚焦对准点对齐的所有样品的最高识别分数谱。
On Bar chart of aligned spots (OH) of top panel, you can see the summary of the target ion abundances by means of its average and standard deviation (SD) of the specific biological class. The biological classes can be defined from ‘Option -> File property setting’.
在上图的对齐斑点 (OH) 条形图上,您可以通过特定生物类别的平均值和标准偏差 (SD) 来查看目标离子丰度的摘要。生物类可以从“选项 -> 文件属性设置”中定义。
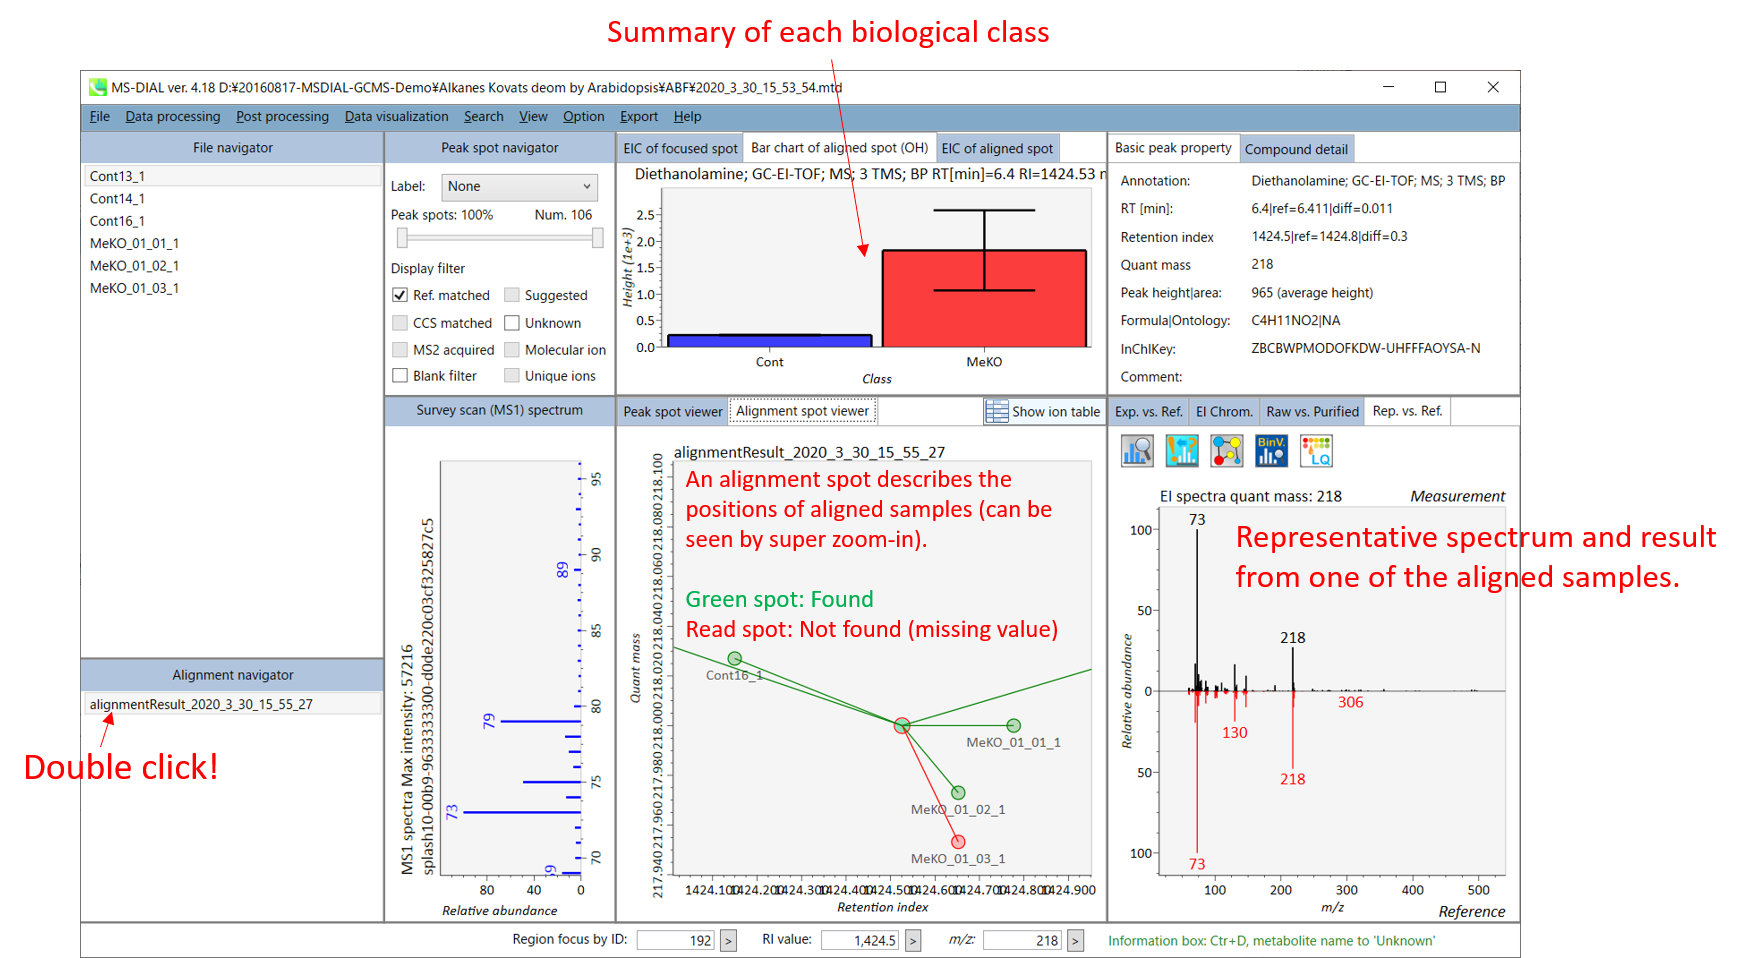
Section 5-4 第 5-4 节
Compound search for the result curation of peak identification
化合物检索峰鉴定结果管理
The automatic identification process cannot escape from mis-identification. MS-DIAL provides the user-interface so that users can manually correct the identification result. In this option, you can customize the identification criteria into three levels: “confident”, “unsettled”, and “unknown.” For example, in the phospholipid identification, we often determine only the cumulative composition such as PC 36:1 without positions of acyl chains, e.g. PC(18:0/18:1). You can add “unsettled” tag to such peaks as the signpost to comment that “we only checked the cumulative composition”.
自动识别过程无法避免错误识别。MS-DIAL提供用户界面,以便用户可以手动更正识别结果。在此选项中,您可以将识别标准自定义为三个级别:“确定”、“未确定”和“未知”。例如,在磷脂鉴定中,我们通常只确定累积组成,如PC 36:1,而不测定酰基链的位置,如PC(18:0/18:1)。您可以在路标等山峰上添加“未解决”标签,以评论“我们只检查了累积成分”。
Information of identification is available not only in the “Peak spot viewer” but also in the “Alignment spot viewer”. Although you only see representative spectra from all samples in the alignment viewer, it is very helpful to make a data matrix and to check your peak identification result. Importantly, the curation in the alignment viewer will be reflected in principal component analysis or the output of data matrix.
识别信息不仅在“峰点查看器”中可用,而且在“对齐点查看器”中也可用。虽然在比对查看器中只能看到所有样品的代表性谱图,但制作数据矩阵并检查峰鉴定结果非常有帮助。重要的是,对齐查看器中的策展将反映在主成分分析或数据矩阵的输出中。
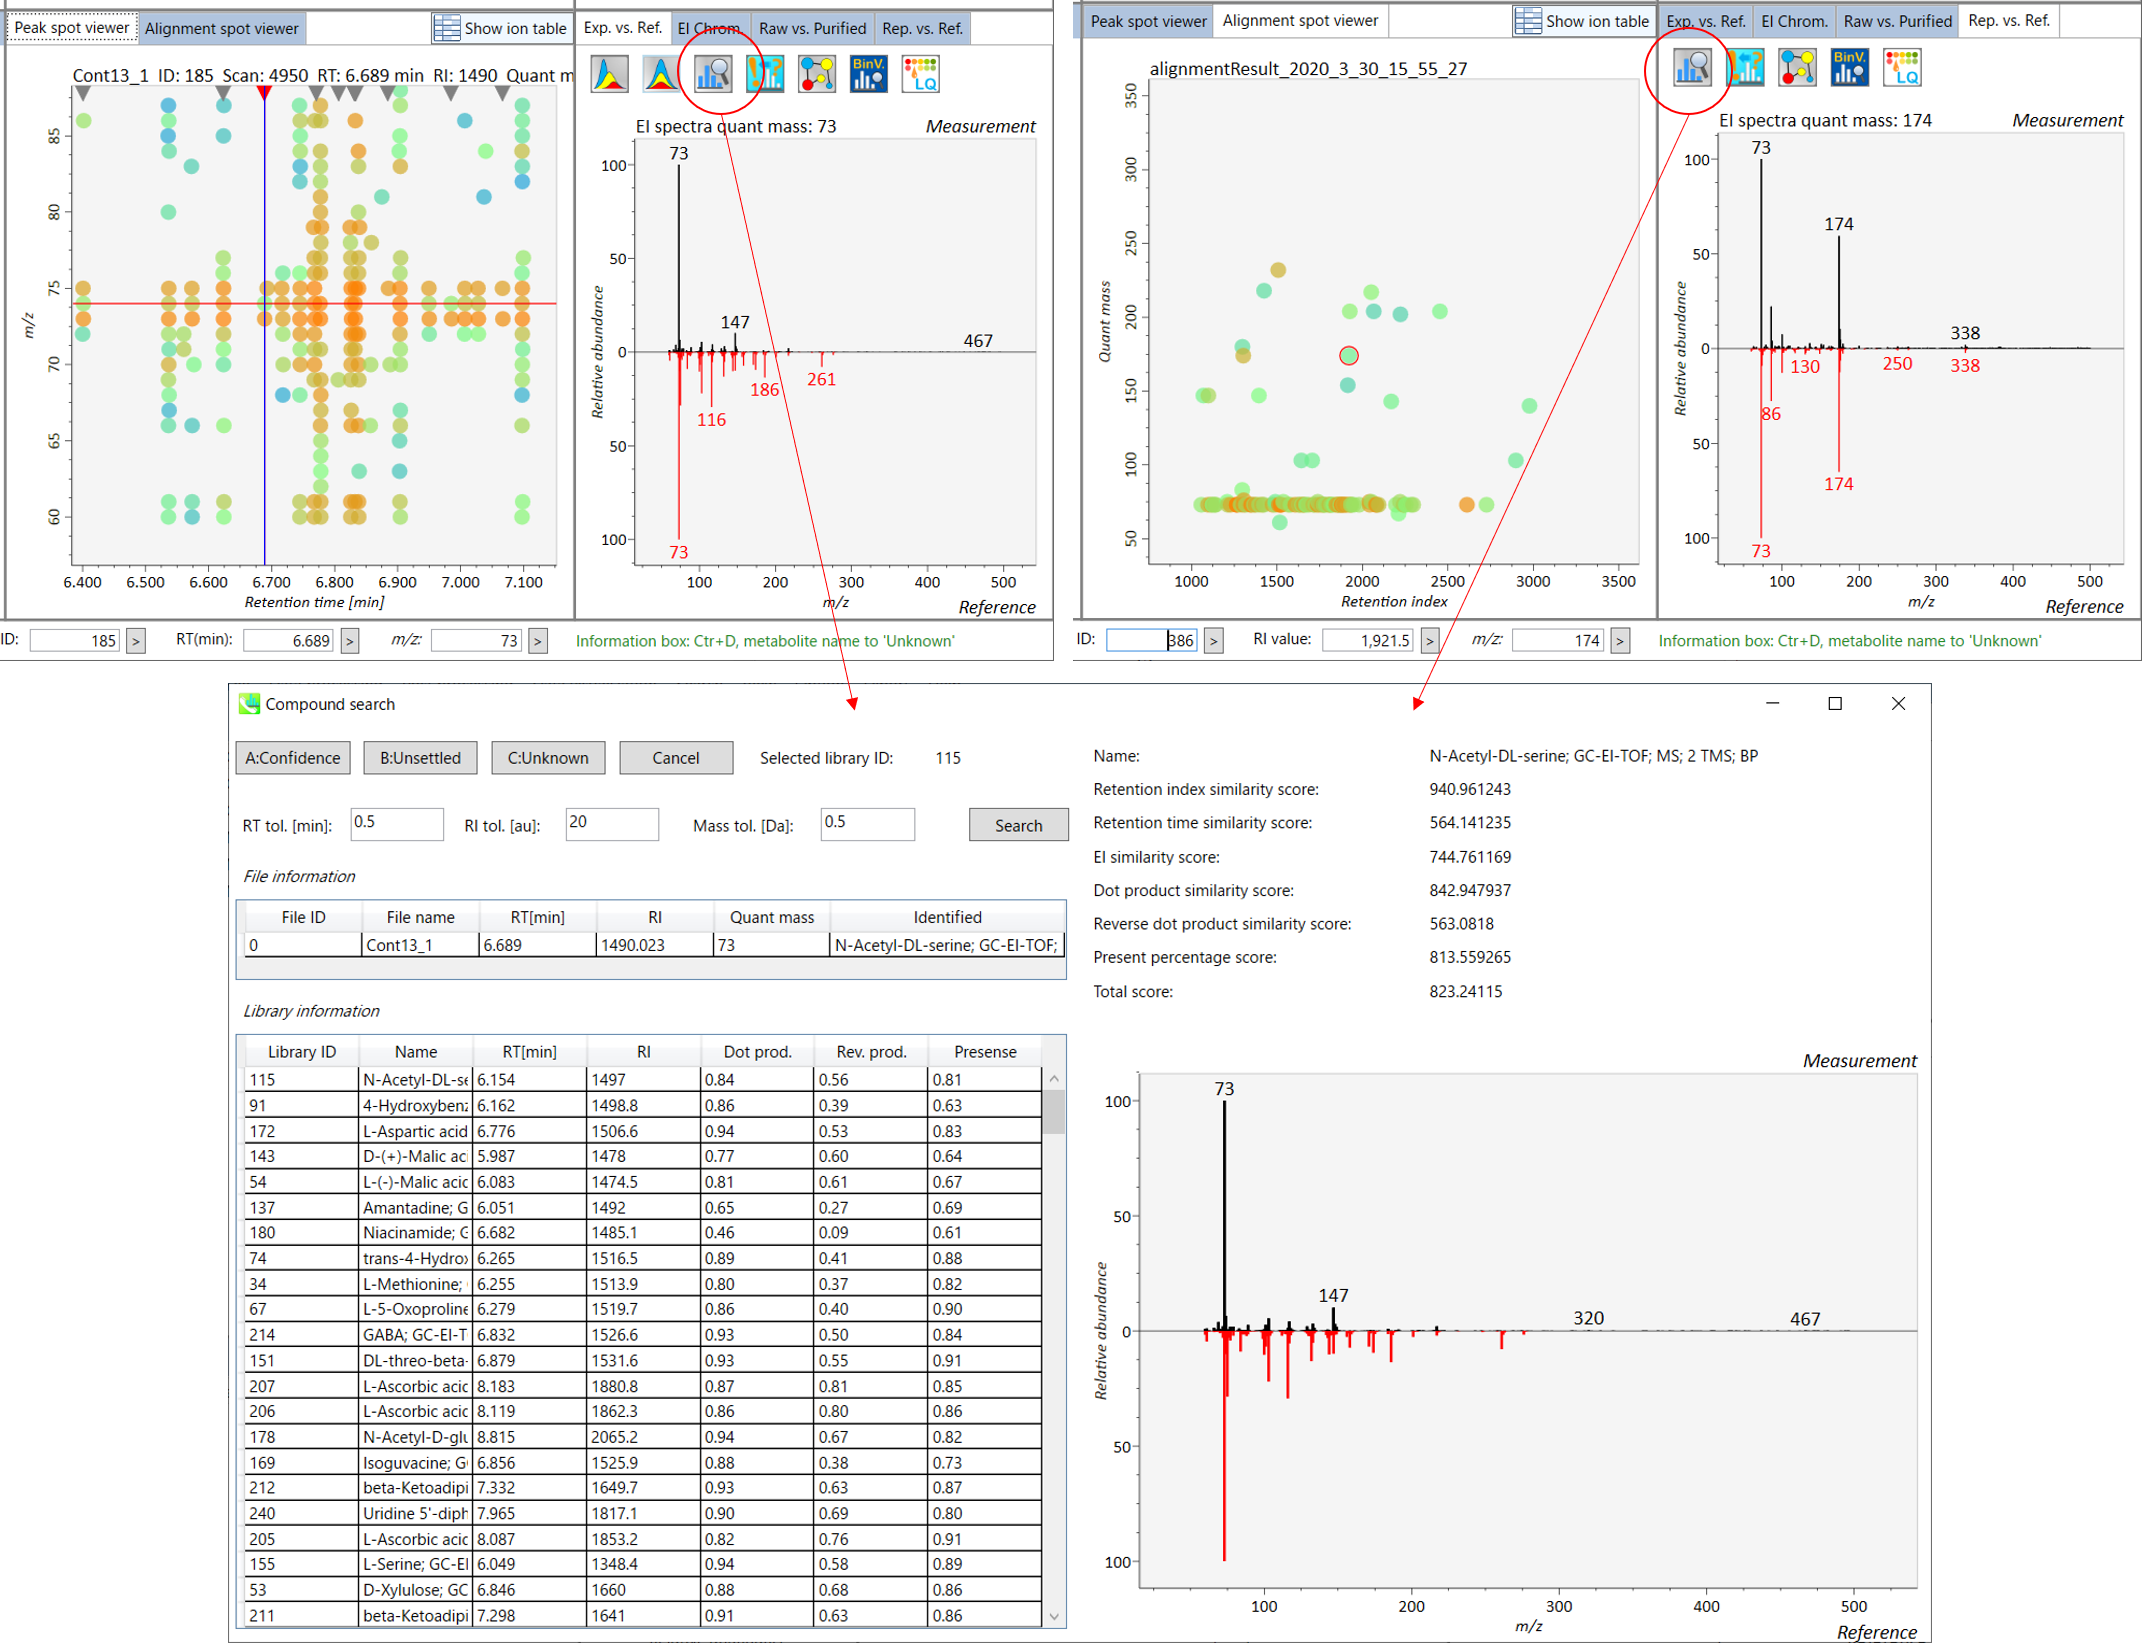
A) Click the icon “Compound search” (shown by encircling in the picture above).
A) 单击“复合搜索”图标(如上图所示)。
B) Click each row of the library information to show identification details.
B) 单击库信息的每一行以显示标识详细信息。
C) Add a tolerance value for identification and click the “Search” button.
C) 添加公差值进行识别,然后单击“搜索”按钮。
D) You can select either “A: Confidence”, “B: Unsettled” or “C: Unknown.”
D) 您可以选择“A:置信度”、“B:未确定”或“C:未知”。
Section 5-5 第5-5节
Normalization and statistical analysis in MS-DIAL
MS-DIAL中的归一化和统计分析
Data normalization by internal standards or LOESS algorithm
通过内部标准或 LOESS 算法进行数据归一化
Principal component analysis
主成分分析
Partial least squares (PLS) and orthogonal partial least squares (OPLS)
偏最小二乘法 (PLS) 和正交偏最小二乘法 (OPLS)
A) If you want to use internal standards to normalize your peak list, you have to set the IS information in Option menu. MS-DIAL also supports LOESS and cubic spline algorithm to normalize batch or amplitude drifts. In order to use the LOESS algorithm, you have to set “quality control” and “analytical order” information correctly in the Option menu.
A) 如果要使用内标对峰列表进行标准化,则必须在“选项”菜单中设置IS信息。MS-DIAL还支持LOESS和三次样条算法,以规范化批量或幅度漂移。为了使用LOESS算法,您必须在选项菜单中正确设置“质量控制”和“分析顺序”信息。
B) If you want to use the other statistics, please go to PRIMe web site:
B) 如果您想使用其他统计数据,请访问 PRIMe 网站:
http://prime.psc.riken.jp/Metabolomics_Software/StatisticalAnalysisOnMicrosoftExcel/index.html
* Below is the brief description of how to do LOWESS normalization with an internal standard compound information in MS-DIAL. In the below setting, all ‘QC_***’ samples will be recognized as ‘quality control’ and the injection order is recognized as this setting. Then, all metabolite peaks will be divided by the ion abundance of alignment spot ID ‘245’ which was annotated LysoPC 17:0 from the setting below.
* 以下是如何使用MS-DIAL中的内标化合物信息进行LOWESS归一化的简要说明。在下面的设置中,所有“QC_***”样品都将被识别为“质量控制”,进样顺序将被识别为该设置。然后,将所有代谢物峰除以比对斑点 ID '245' 的离子丰度,该位点在下面的设置中以 LysoPC 17:0 注释。
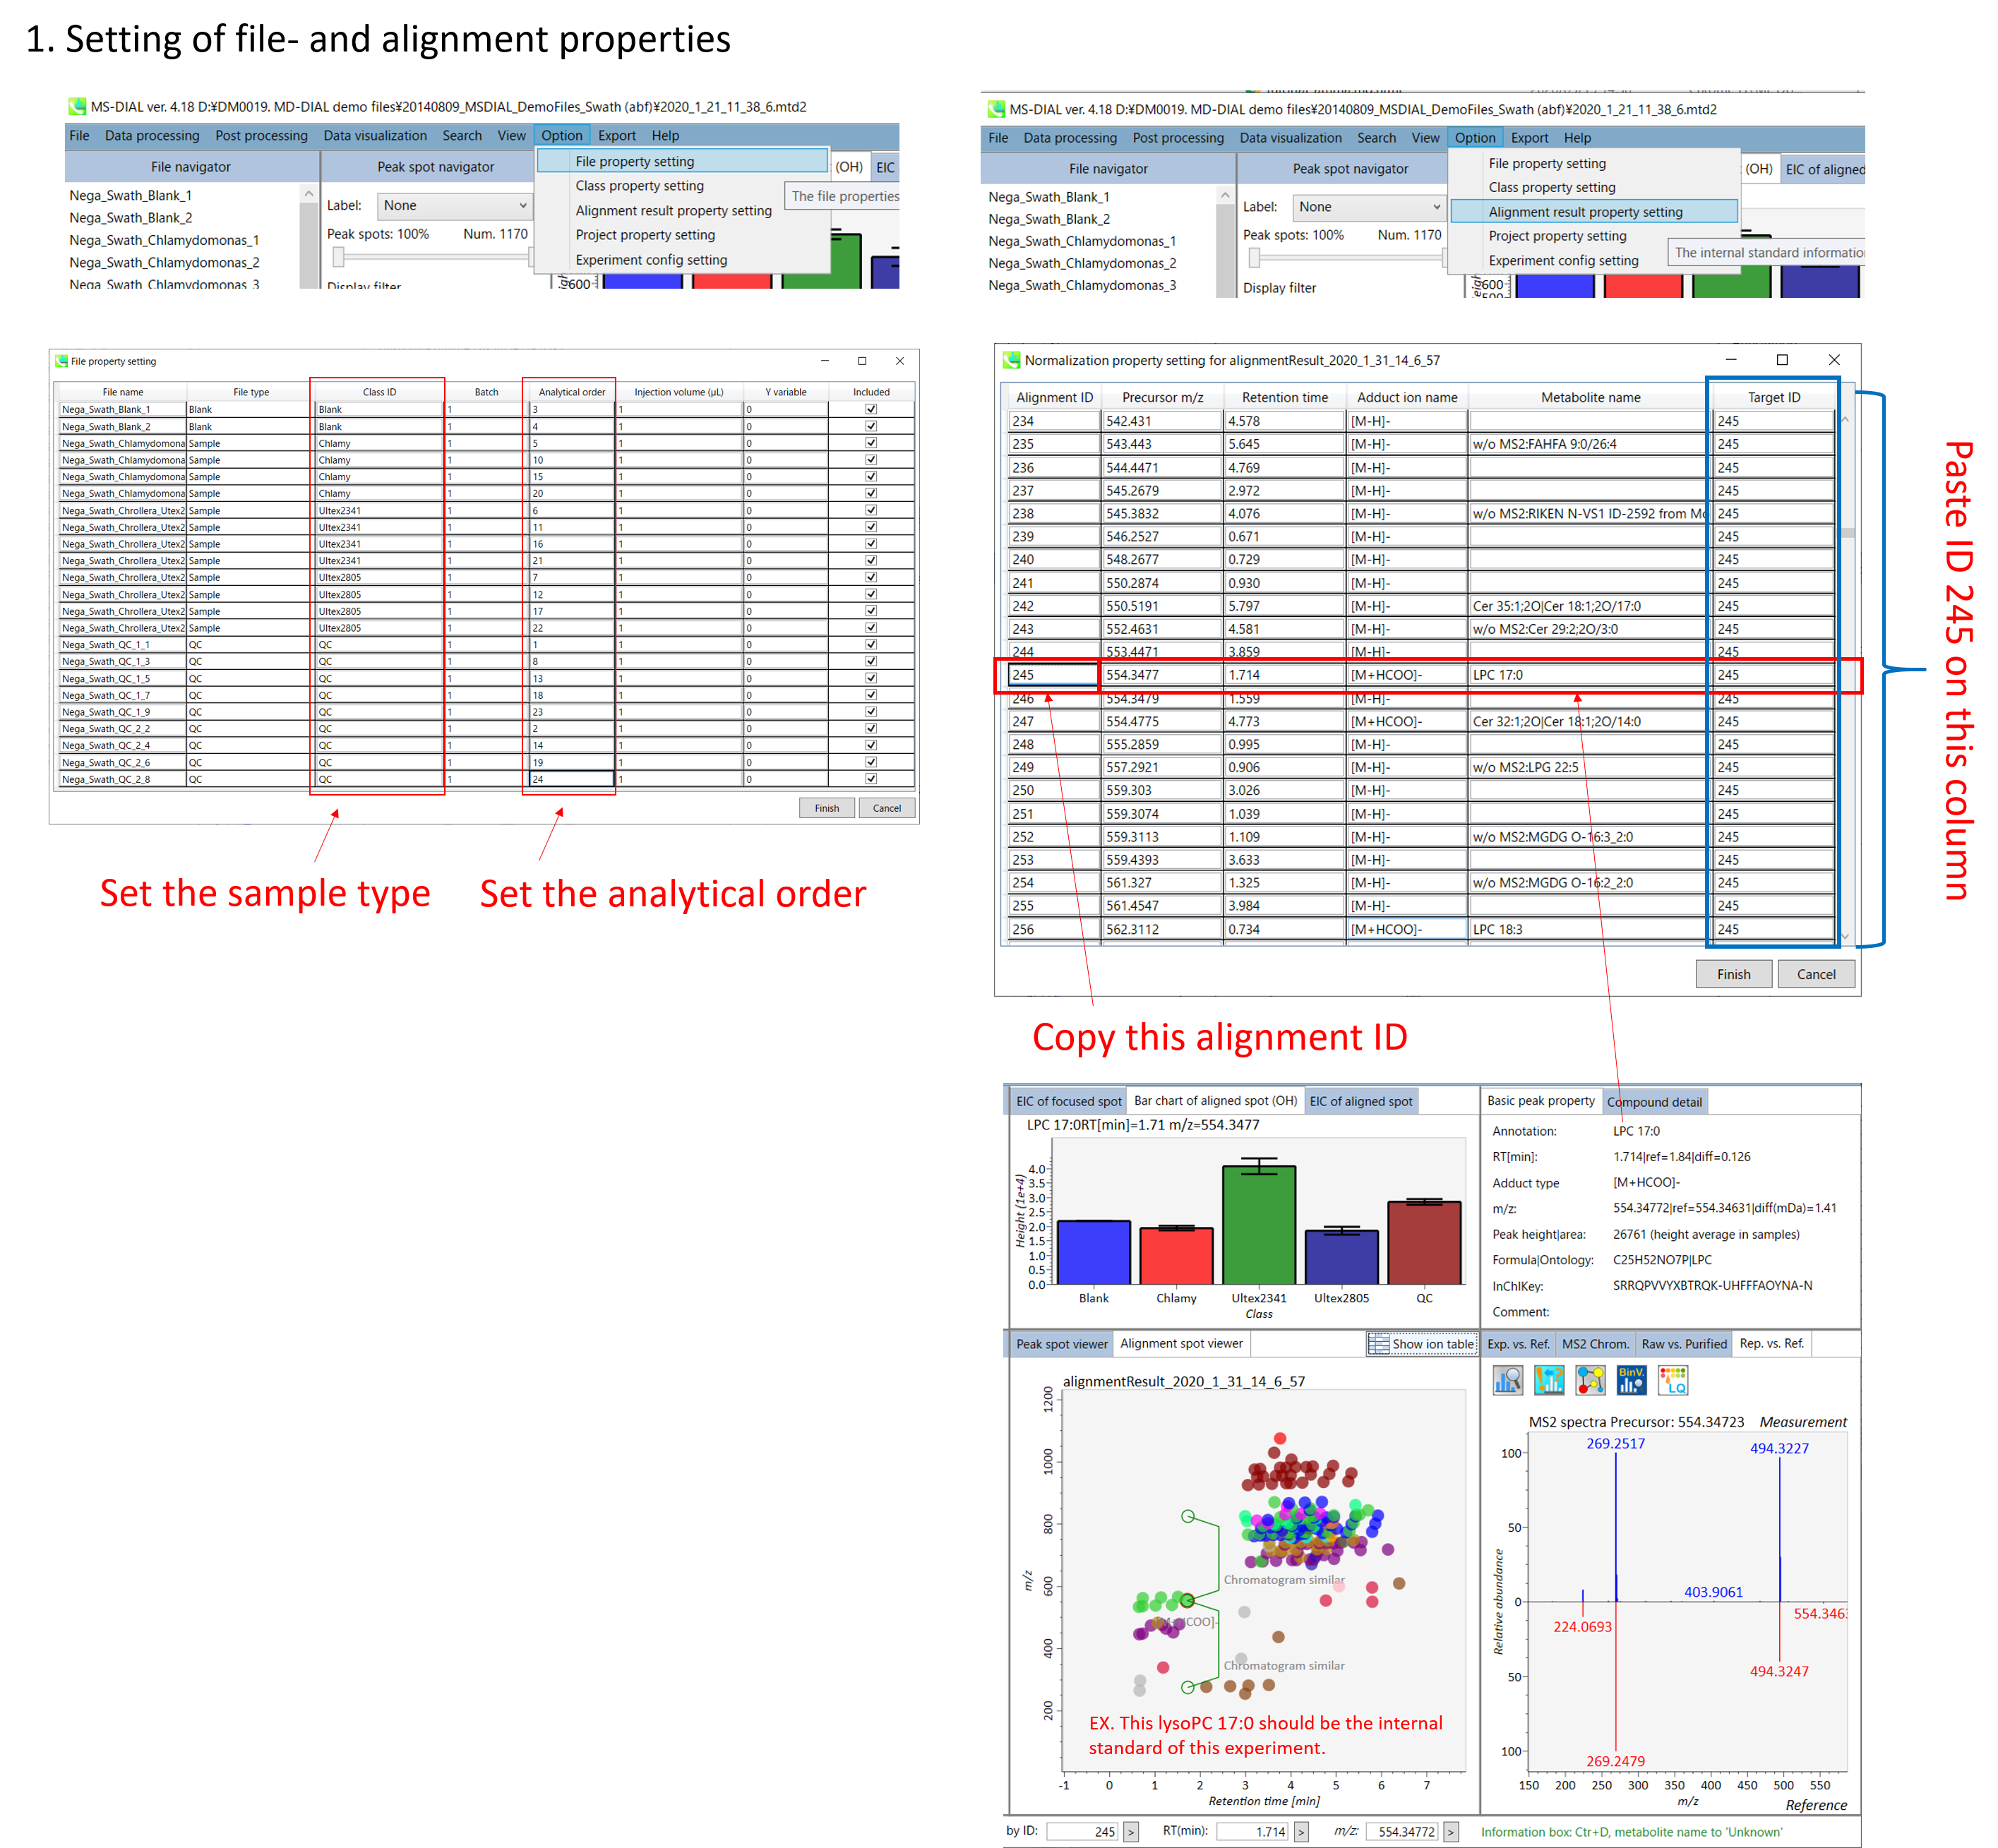
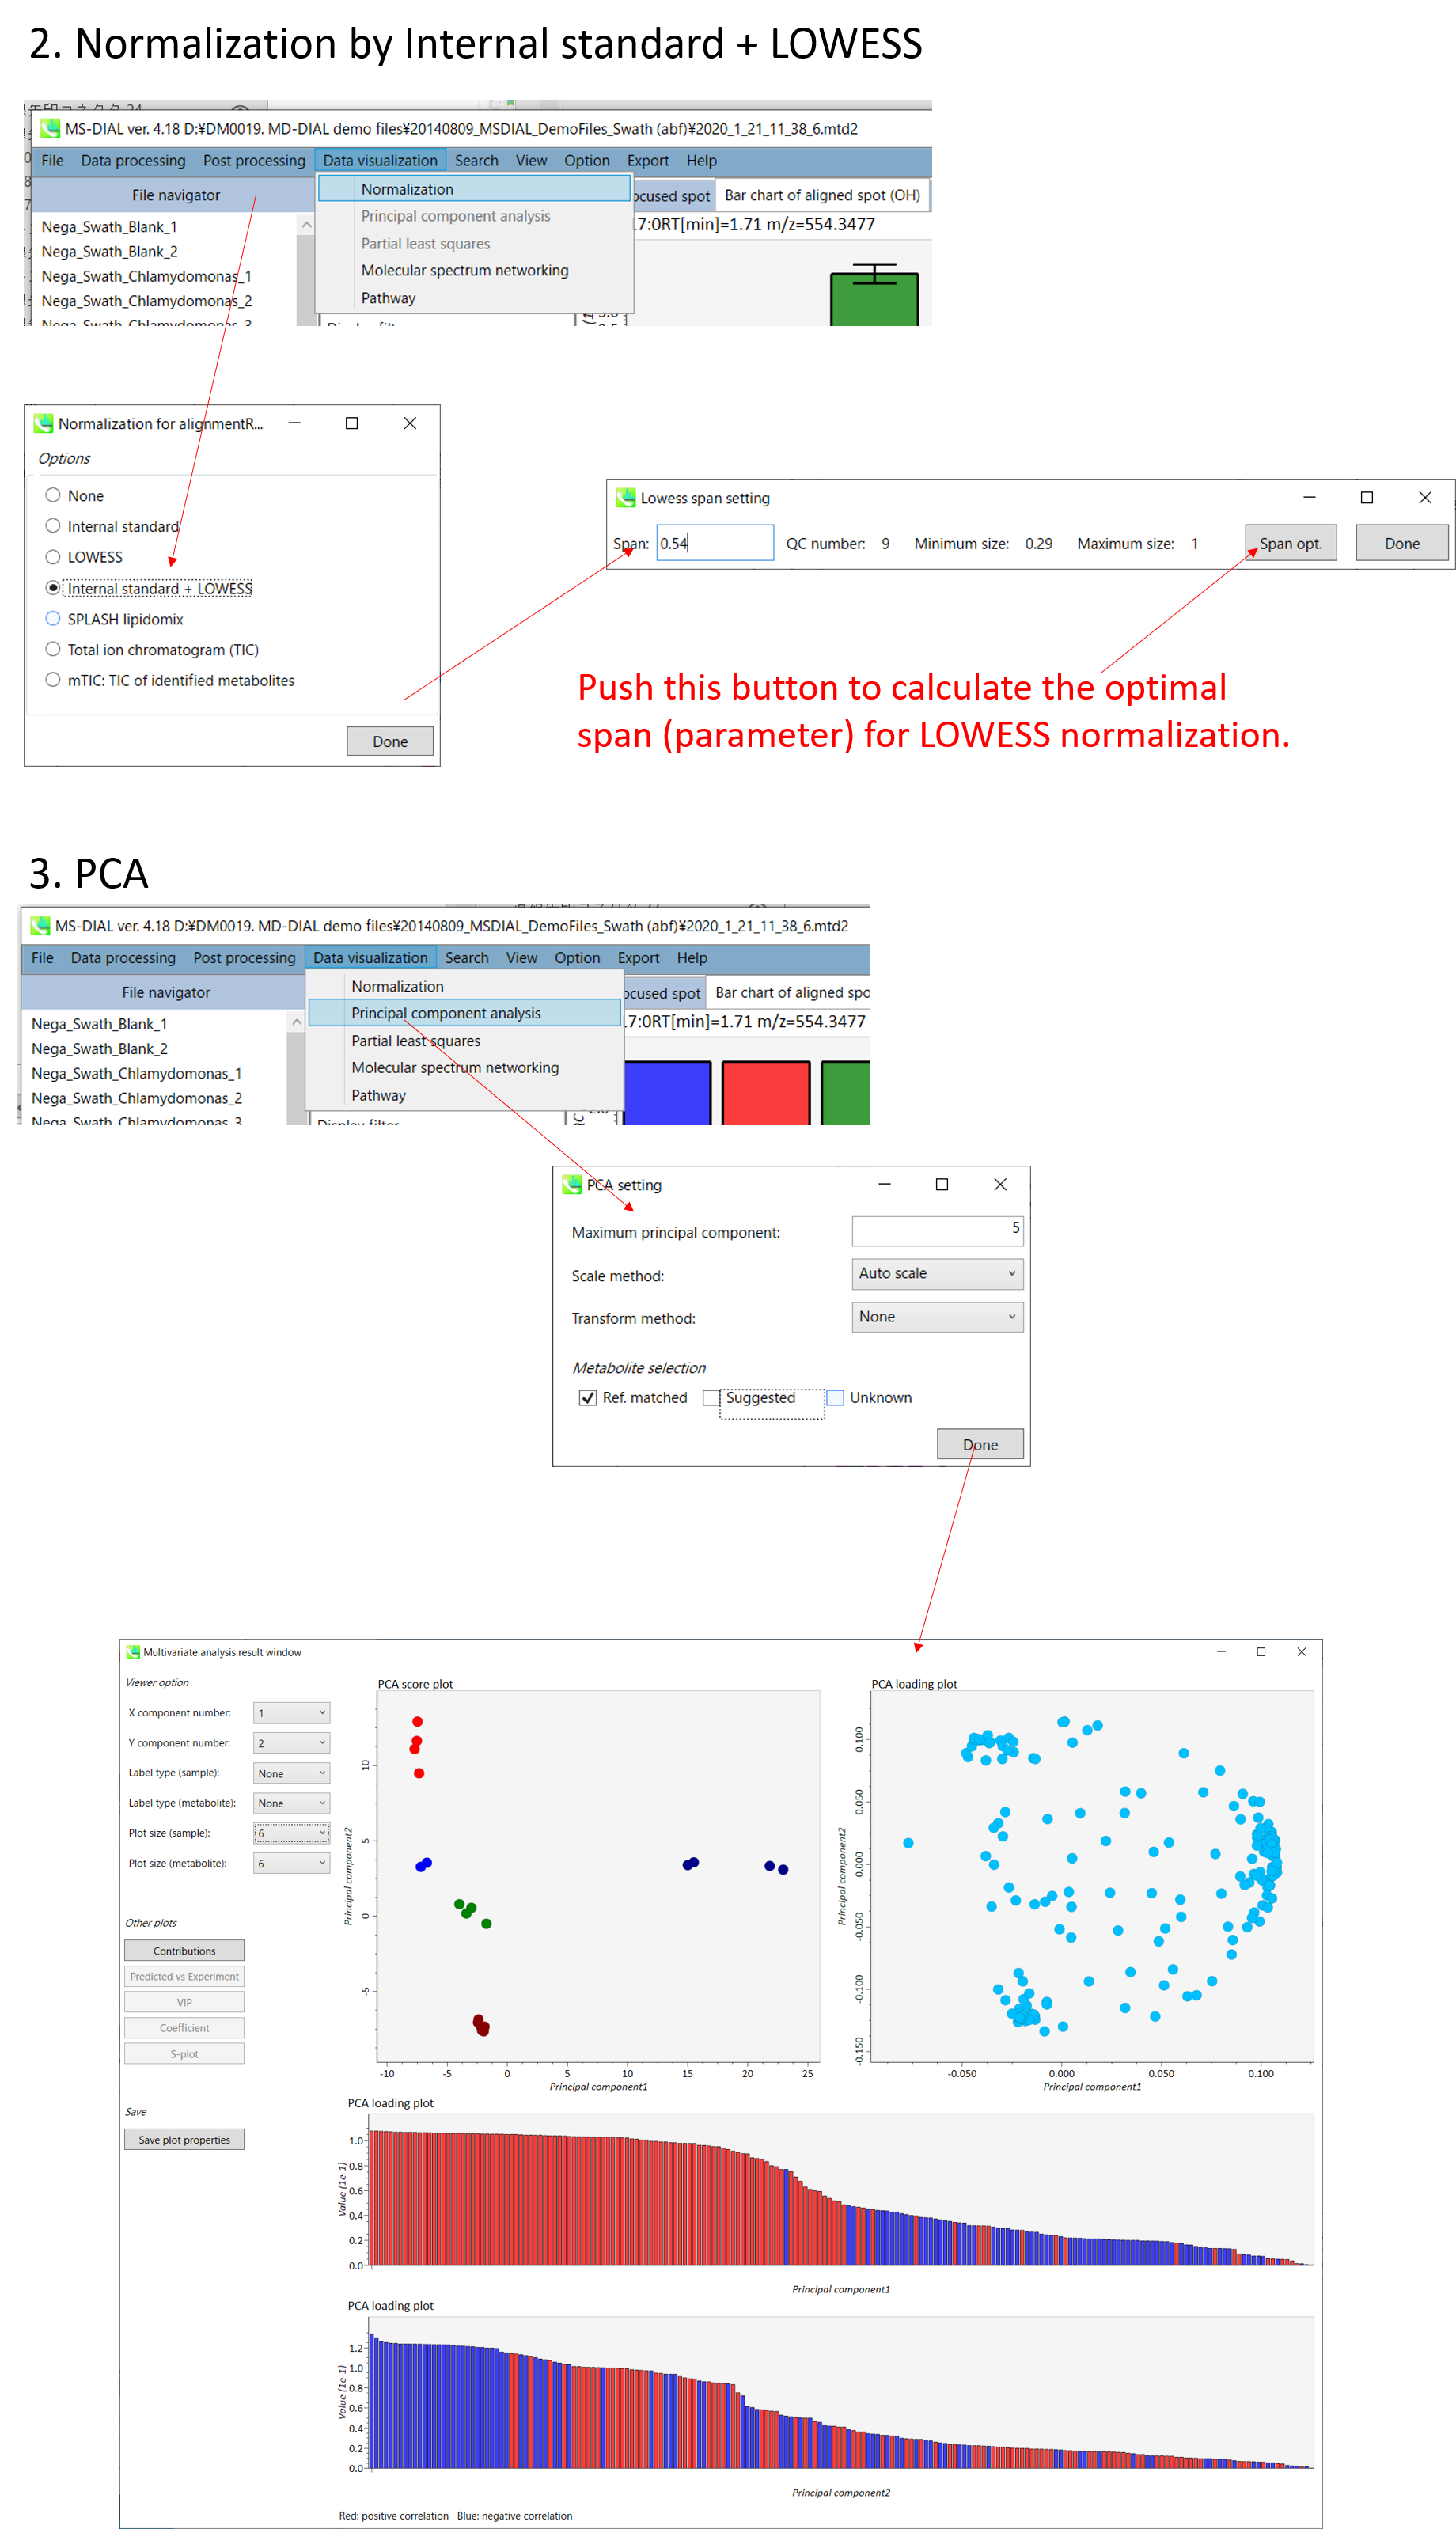
You can choose the metabolite data set from “Ref. matched”, “Suggested” and “Unknown”.
您可以从“参考匹配”、“建议”和“未知”中选择代谢物数据集。
Finally, click the Done button.
最后,单击“完成”按钮。
Output of the PCA
PCA的输出
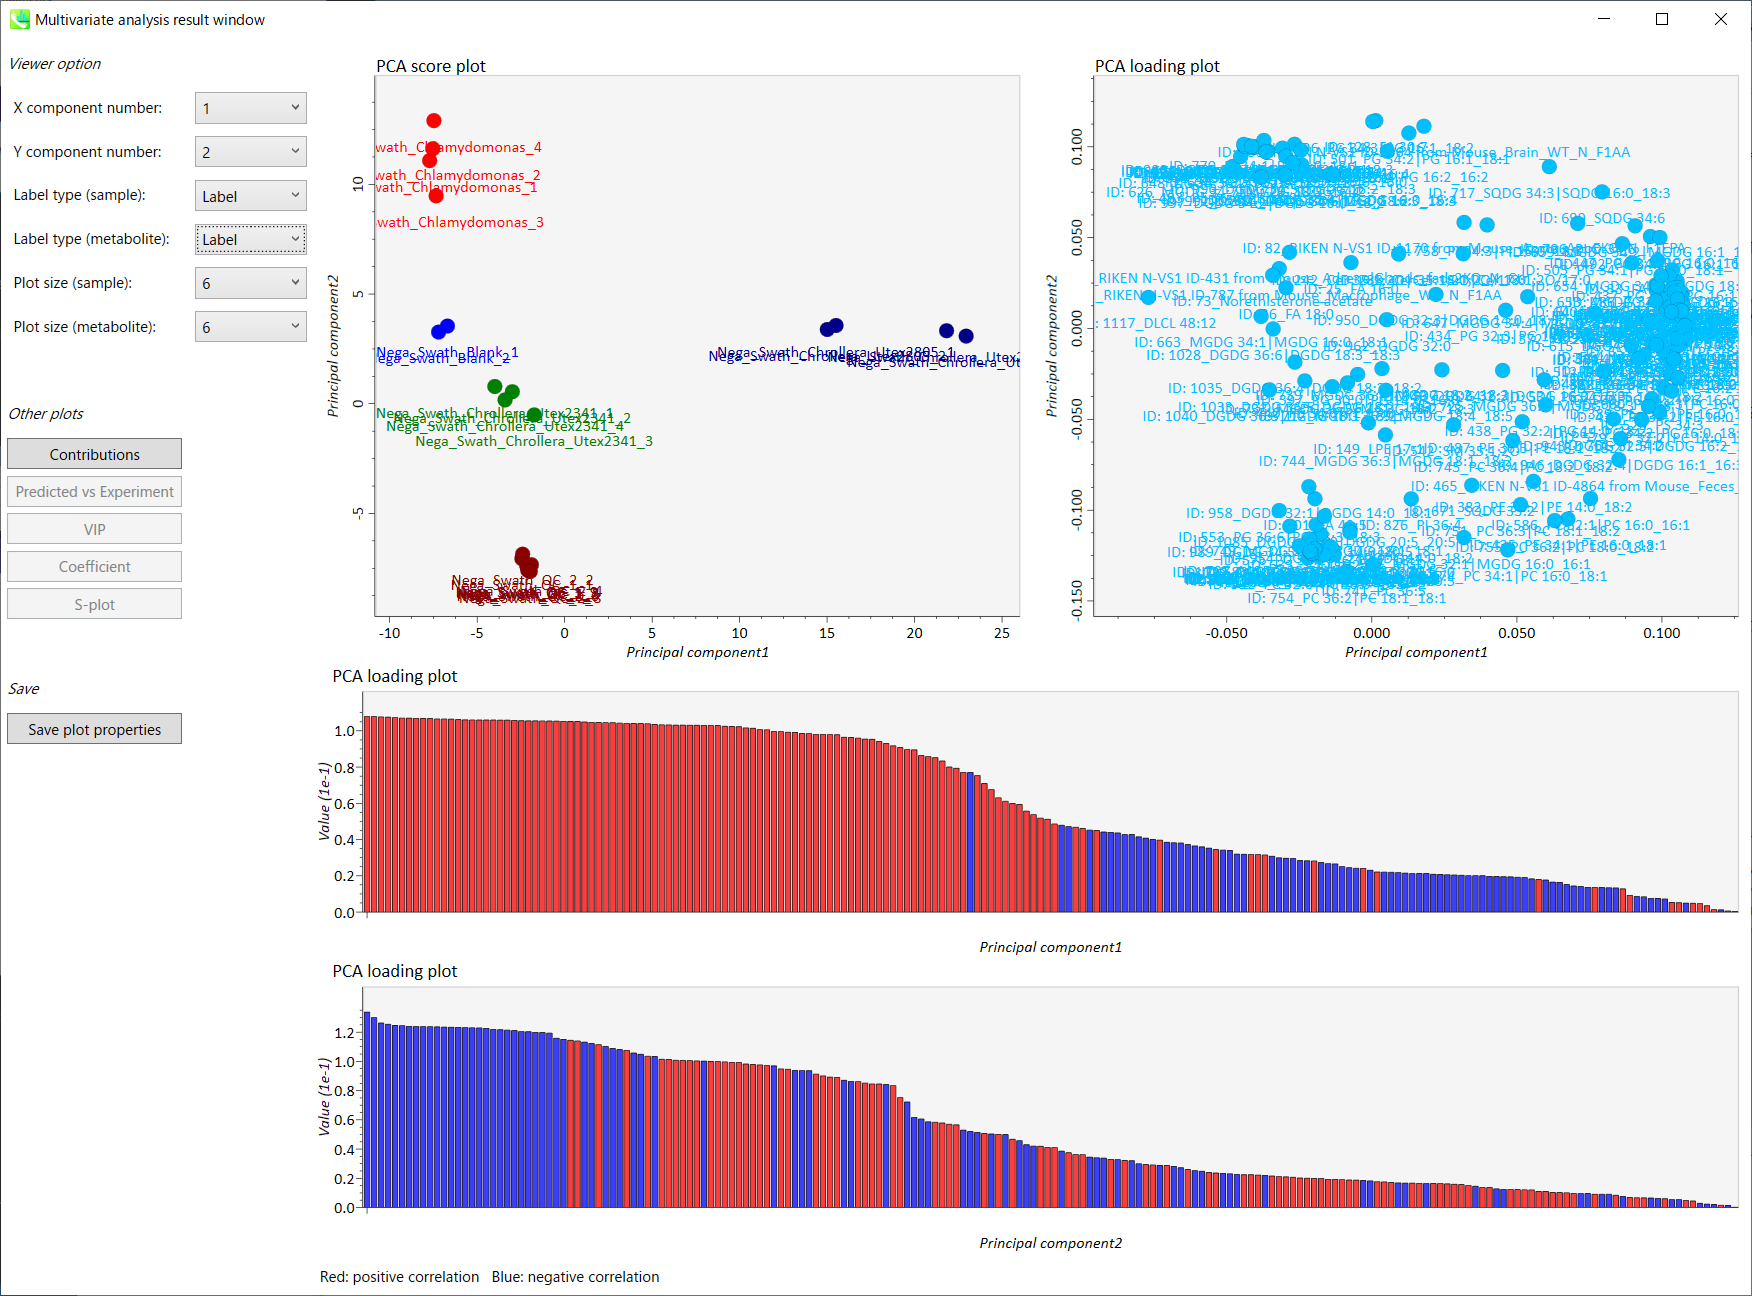
The left side of the upper row: PCA score plot
上行左侧:PCA评分图
The right side of the upper row: PCA loading plot
上行右侧:PCA加载图
The upper bar graph (lower low): PCA loading plot of principal component 1 (Red: positive correlation, Blue: negative correlation)
上条形图(下下):主成分 1 的 PCA 加载图(红色:正相关,蓝色:负相关)
The lower bar graph (lower low): PCA loading plot of principal component 2 (Red: positive correlation, Blue: negative correlation)
下条形图(下下):主成分 2 的 PCA 加载图(红色:正相关,蓝色:负相关)
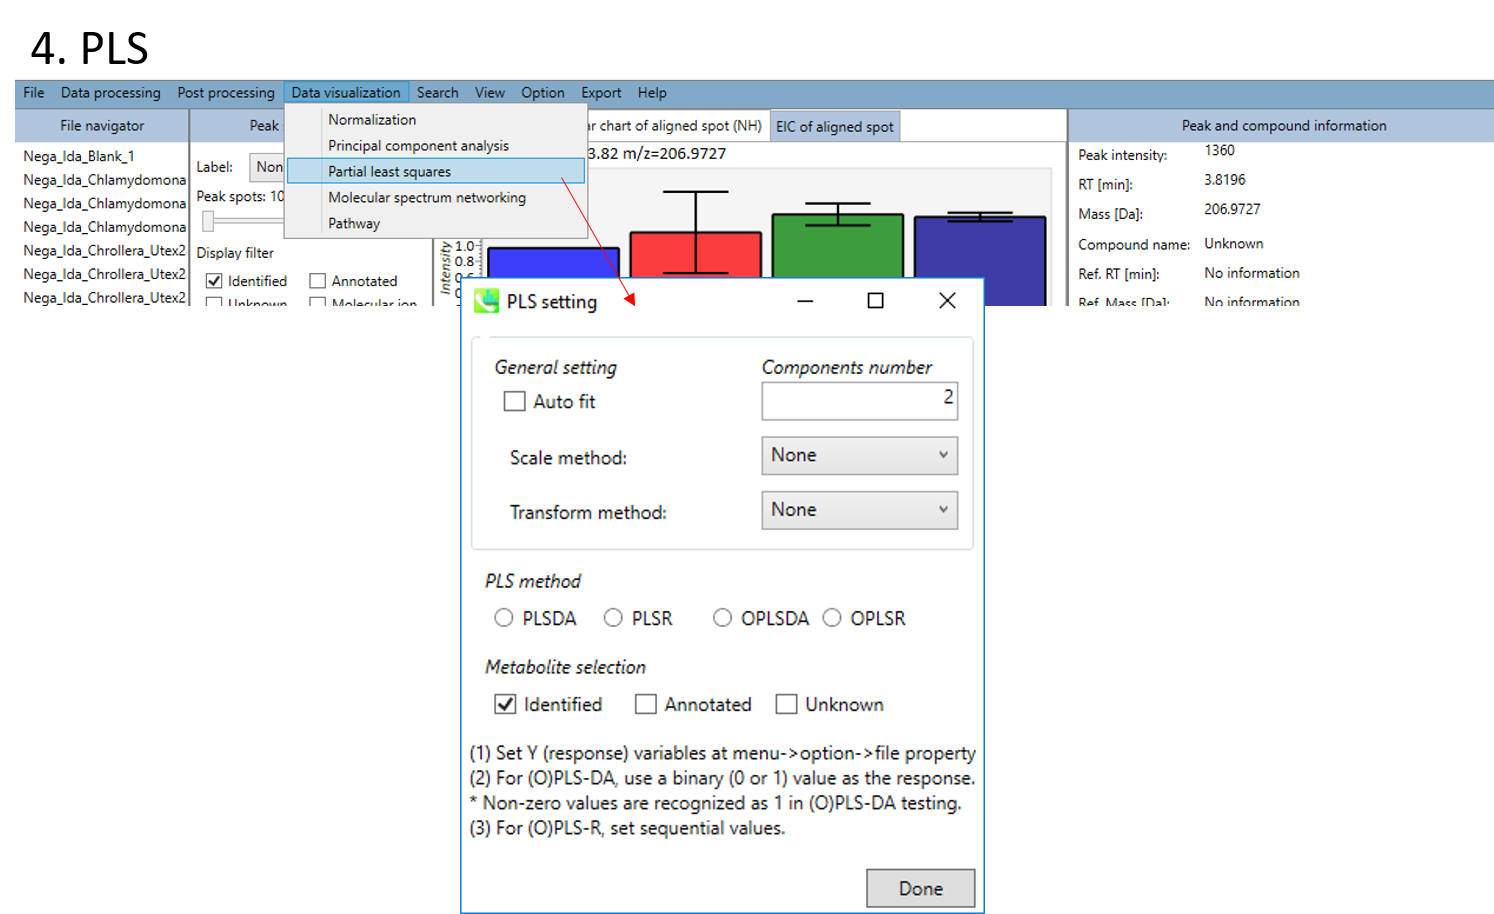
You can choose the method of PLS or OPLS (DA: discriminant analysis, R: regression analysis).
您可以选择PLS或OPLS(DA:判别分析,R:回归分析)的方法。
You can choose the metabolite data set from “Identified”, “Annotated” and “Unknown”.
您可以从“已鉴定”、“注释”和“未知”中选择代谢物数据集。
Finally, click the Done button.
最后,单击“完成”按钮。
! File setting for PLS before analyses
!分析前PLS的文件设置
Set Y (response) variables at menu -> Option -> File property setting
设置 Y(响应)变量和菜单 -> 选项 -> 文件属性设置
For (O)PLS-DA, use a binary (0 or 1) value as the response. Non-zero values are recognized as 1 in (O)PLS-DA testing.
对于 (O)PLS-DA,使用二进制(0 或 1)值作为响应。在 (O)PLS-DA 测试中,非零值被识别为 1。
For (O)PLS-R, set sequential values.
对于 (O)PLS-R,设置顺序值。
Output of the PLS
PLS的输出
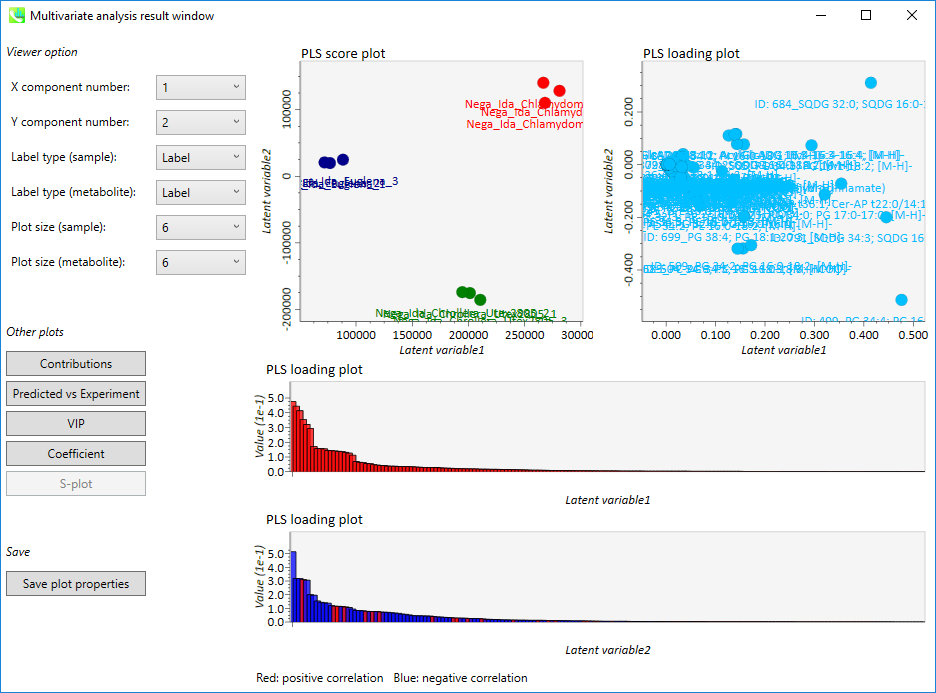
The left side of the upper row: PLS score plot
上行左侧:PLS分数图
The right side of the upper row: PLS loading plot
上行右侧:PLS加载图
The upper bar graph (lower low): PLS loading plot of principal component 1 (Red: positive correlation, Blue: negative correlation)
上条形图(下图):主成分 1 的 PLS 加载图(红色:正相关,蓝色:负相关)
The lower bar graph (lower low): PLS loading plot of principal component 2 (Red: positive correlation, Blue: negative correlation)
下条形图(下低):主成分 2 的 PLS 加载图(红色:正相关,蓝色:负相关)
Section 5-6 第5-6节
Export 出口
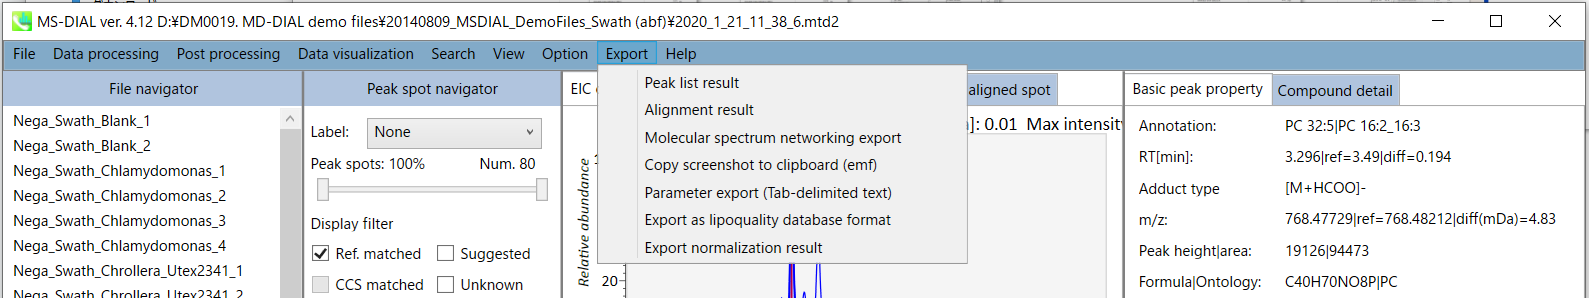 A) Peak list export
A) 峰值列表导出
B) Alignment result export
B) 对齐结果导出
C) Molecular spectrum networking export
C) 分子谱网络导出
D) Copy screenshot to clipboard (emf)
D) 将屏幕截图复制到剪贴板 (emf)
E) Parameter export (Tab-delimited text) F) Export as lipoquality database format
E) 参数导出(制表符分隔文本) F) 导出为脂质数据库格式
G) Export normalization result
G) 导出归一化结果
A) Peak list export: You can get the peak list information of each sample including retention time, m/z, MS/MS spectra information, and so on. Available formats are MSP, MGF or Text.
A) 峰列表导出:可以获取每个样品的峰列表信息,包括保留时间、m/z、MS/MS谱图信息等。可用的格式包括 MSP、MGF 或文本。
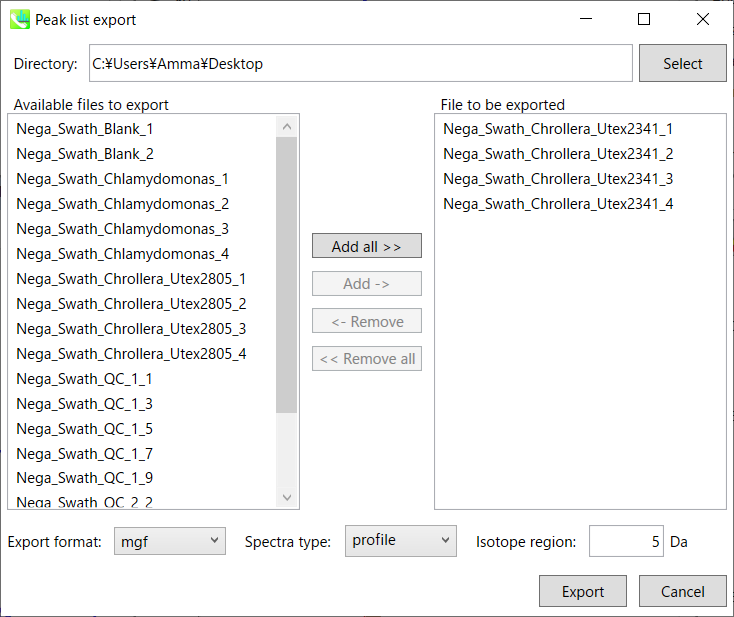
Step1. Choose an export folder path.
第1步。选择导出文件夹路径。
Step2. Choose files which you want to export and click button “Add ->”.
第2步。选择要导出的文件,然后单击“添加->”按钮。
Step3. Select export format.
第3步。选择导出格式。
Step4. Click the export button.
第4步。单击导出按钮。
B) Alignment result export: You can get data matrix or spectral information.
B) 对准结果导出:可以获取数据矩阵或光谱信息。
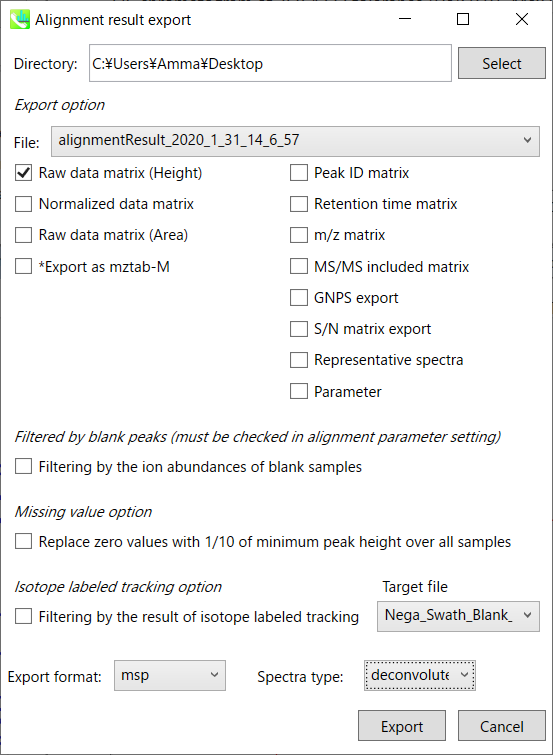
Step1. Choose an export folder path.
第1步。选择导出文件夹路径。
Step2. Choose an alignment file which you want to export.
第2步。选择要导出的对齐文件。
Step3. Select export format if you want to export the representative spectra.
第3步。如果要导出具有代表性的光谱,请选择导出格式。
Step4. Click the export button.
第4步。单击导出按钮。
Section 5-7 第5-7节
Save 救
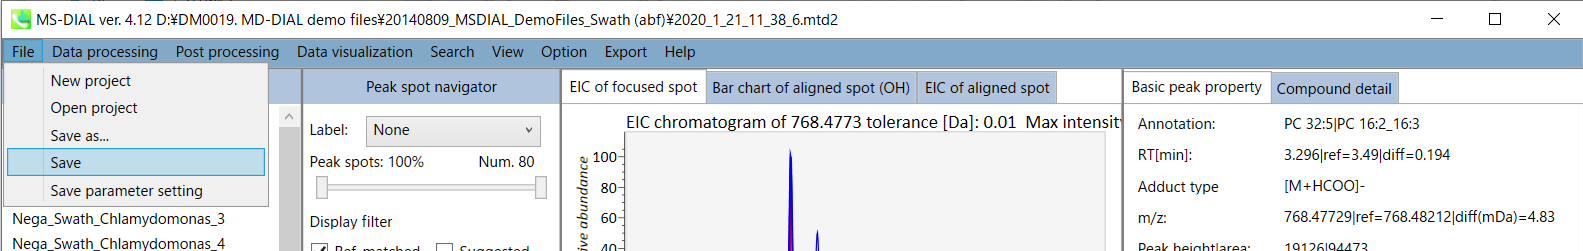
Your project is managed in MTD file. Although your project is saved automatically whenever you do the data processing method, this program is not saved after your manual modification such as the curation of identification result, internal standard setting, and file or class information setting. Therefore, you have to save your project from this option after your modification.
您的项目在 MTD 文件中进行管理。虽然每当您进行数据处理方法时,您的项目都会自动保存,但在您手动修改后,例如识别结果的整理、内部标准设置以及文件或类信息设置,该程序不会保存。因此,您必须在修改后从此选项保存您的项目。
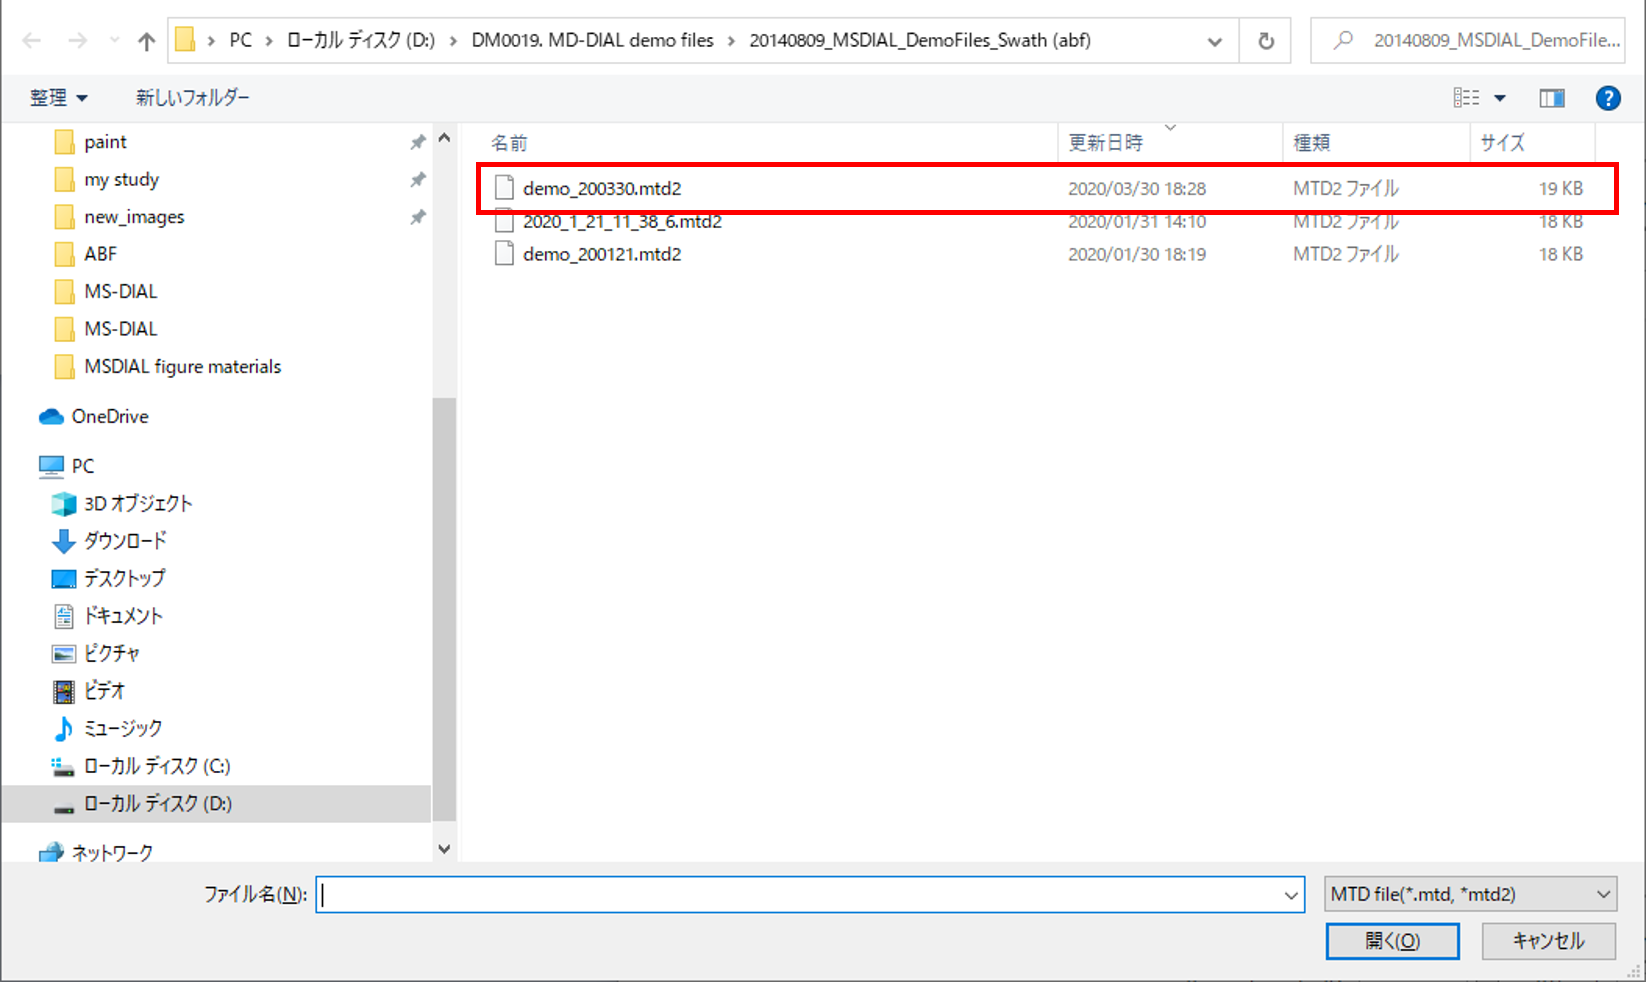
Your data processing parameter can be saved as MED format file. When you want to use your method file for your data processing method, select your MED format file in the data processing setting.
您的数据处理参数可以保存为 MED 格式文件。如果要将方法文件用于数据处理方法,请在数据处理设置中选择 MED 格式文件。
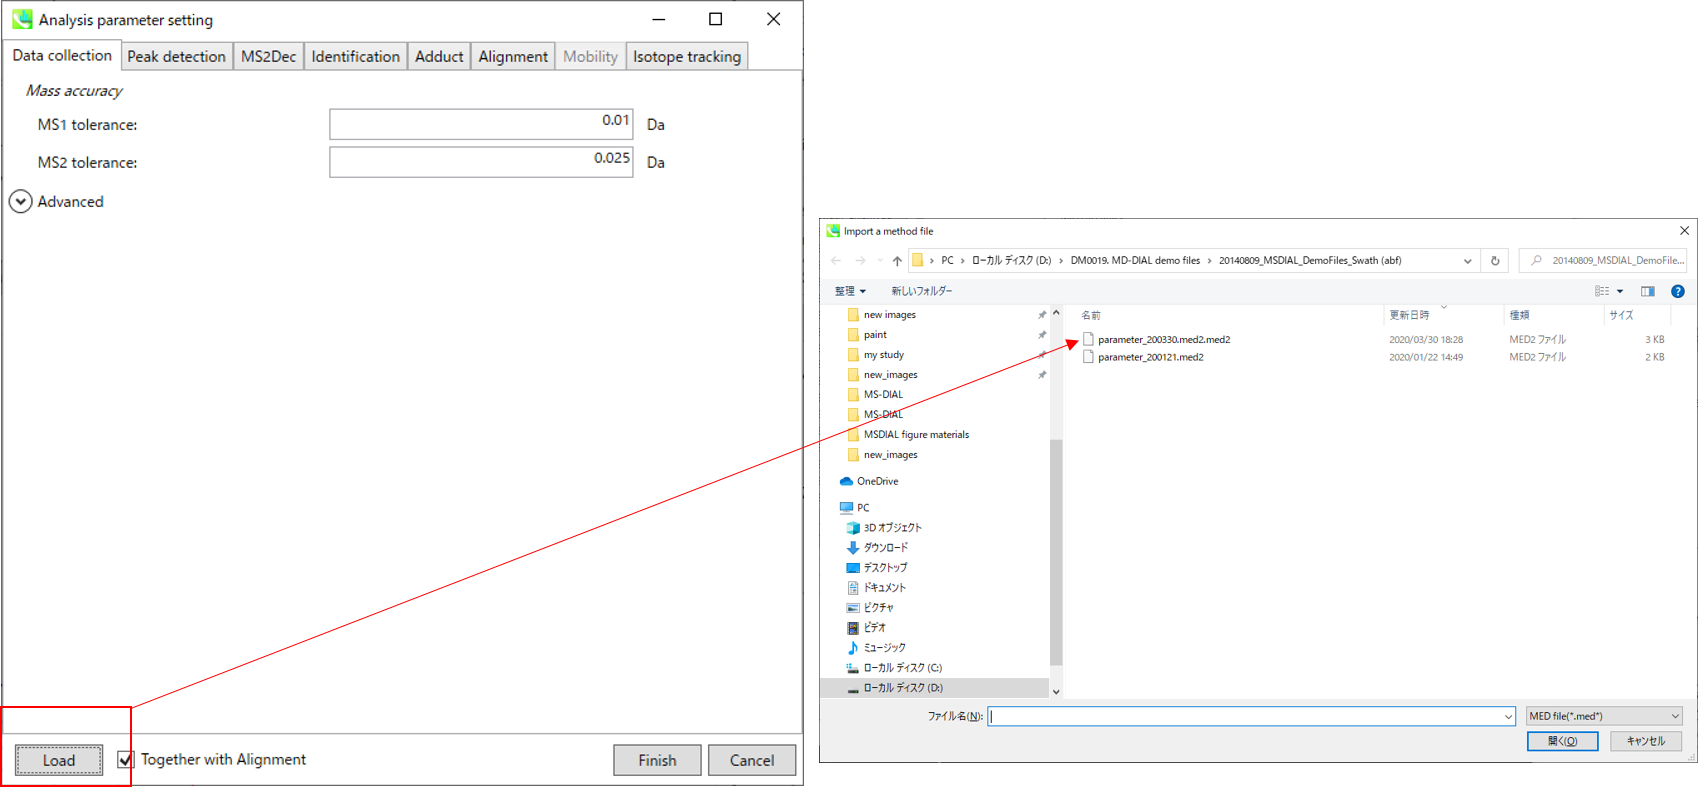
Section 5-8 第5-8节
Open 打开
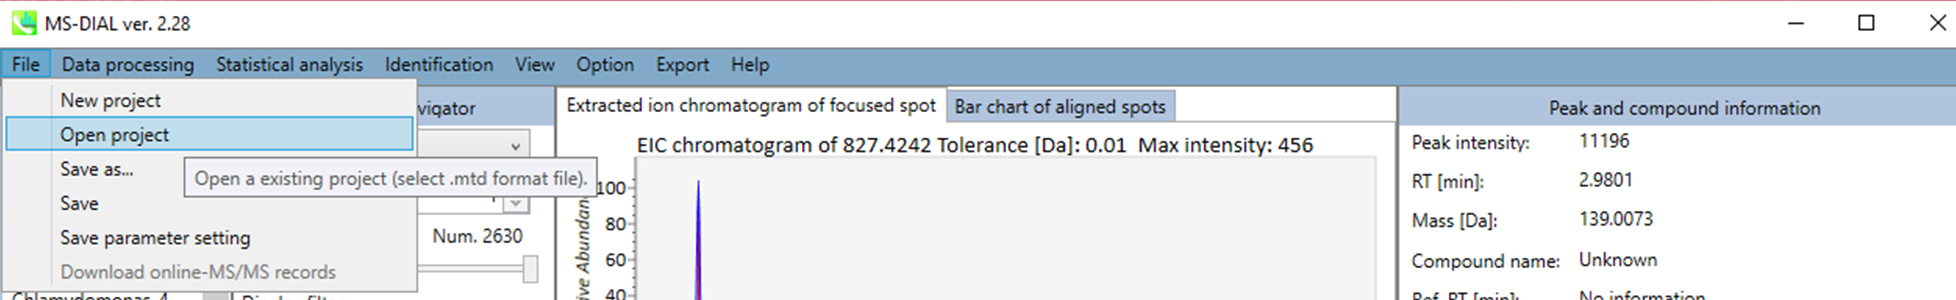
The project file is saved as MTD file format automatically whenever you perform data processing method. The manual save is described in section 5-7. You can re-start your project from the MTB file. The manual curation of peak identification result is highly recommended. In addition, the manual annotation can be set from Identification menu.
每当您执行数据处理方法时,项目文件都会自动保存为MTD文件格式。手动保存在第 5-7 节中描述。您可以从 MTB 文件重新启动项目。强烈建议手动管理峰鉴定结果。此外,还可以从“识别”菜单中设置手动注释。
Section 5-9 第5-9节
Option 选择
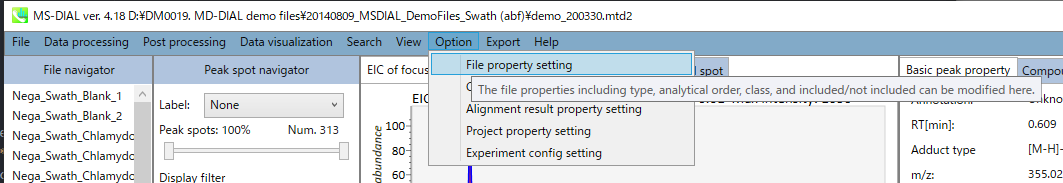
You can set properties of aligned peaks and files. In the file properties, you can reset file type, class ID, or analytical order (but not the file name). If you clear the check box of the “Included” column, the corresponding data are no longer used in the statistical analysis. In the alignment properties, you can set internal standard information for each aligned peak. Please make sure to assign “alignment ID” in the “internal standard” column.
您可以设置对齐峰和文件的属性。在文件属性中,可以重置文件类型、类 ID 或分析顺序(但不能重置文件名)。如果清除“包含”列的复选框,则统计分析中将不再使用相应的数据。在比对属性中,您可以为每个比对峰设置内标信息。请确保在“内标”列中分配“对齐 ID”。
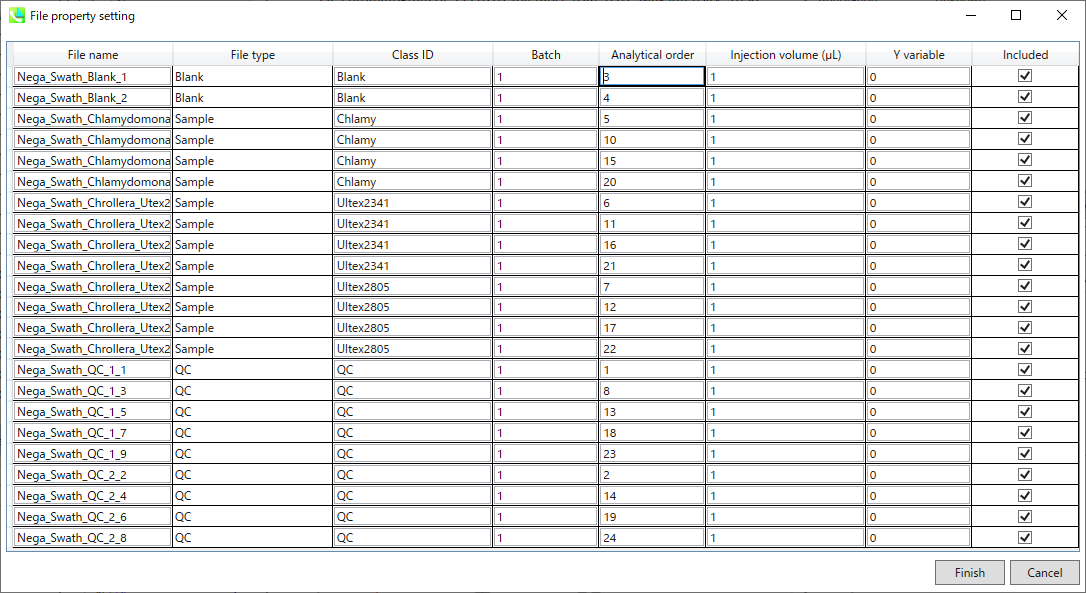
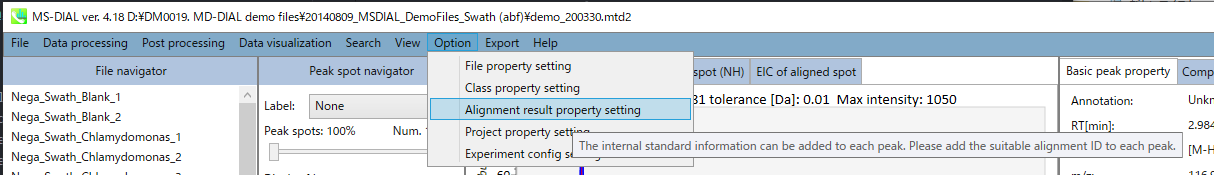
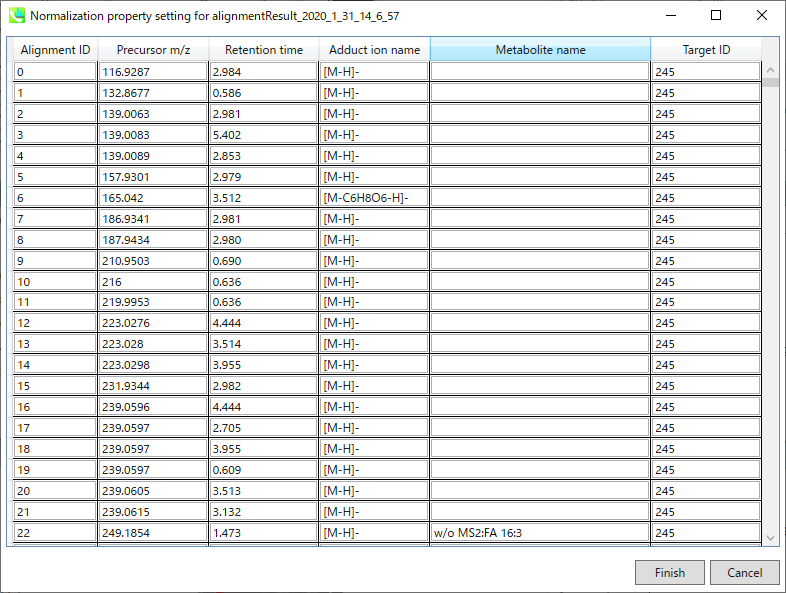
Section 5-10 第5-10节
Chromatogram viewers 色谱图查看器
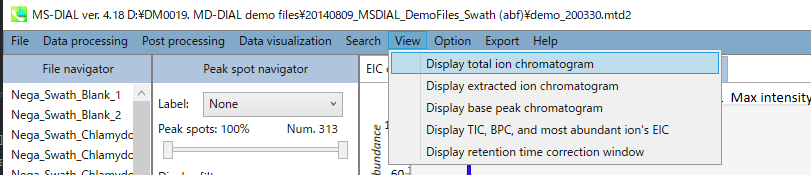
Display total ion chromatogram: You can see the total ion chromatogram of the focused sample.
显示总离子色谱图:您可以看到聚焦样品的总离子色谱图。
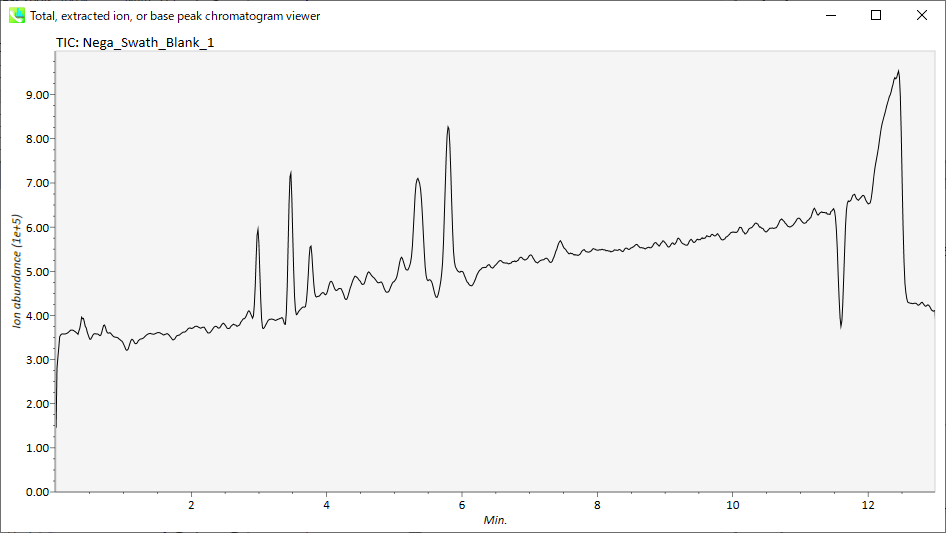
Display extracted ion chromatogram: You can see the extracted ion chromatograms which you want to display for the focused sample.
显示提取的离子色谱图:您可以看到要为聚焦样品显示的提取离子色谱图。
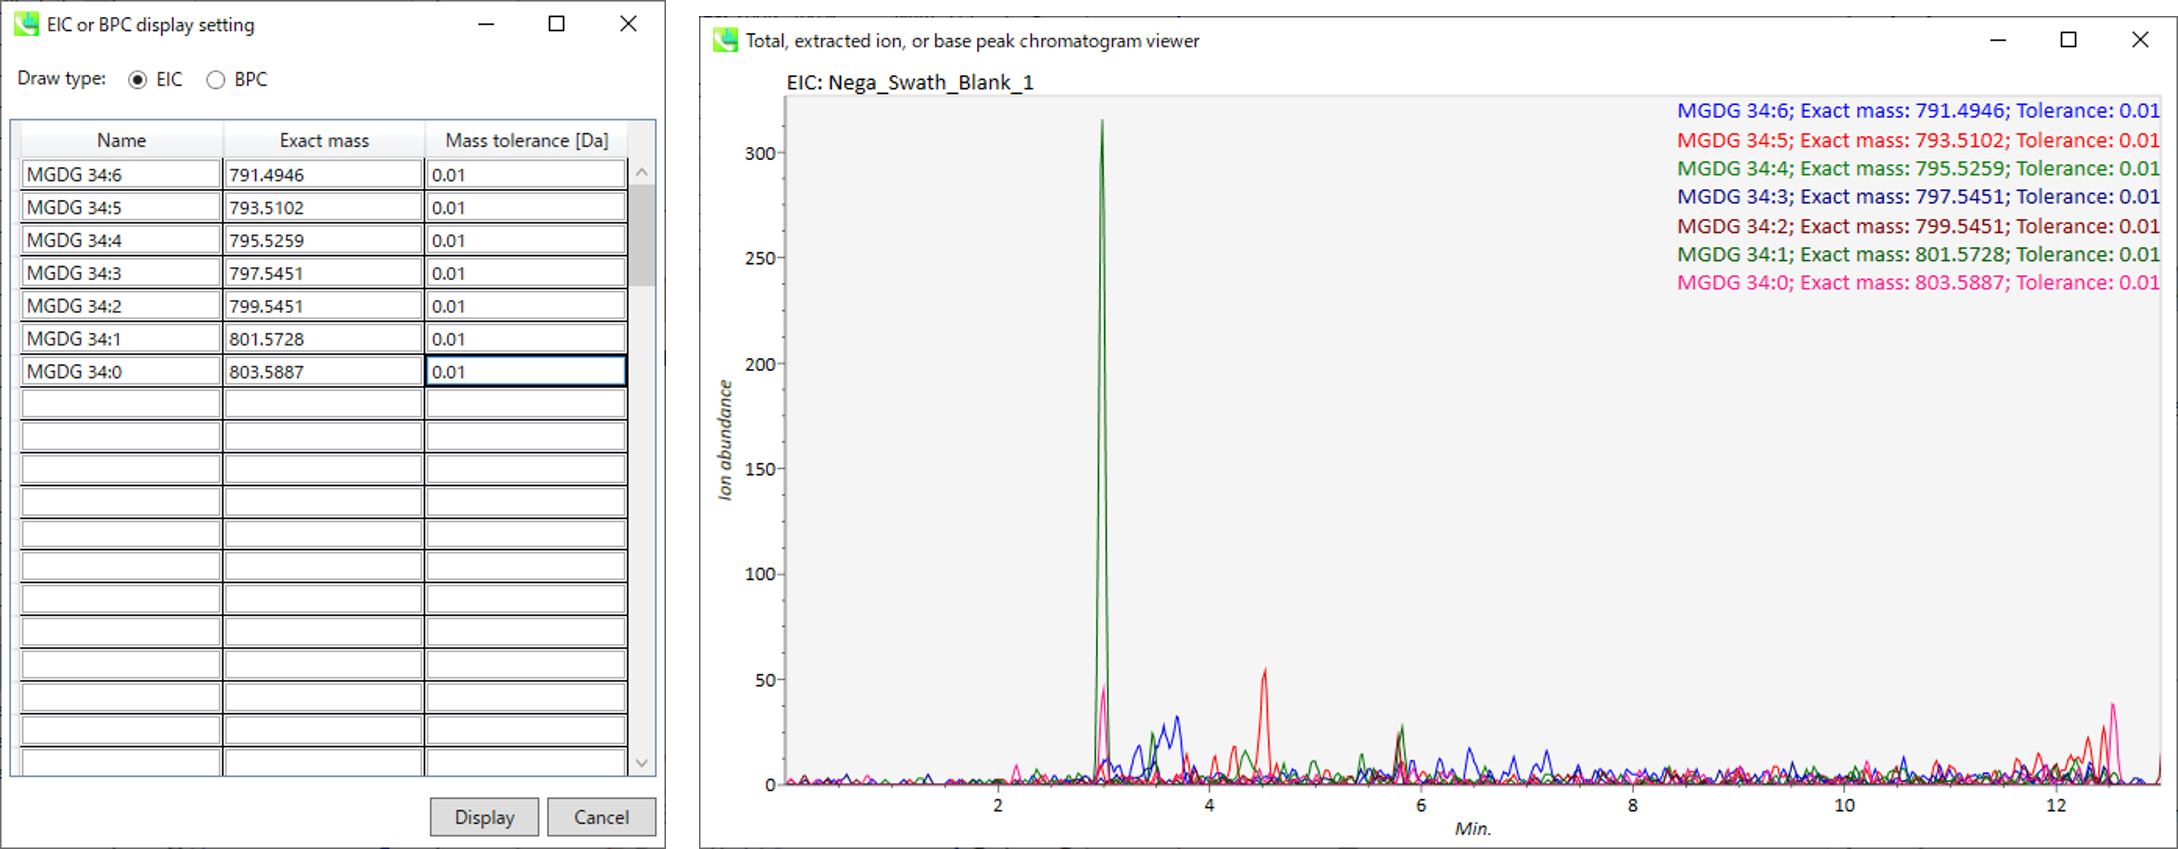
Section 5-11 第5-11节
Explanation of buttons and tabs of MS-DIAL
MS-DIAL 的按钮和选项卡说明
Section 5-11-1 第 5-11-1 节
Display filters 显示过滤器
Label: You can check the peak information such as retention time, accurate mass, metabolite name, adduct ion name and isotope ion in the center window of MS-DIAL. Shown below are examples.
标记:您可以在MS-DIAL的中心窗口中查看保留时间、准确质量数、代谢物名称、加合物离子名称和同位素离子等峰信息。下面是示例。
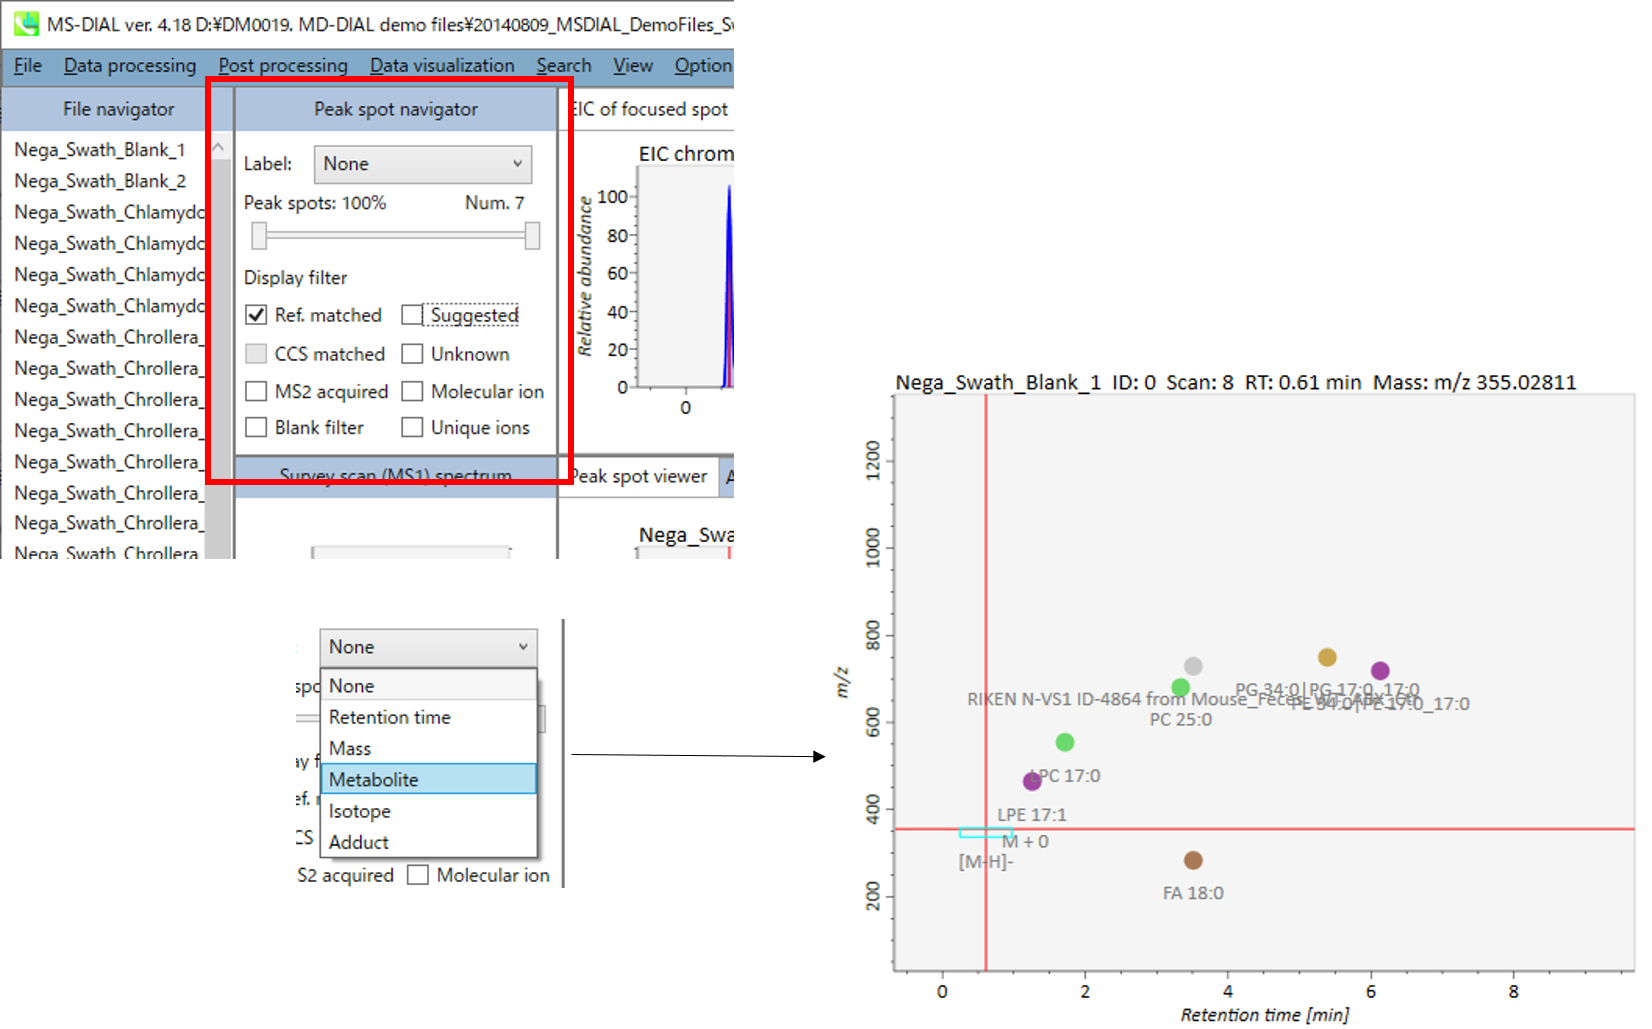
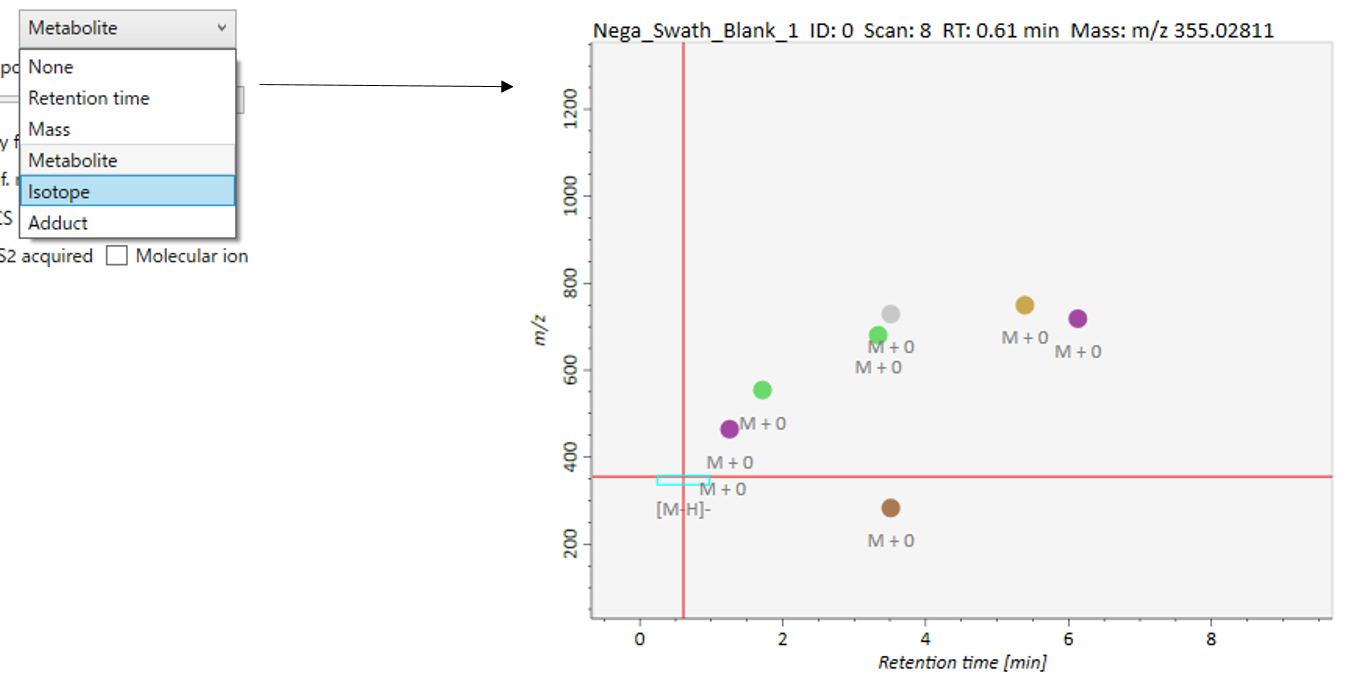
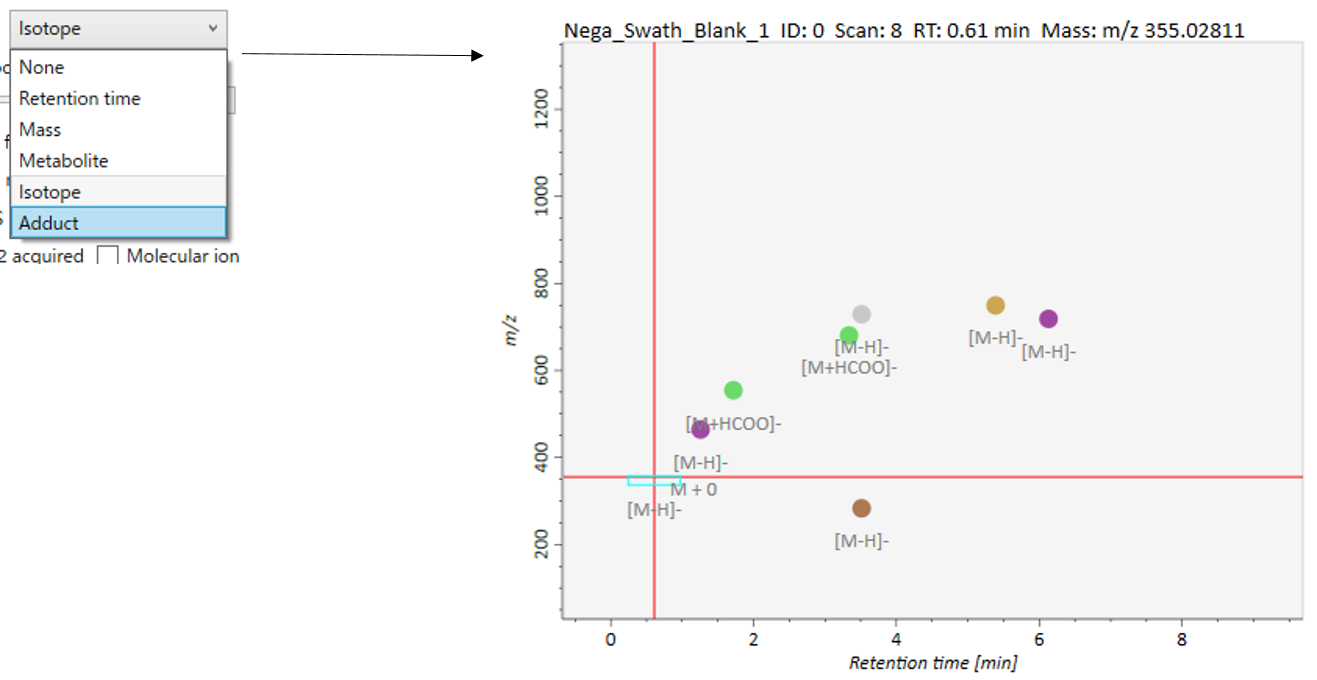
Peak spots: This filter is used to check the peak abundance. Each peak is assigned a rank with respect to its peak abundance in the focused sample.
峰斑:此过滤器用于检查峰丰度。每个峰都根据其在聚焦样品中的峰丰度分配一个等级。
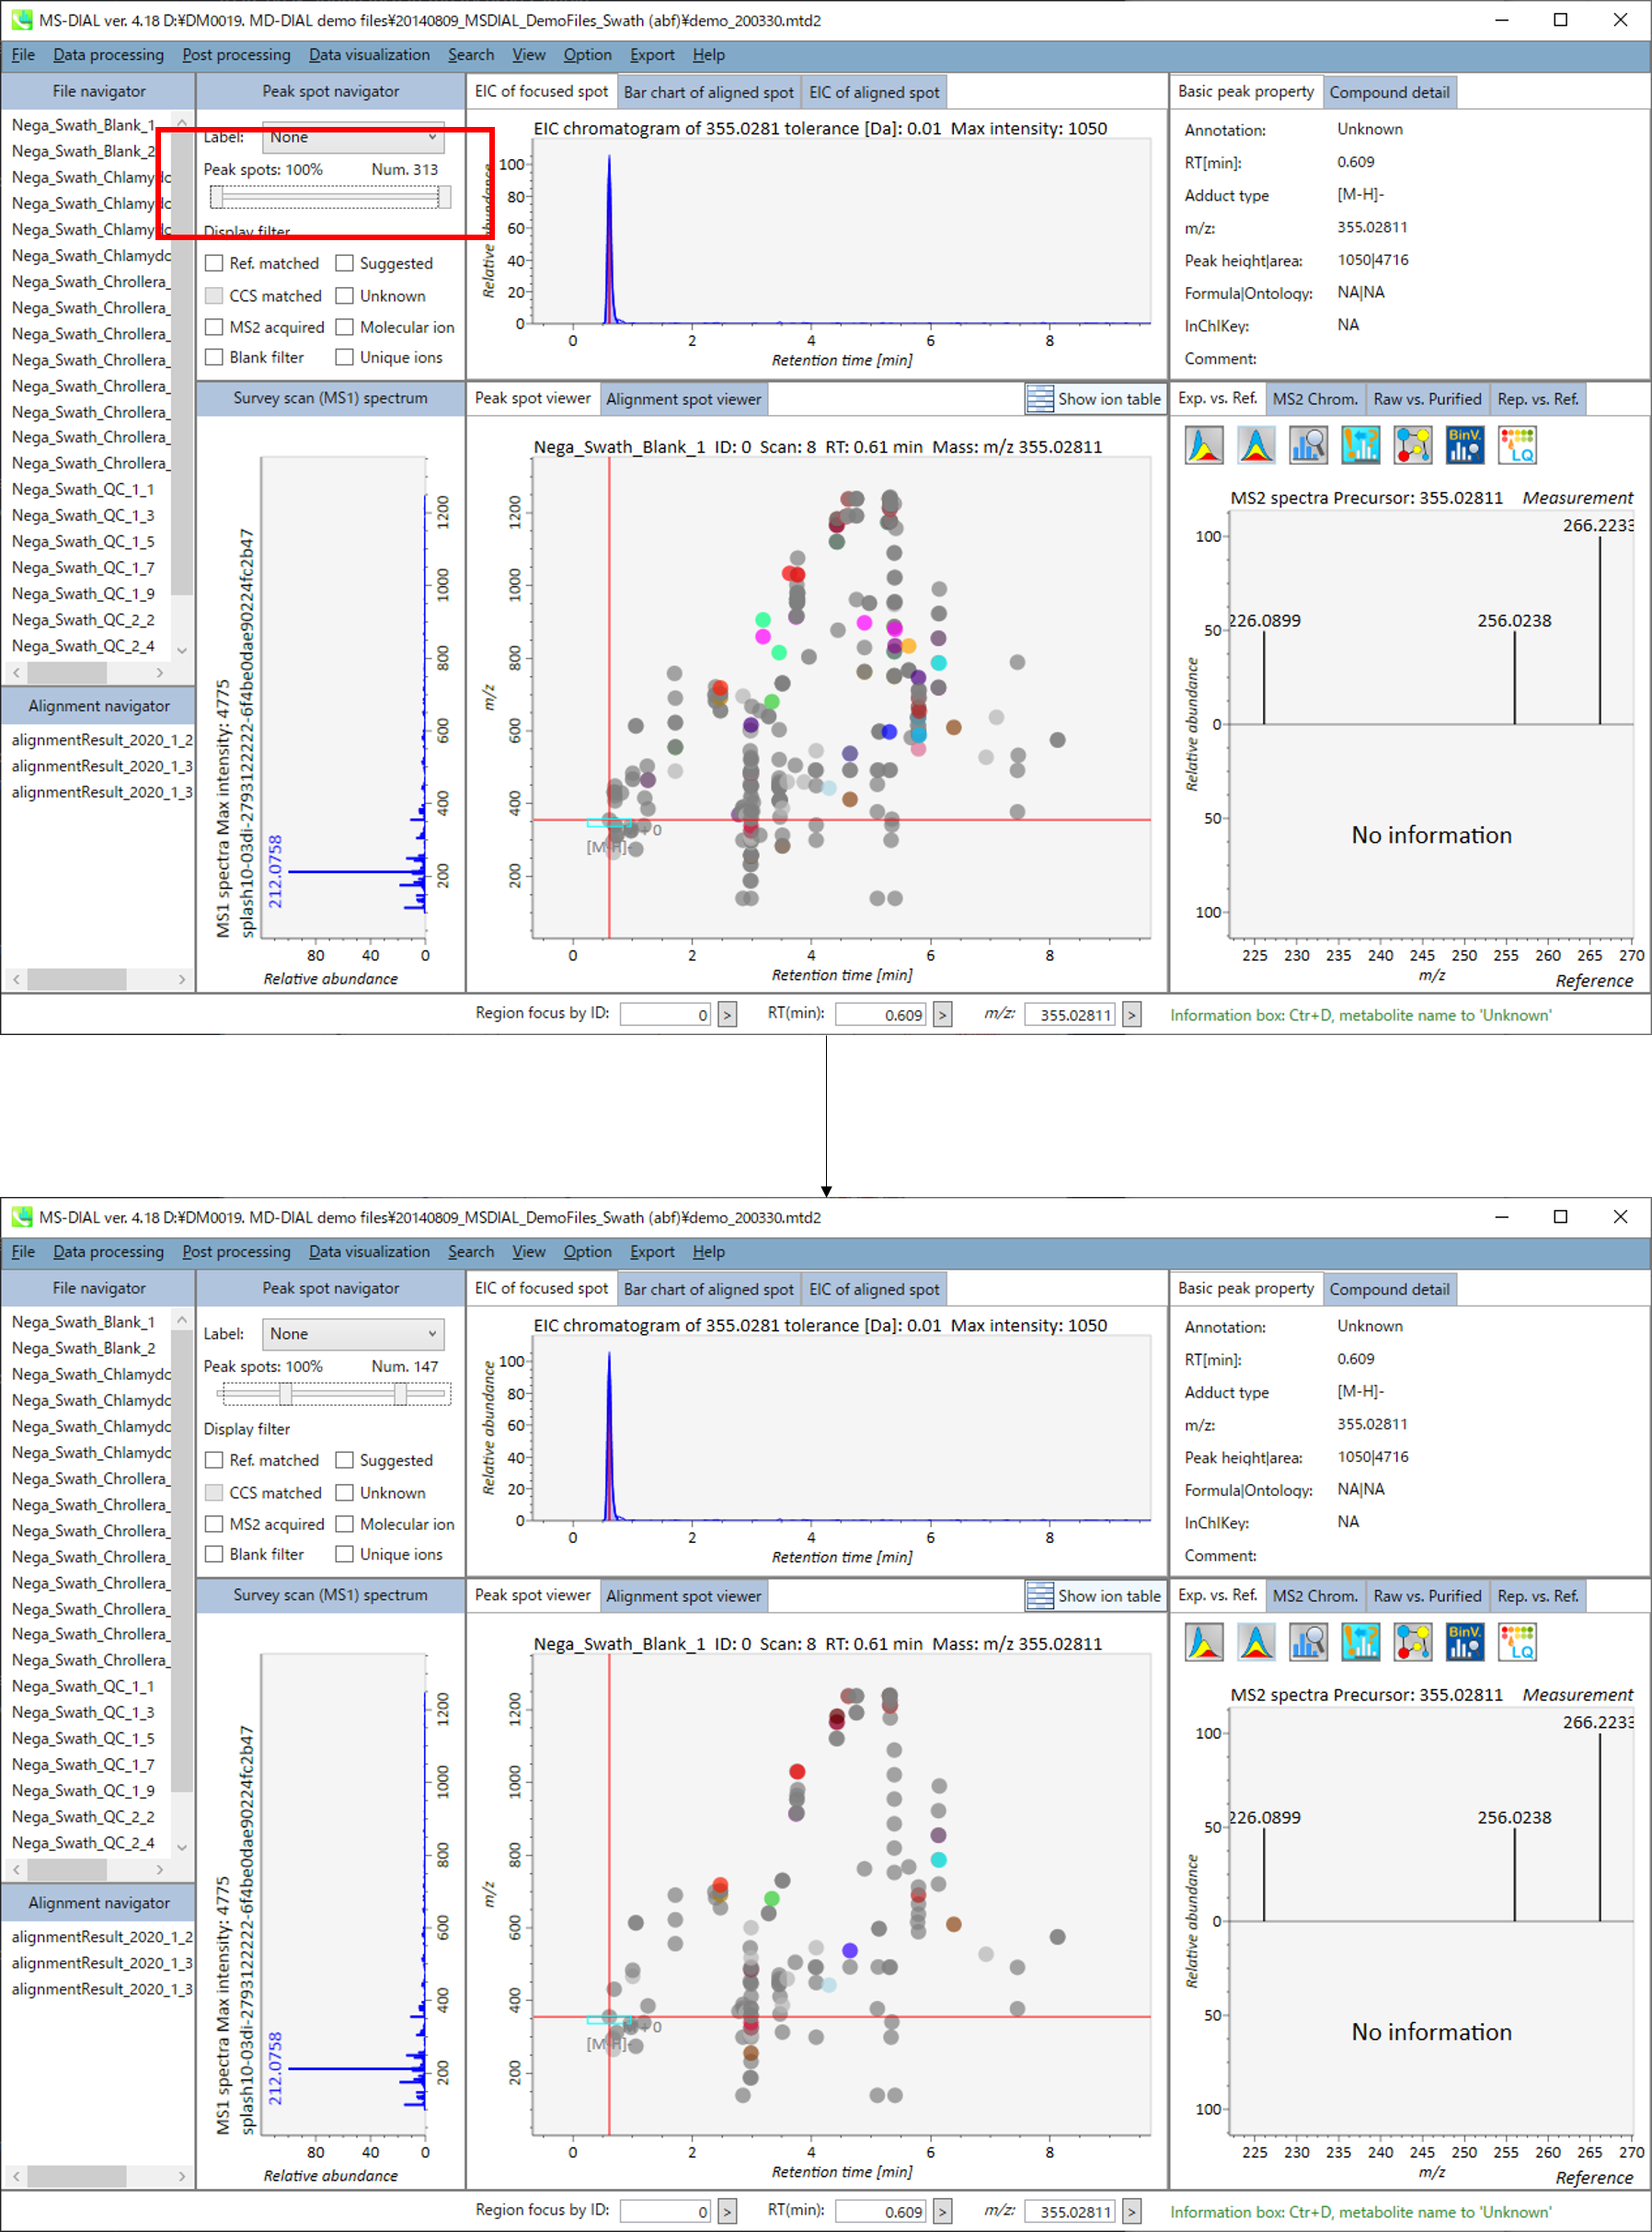
Display filter 显示过滤器
“Ref. matched” shows peaks matched with reference libraries.
“Ref. matched”显示与参考库匹配的峰。
“Suggested” shows annotated peaks without the MS/MS spectrum.
“建议”显示没有MS/MS谱图的注释峰。
“CCS matched” shows peaks matched with CCS information.
“CCS 匹配”显示与 CCS 信息匹配的峰值。
“Unknown” shows unknown peaks.
“未知”表示未知的峰值。
“MS2 acquired” shows peaks having MS/MS information.
“获得的MS2”显示具有MS/MS信息的峰。
“Molecular ion” shows de-isotoped molecular ions.
“分子离子”表示去同位素的分子离子。
“Blank filter” shows peaks exceeding threshold of blank filtering.
“空白过滤器”显示超过空白过滤阈值的峰值。
“Unique ions” shows peaks having searched fragment ions.
“独特离子”显示搜索到碎片离子的峰。
Section 5-11-2 第 5-11-2 节
Tabs of MS-DIAL MS-DIAL 的选项卡
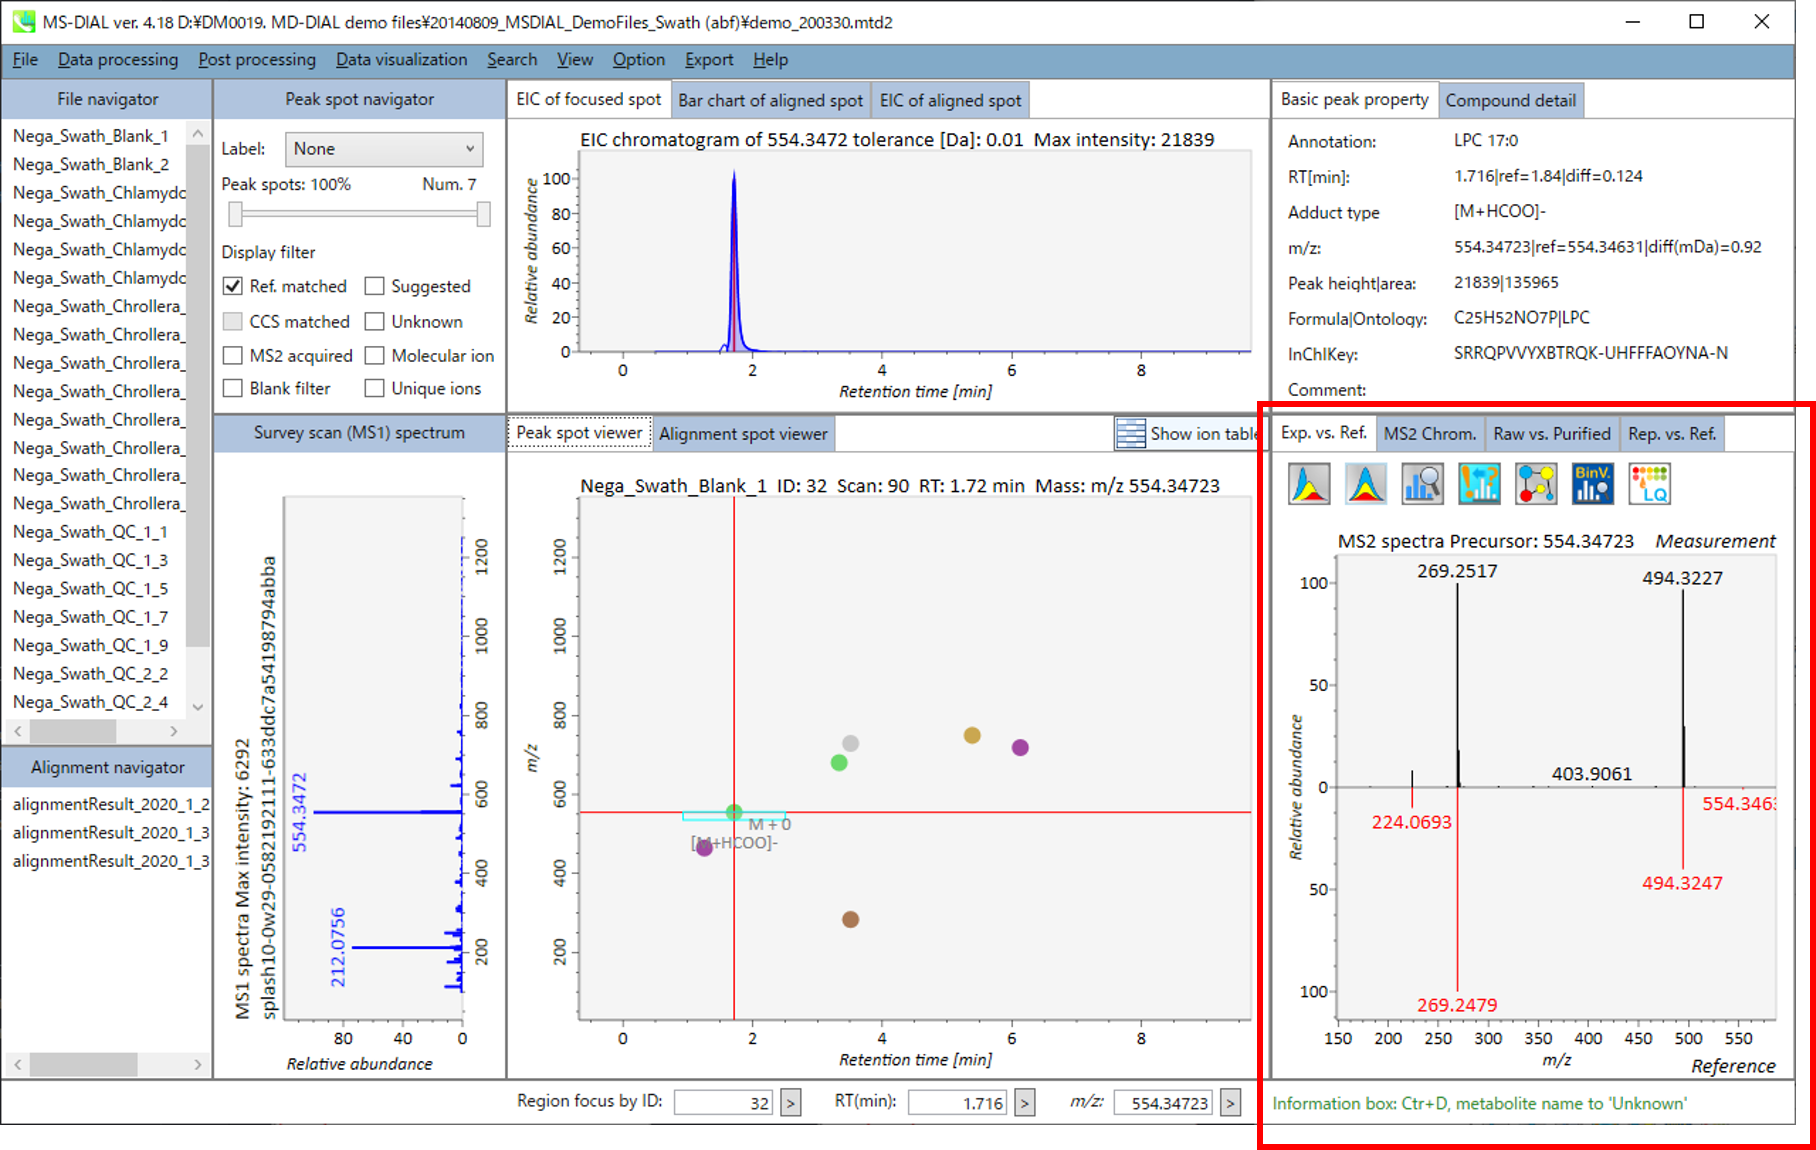
This viewer is prepared especially for data independent MS/MS analysis or GC/MS analysis.
该查看器专为不依赖数据的MS/MS分析或GC/MS分析而准备。
Exp. vs. Ref.: The upper spectrum (blue or black) displays the centroided information of the MS/MS spectrum. The lower spectrum (red) displays the reference MS/MS spectrum. In case of data independent MS/MS or GC/MS analysis, de-convoluted MS/MS spectrum can be displayed by clicking the de-convolution icon <img src=”images/image_74.png” width=3%>.实验与参考:上部光谱(蓝色或黑色)显示MS/MS光谱的质心信息。下部光谱(红色)显示参考MS/MS光谱。在非数据依赖型MS/MS或GC/MS分析的情况下,可以通过单击去卷积图标 来显示去卷积的MS/MS谱图。
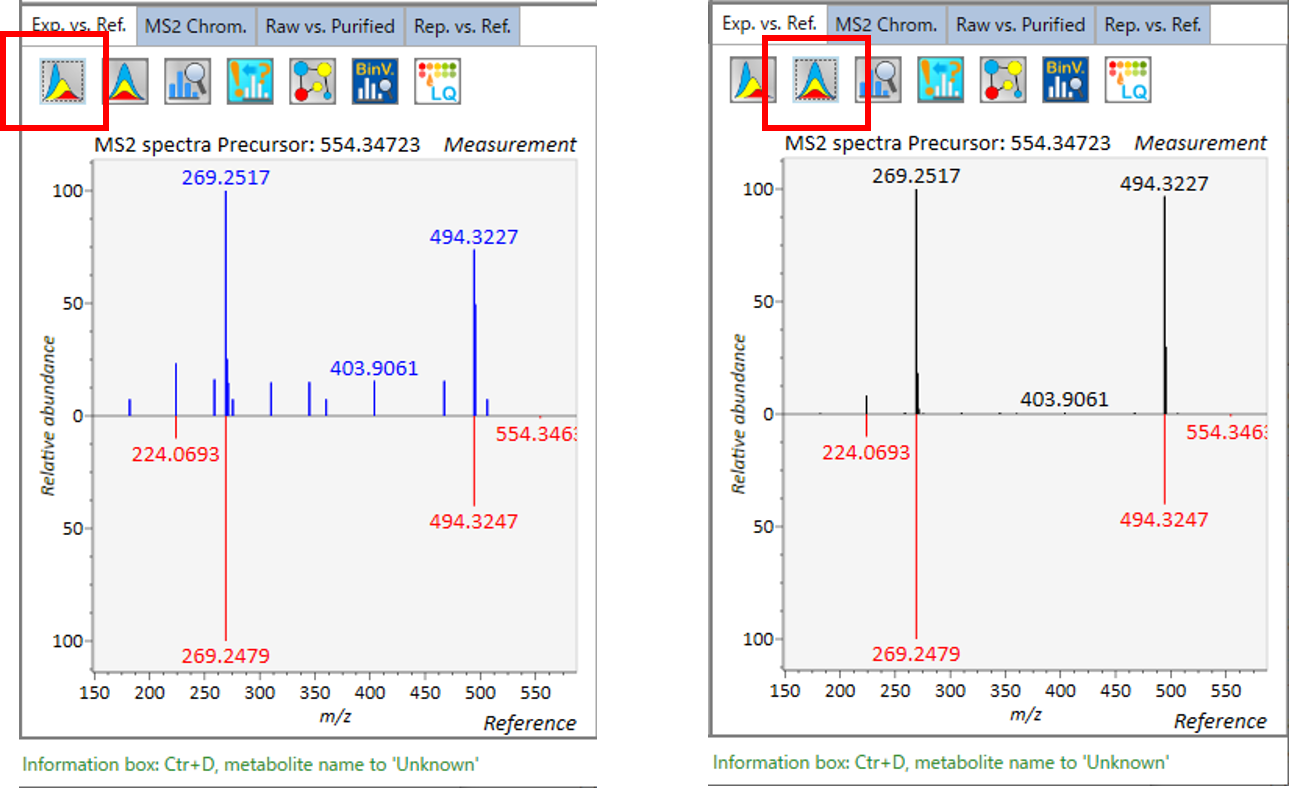
MS2 Chrom.: The MS/MS chromatograms inside the sky-blue rectangle in the center window are displayed. In GC/MS part (named MS1 Chrom.), there is no sky-blue rectangle in the viewer, and the peak width is automatically determined by the algorithm of MS-DIAL instead.
MS2 色谱图:显示中心窗口天蓝色矩形内的 MS/MS 色谱图。在GC/MS部分(名为MS1 Chrom.)中,观察器中没有天蓝色矩形,峰宽由MS-DIAL的算法自动确定。
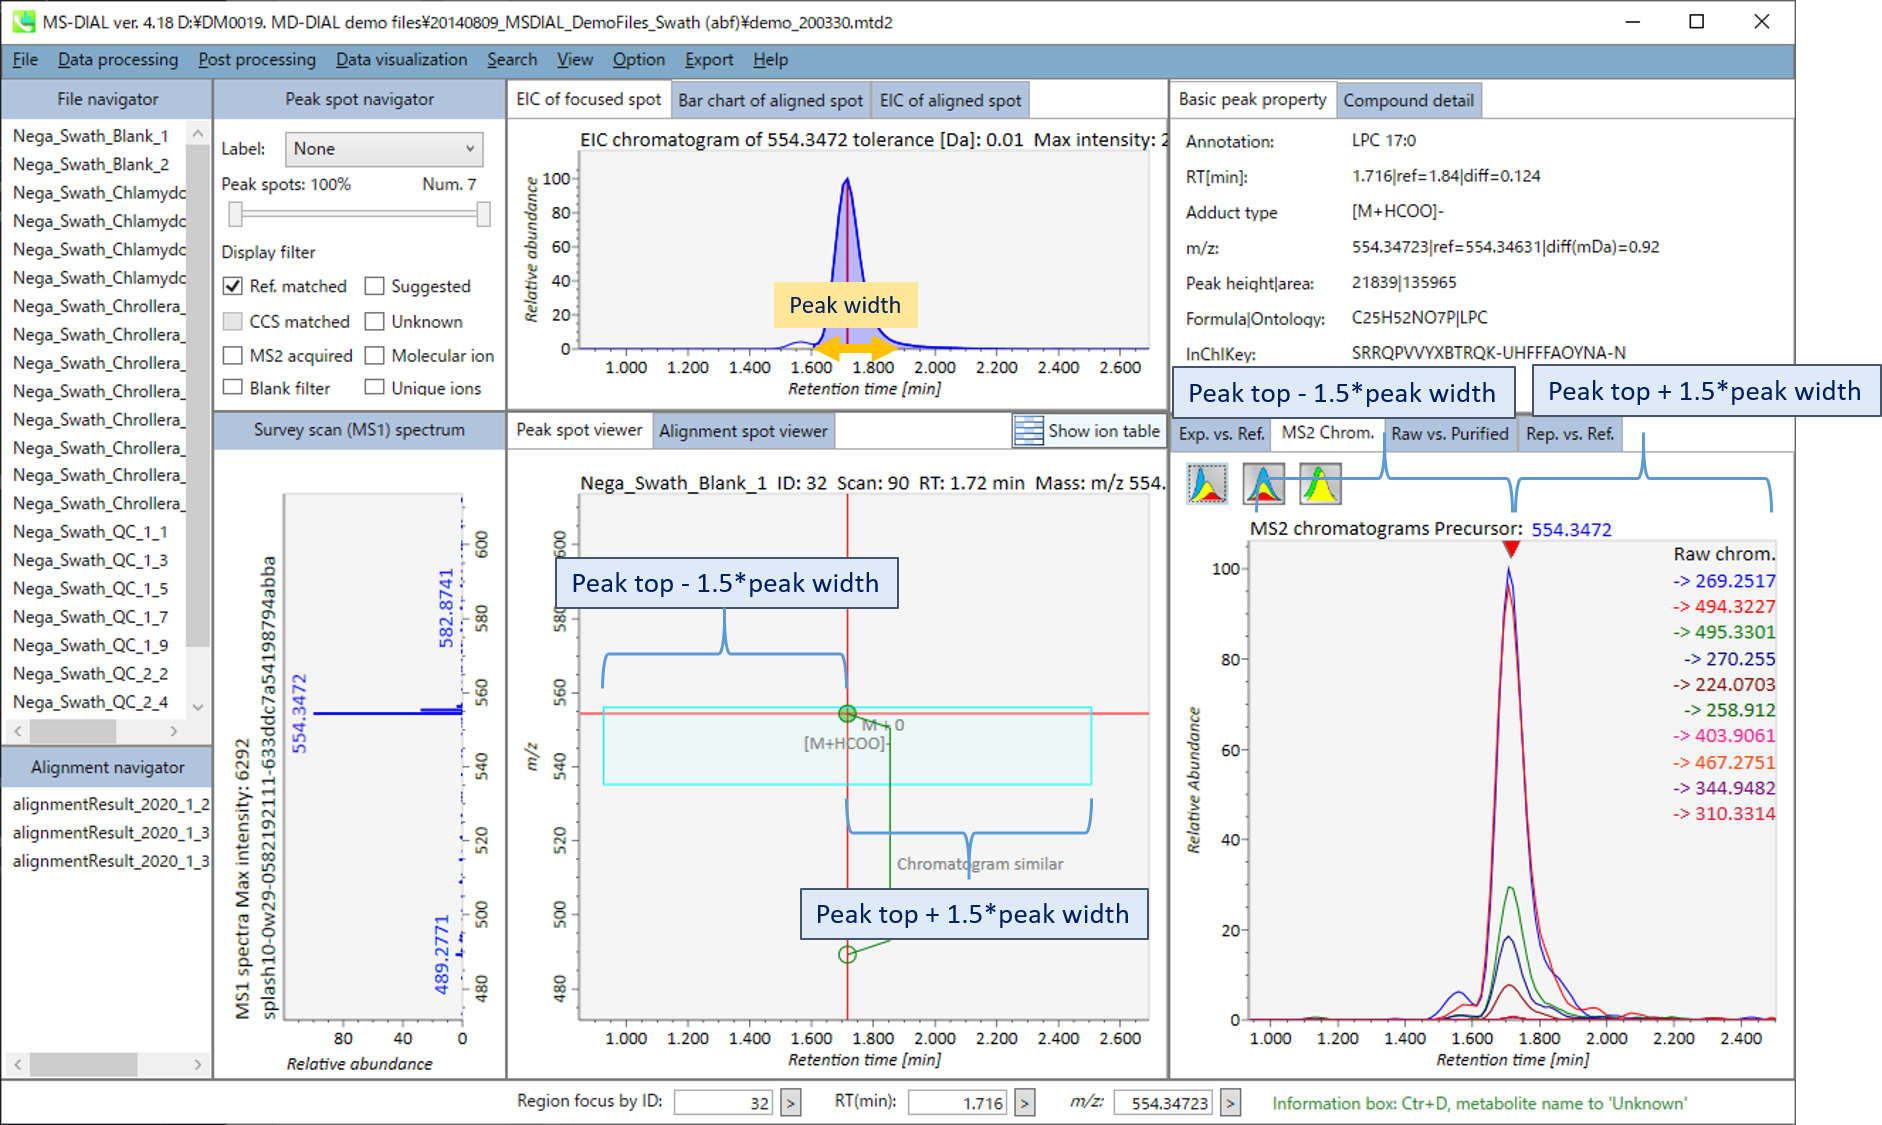
 This icon displays the raw EI or DIA-MS/MS chromatograms. 此图标显示原始EI或DIA-MS/MS色谱图。
 This icon displays the de-convoluted EI or DIA-MS/MS chromatograms. 此图标显示去卷积的 EI 或 DIA-MS/MS 色谱图。
 This icon displays both the raw and de-convoluted EI or DIA-MS/MS chromatograms. 此图标显示原始和去卷积的EI或DIA-MS/MS色谱图。
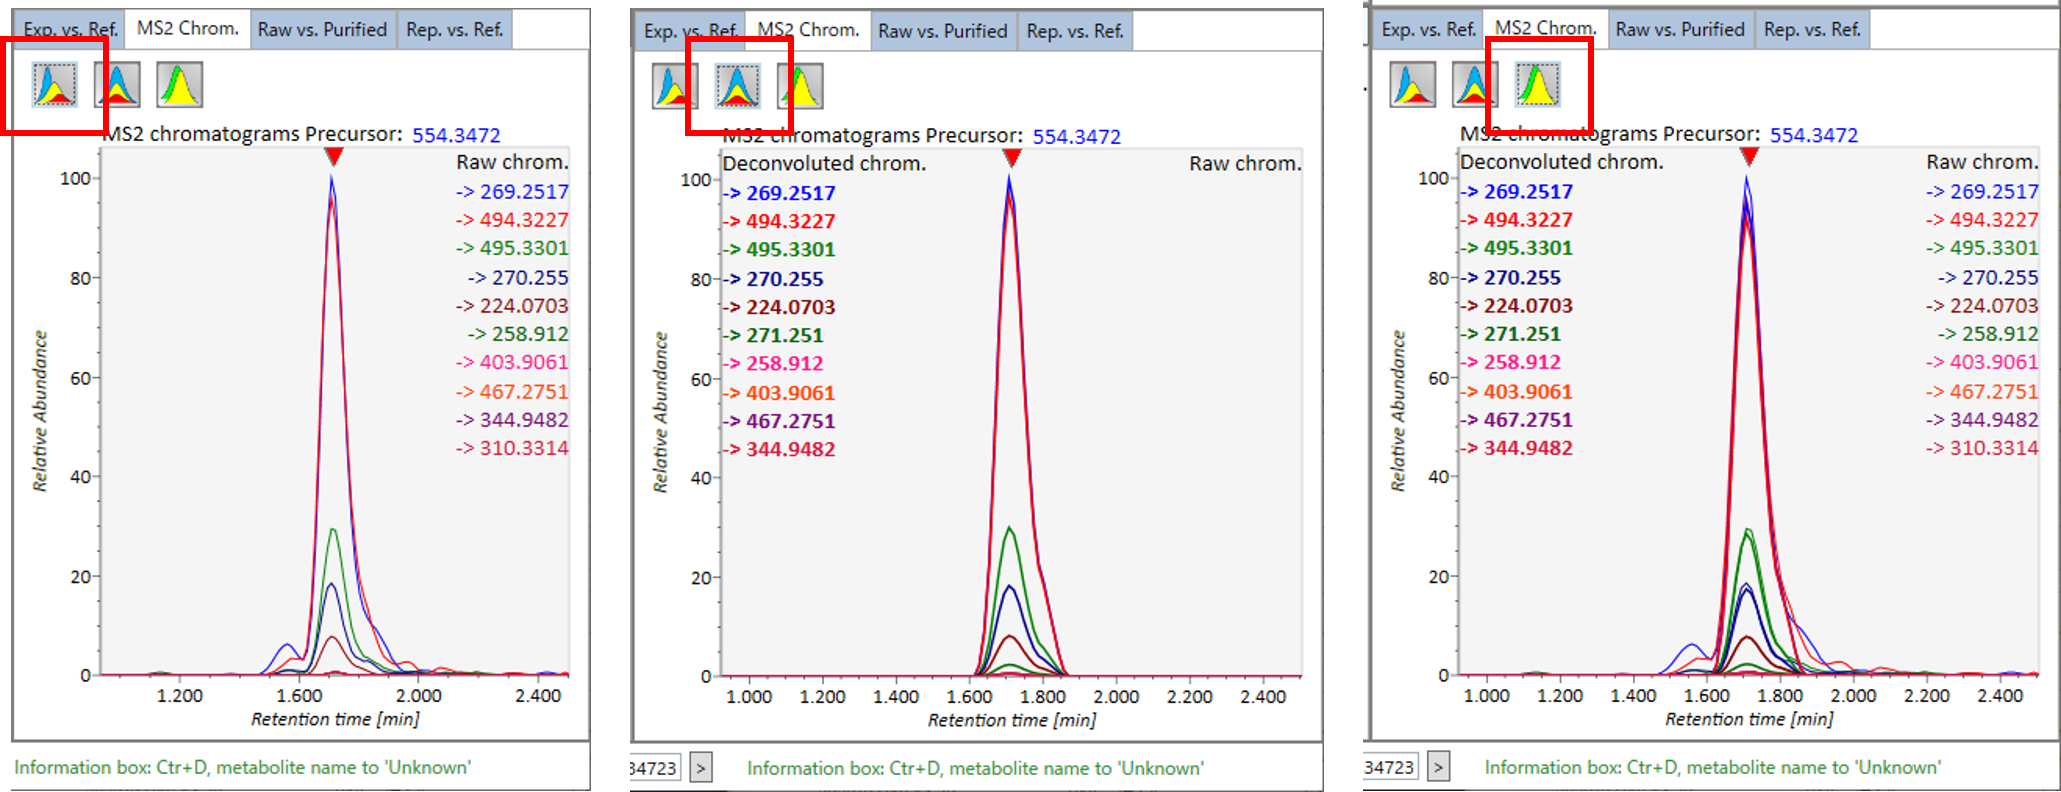
Raw vs. Purified.: The upper and bottom windows display the raw and de-convoluted EI or DIA-MS/MS spectrum, respectively.
原始与纯化:上部和底部窗口分别显示原始和去卷积的 EI 或 DIA-MS/MS 谱图。
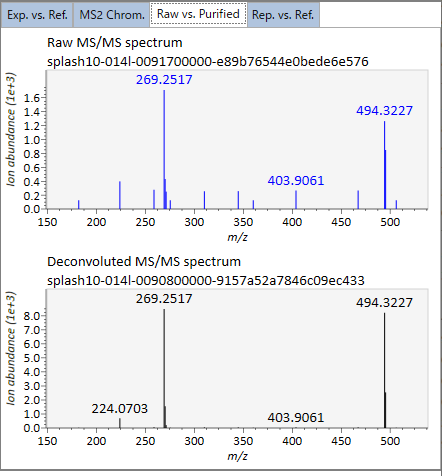
Rep. vs. Ref.: In combination with the alignment viewer, the window compares a representative EI or MS/MS spectrum and a reference EI or MS/MS spectrum. The representative EI or MS/MS is automatically selected as the spectrum of the highest identification score for all samples aligned to the focused alignment spot.
代表与参考:结合对齐查看器,该窗口将代表性EI或MS/MS谱图与参考EI或MS/MS谱图进行比较。代表性的EI或MS/MS被自动选择为与聚焦对齐点对齐的所有样品的最高鉴定分数谱。
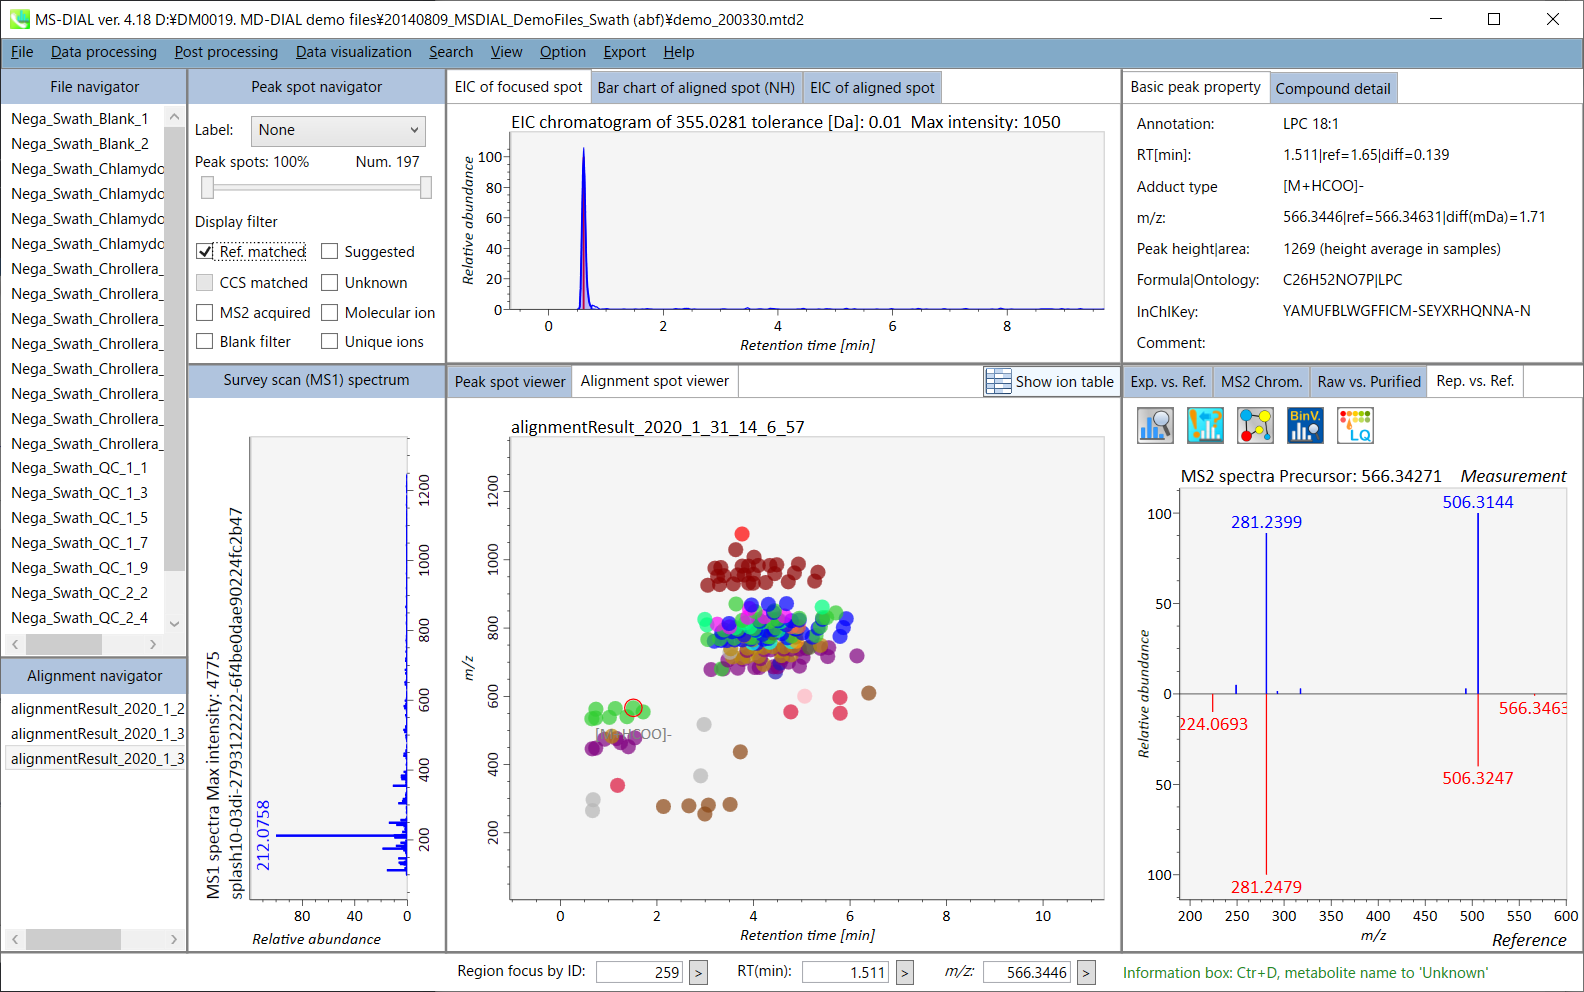
Section 5-12 第5-12节
Search 搜索
Section 5-12-1 第 5-12-1 节
MS/MS fragment searcher MS/MS片段搜索器
In LC-MS/MS project, there is a ‘search’ function to find precursor ions containing the user-defined product ions and/or neutral losses. The function can be applied for both peak spot- and alignment spot results. The search type can be set as ‘product ion’ or ‘neutral loss’. Below is the example using ’281.2479’ Da as product ion search in order to find the precursor ions contacting oleic acid (C18H32O2). The result can be found by clicking ‘unique ions’ checkbox in MS-DIAL main window.
在LC-MS/MS项目中,有一个“搜索”功能,用于查找包含用户定义的子离子和/或中性损失的母离子。该功能可应用于峰值点和对准点结果。搜索类型可以设置为“子离子”或“中性损失”。下面是使用“281.2479”Da作为子离子搜索的示例,以找到与油酸( 18 CHO 32 )接触的前体离子 2 。可以通过单击MS-DIAL主窗口中的“唯一离子”复选框来找到结果。
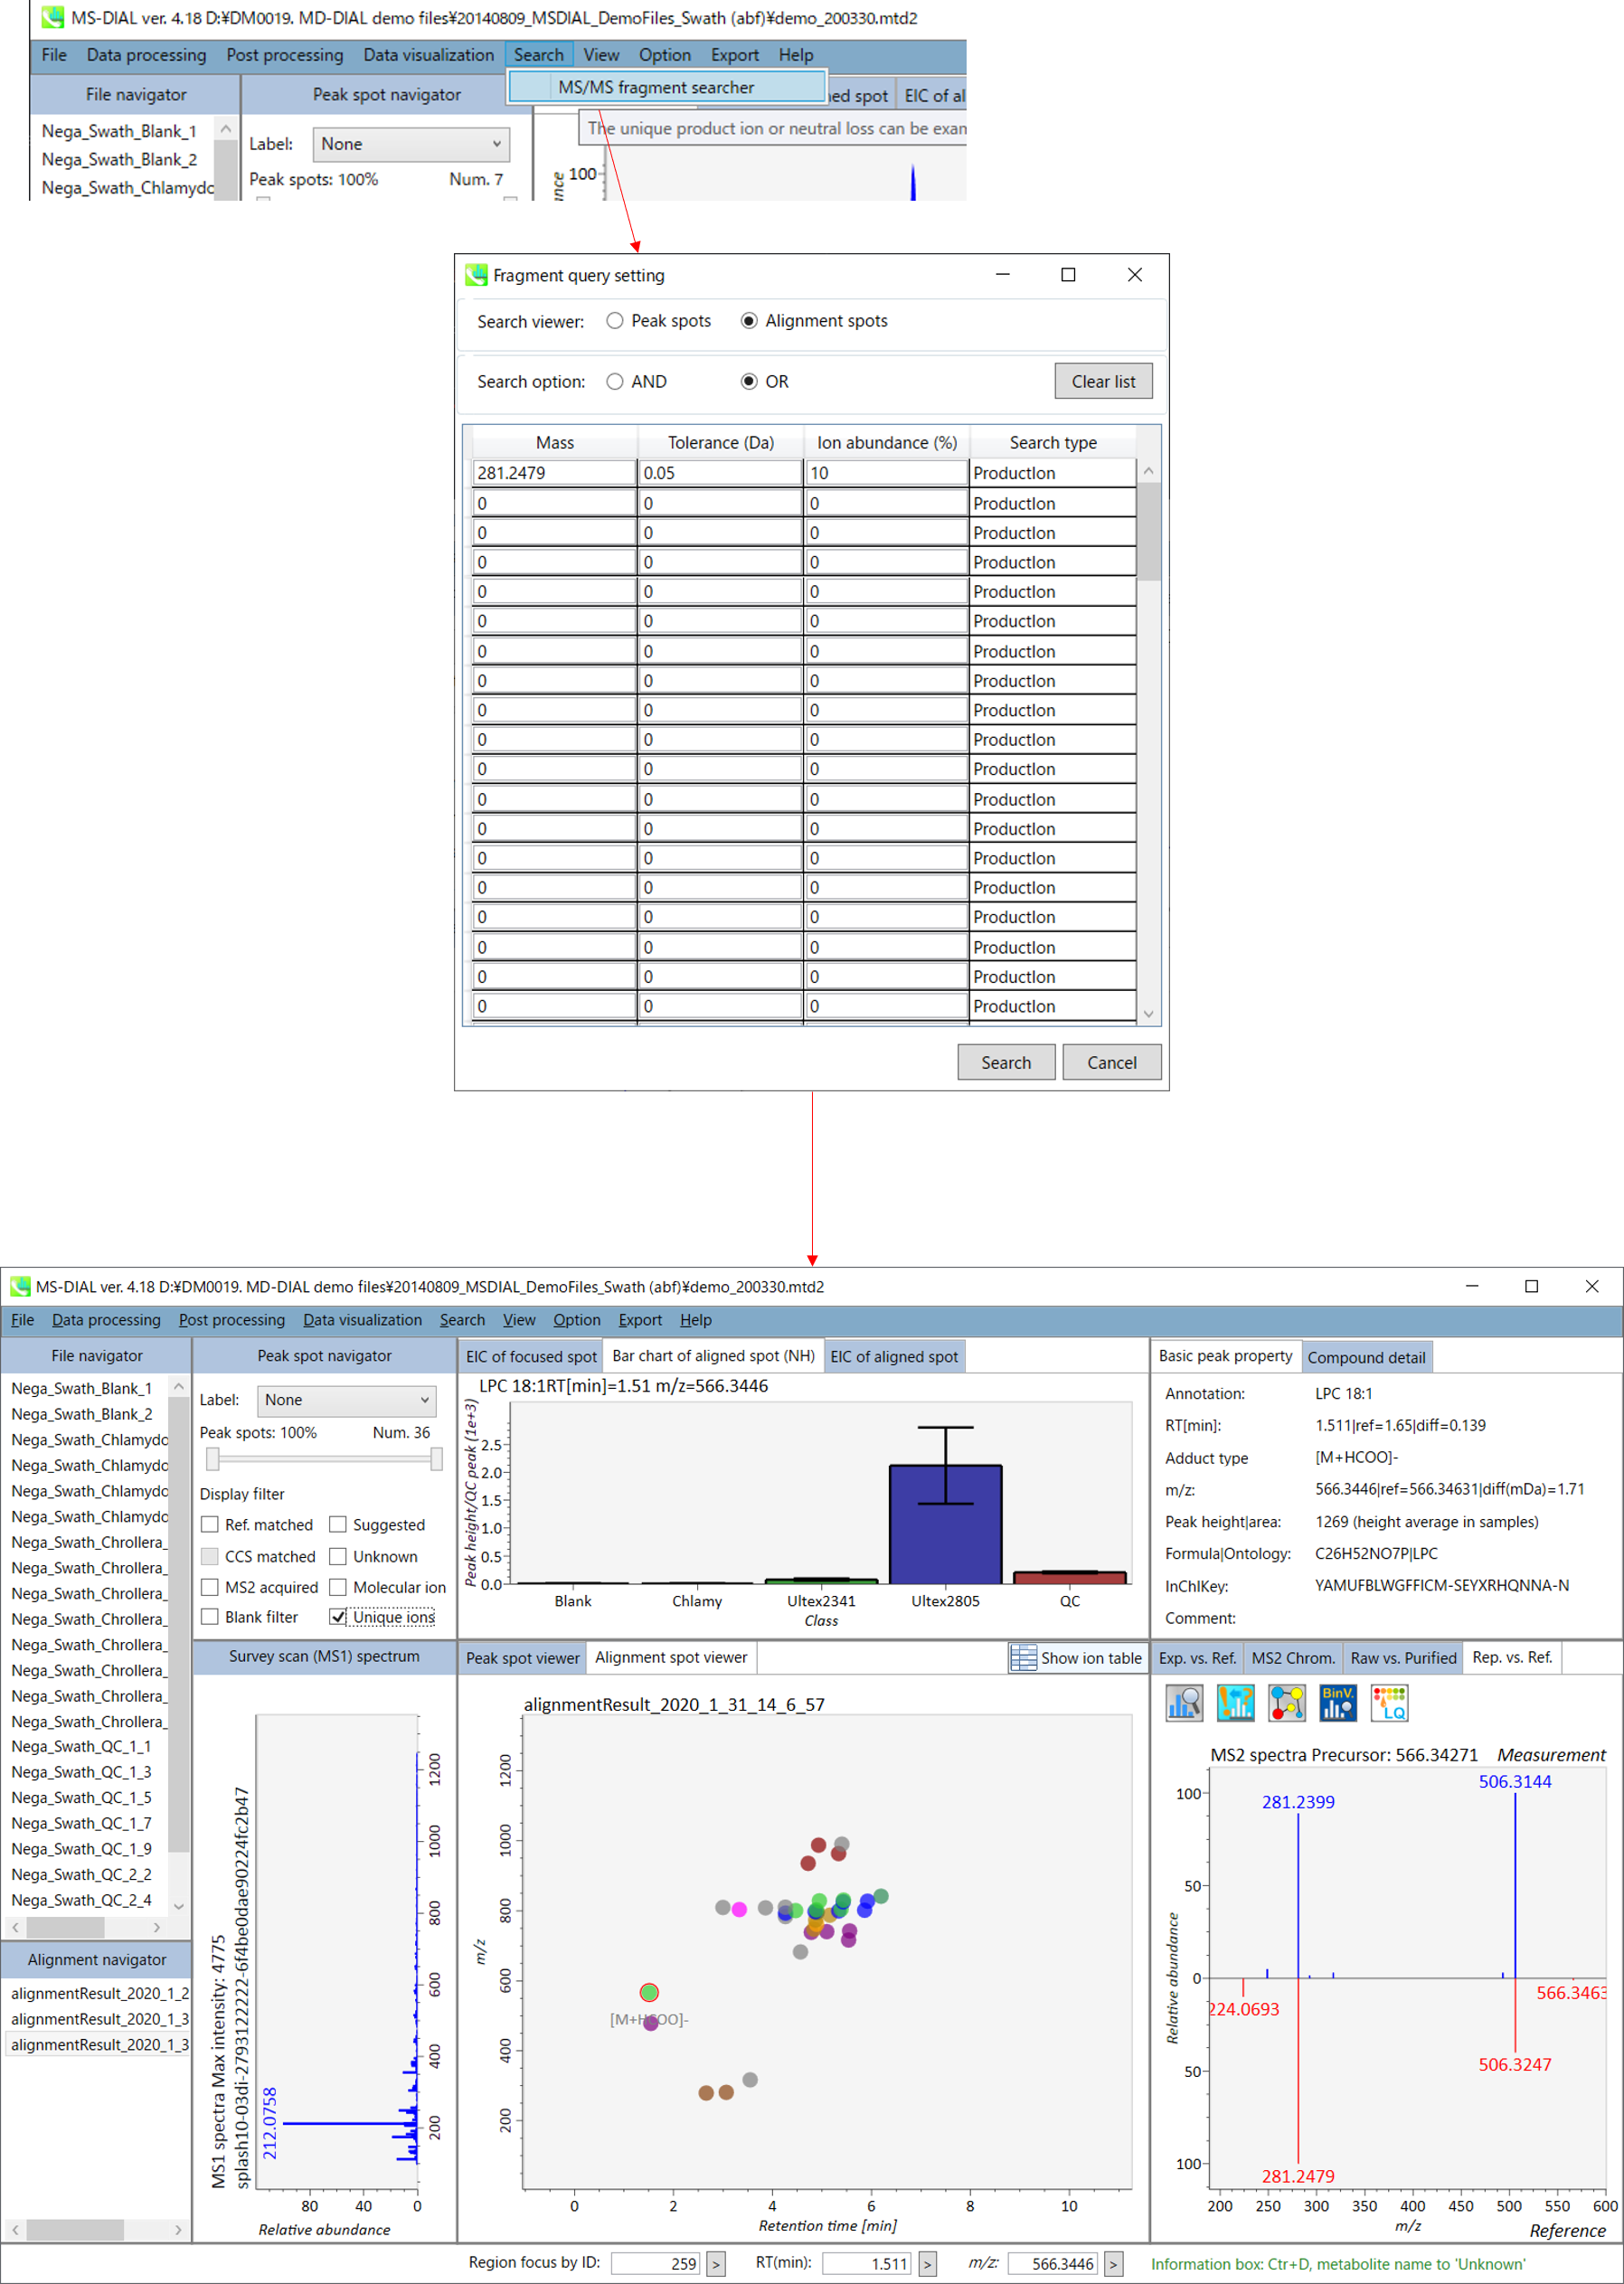
Section 5-12-2 第 5-12-2 节
Amalgamation of different polarity peak list
不同极性峰列表的合并
The adduct type determination for unknown molecules is the important process for compound identification. The integration of positive- and negative ion features is often helpful. For example, if we see m/z 273.076 in positive and m/z 271.061 in negative ion data at the same retention time region, the adduct type can be determined as [M+H]+ and [M-H]- because of the 2.015Da difference.
未知分子的加合物类型测定是化合物鉴定的重要过程。正离子和负离子特征的集成通常会有所帮助。例如,如果我们在相同的保留时间区域看到正离子数据中的m/z 273.076和负离子数据中的m/z 271.061,则由于2.015Da的差异,加合物类型可以确定为[M+H]+和[M-H]-。
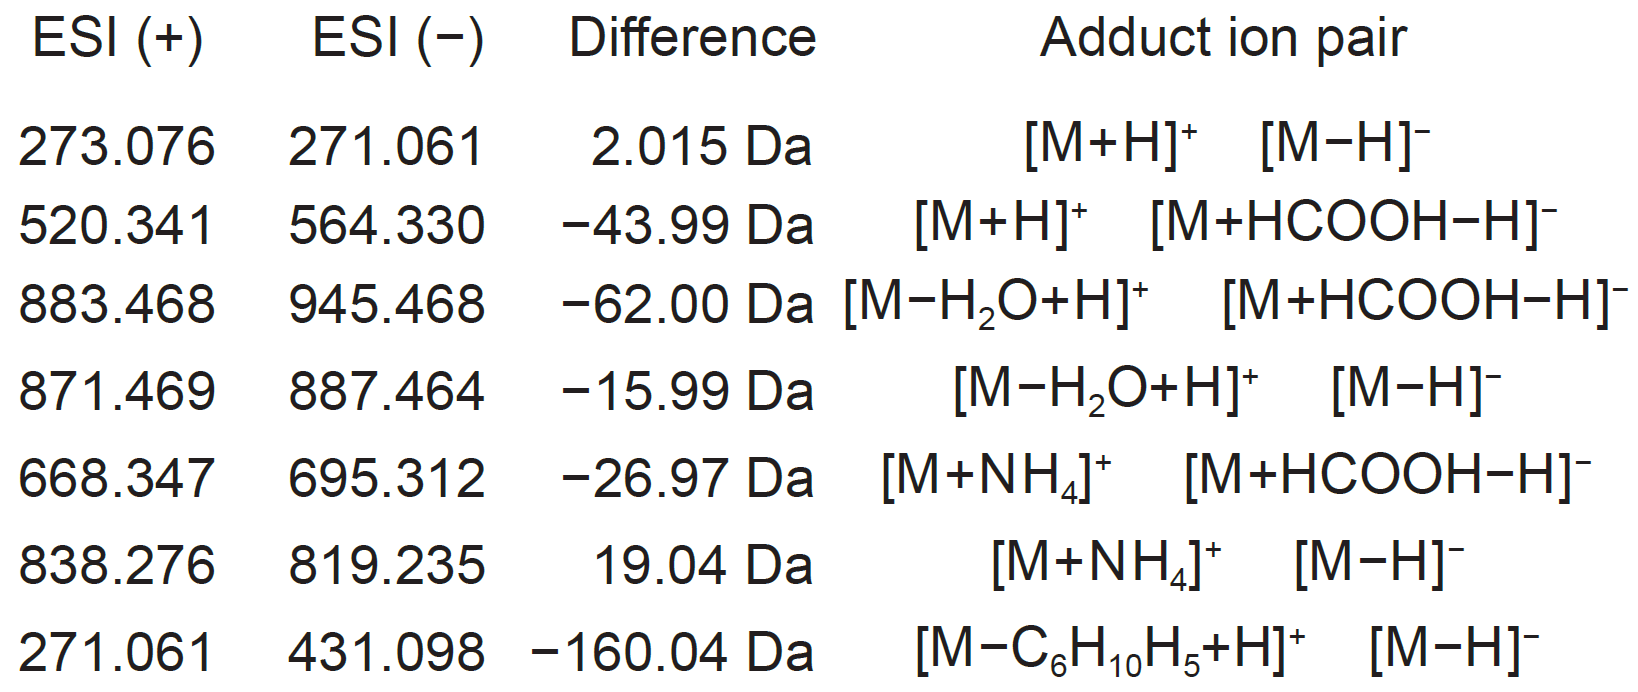
Example of mass difference for adduct type determination
加合物类型测定的质量差示例
Therefore, MS-DIAL provides the utility integrating the different polarity peak features. Here, this demonstration will use the feature list from negative ion mode data to determine the adduct types of positive ion peak features.
因此,MS-DIAL提供了集成了不同极性峰值特征的实用程序。在这里,本演示将使用负离子模式数据中的特征列表来确定正离子峰特征的加合物类型。
In negative ion mode project, select ‘Export’ -> ‘Peak list result’.
在负离子模式项目中,选择“导出”->“峰列表结果”。
Export a detected peak list (feature list) as tab delimited text format.
将检测到的峰列表(特征列表)导出为制表符分隔的文本格式。
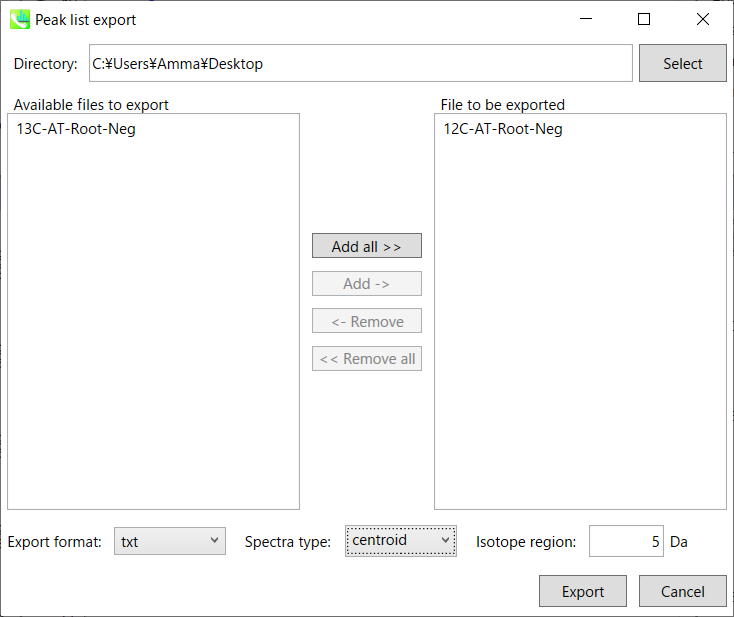
Then, make the peak list containing m/z value (first column) and retention time value as tab delimited text format file. Now, (for example), it is saved as ‘12C-AT-Root-Neg.txt’.
然后,将包含m/z值(第一列)和保留时间值的峰列表制作为制表符分隔的文本格式文件。现在,(例如),它被保存为“12C-AT-Root-Neg.txt”。
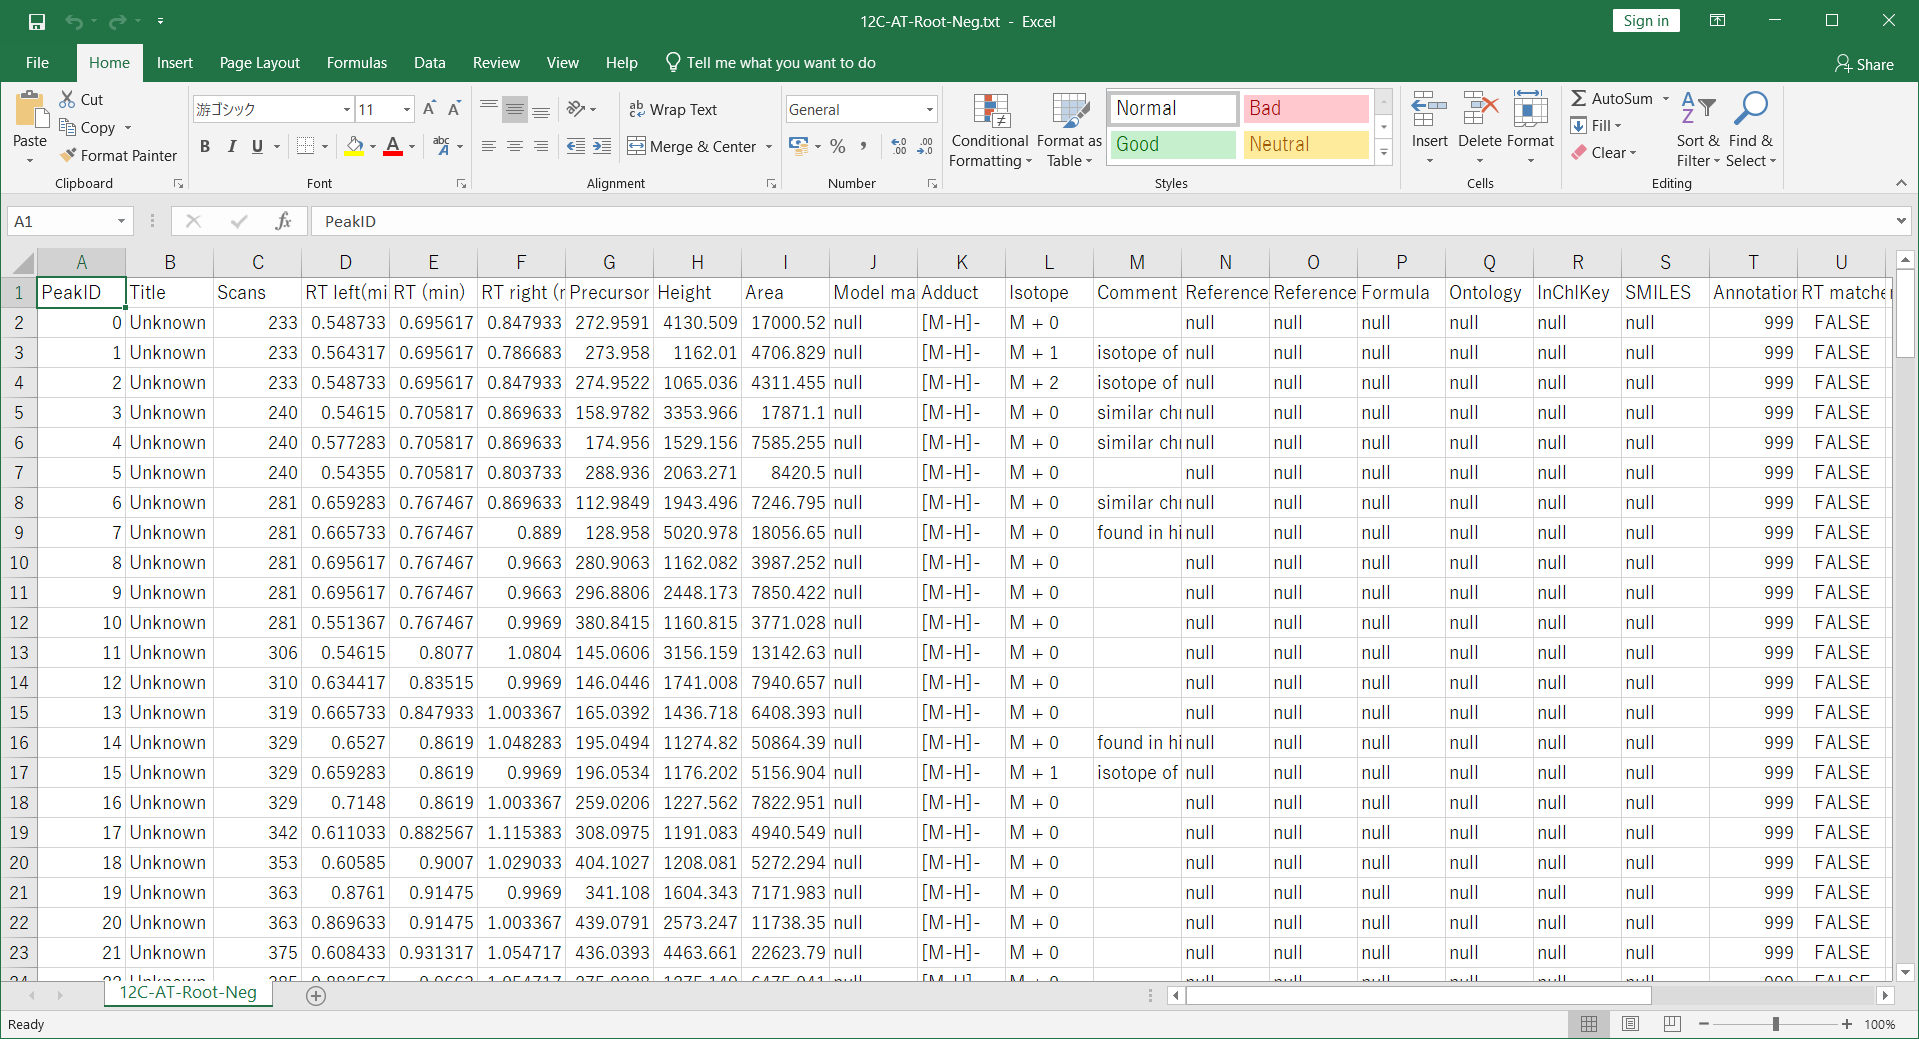
Open the project using positive ion mode data. Ideally, the sample origins should be the same as handled in negative ion mode. Then, follow as “Post processing” -> “Amalgamation of different polarity peak list”. Then, browse the ion features of negative ion project, i.e. 12C-AT-Root-Neg ion features.txt. Please select the adduct type pairs to be considered for the adduct type determination. After the ion feature amalgamator is executed, you will get the integrated result of different polarity data.
使用正离子模式数据打开项目。理想情况下,样品来源应与负离子模式下处理的样品来源相同。然后,按照“后处理”->“不同极性峰列表的合并”进行操作。然后,浏览负离子项目的离子特征,即12C-AT-Root-Neg离子特征.txt。请选择要考虑的加合物类型对,以确定加合物类型。离子特征合并器执行后,您将得到不同极性数据的积分结果。
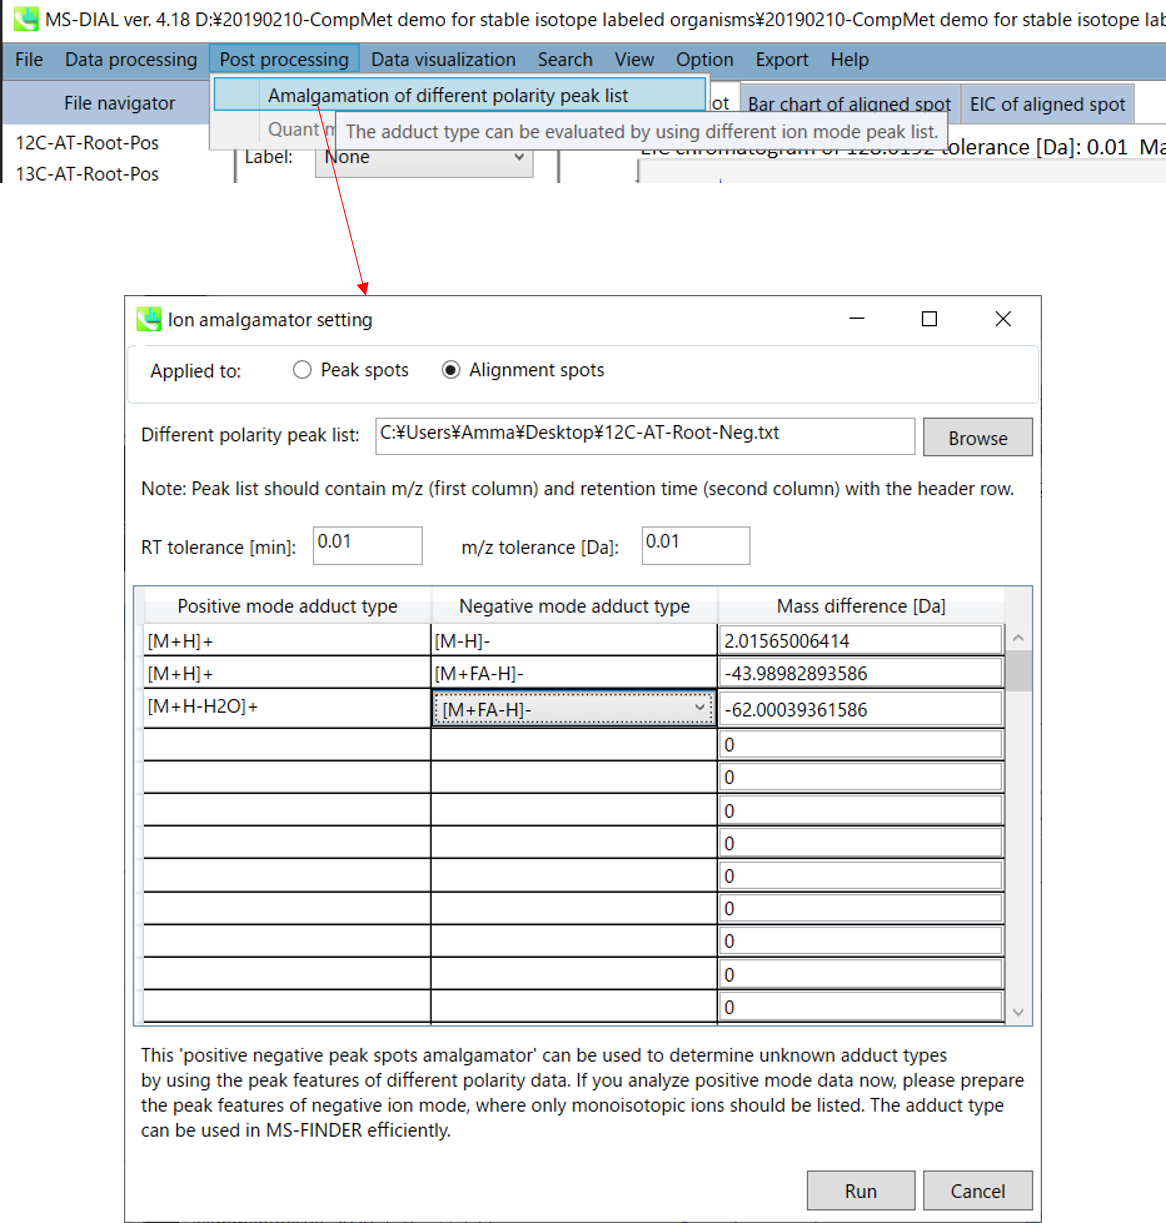
Section 5-13 第5-13节
Pathway map 通路图
1. “Data visualization” -> “Pathway”
1. “数据可视化”->“通路”
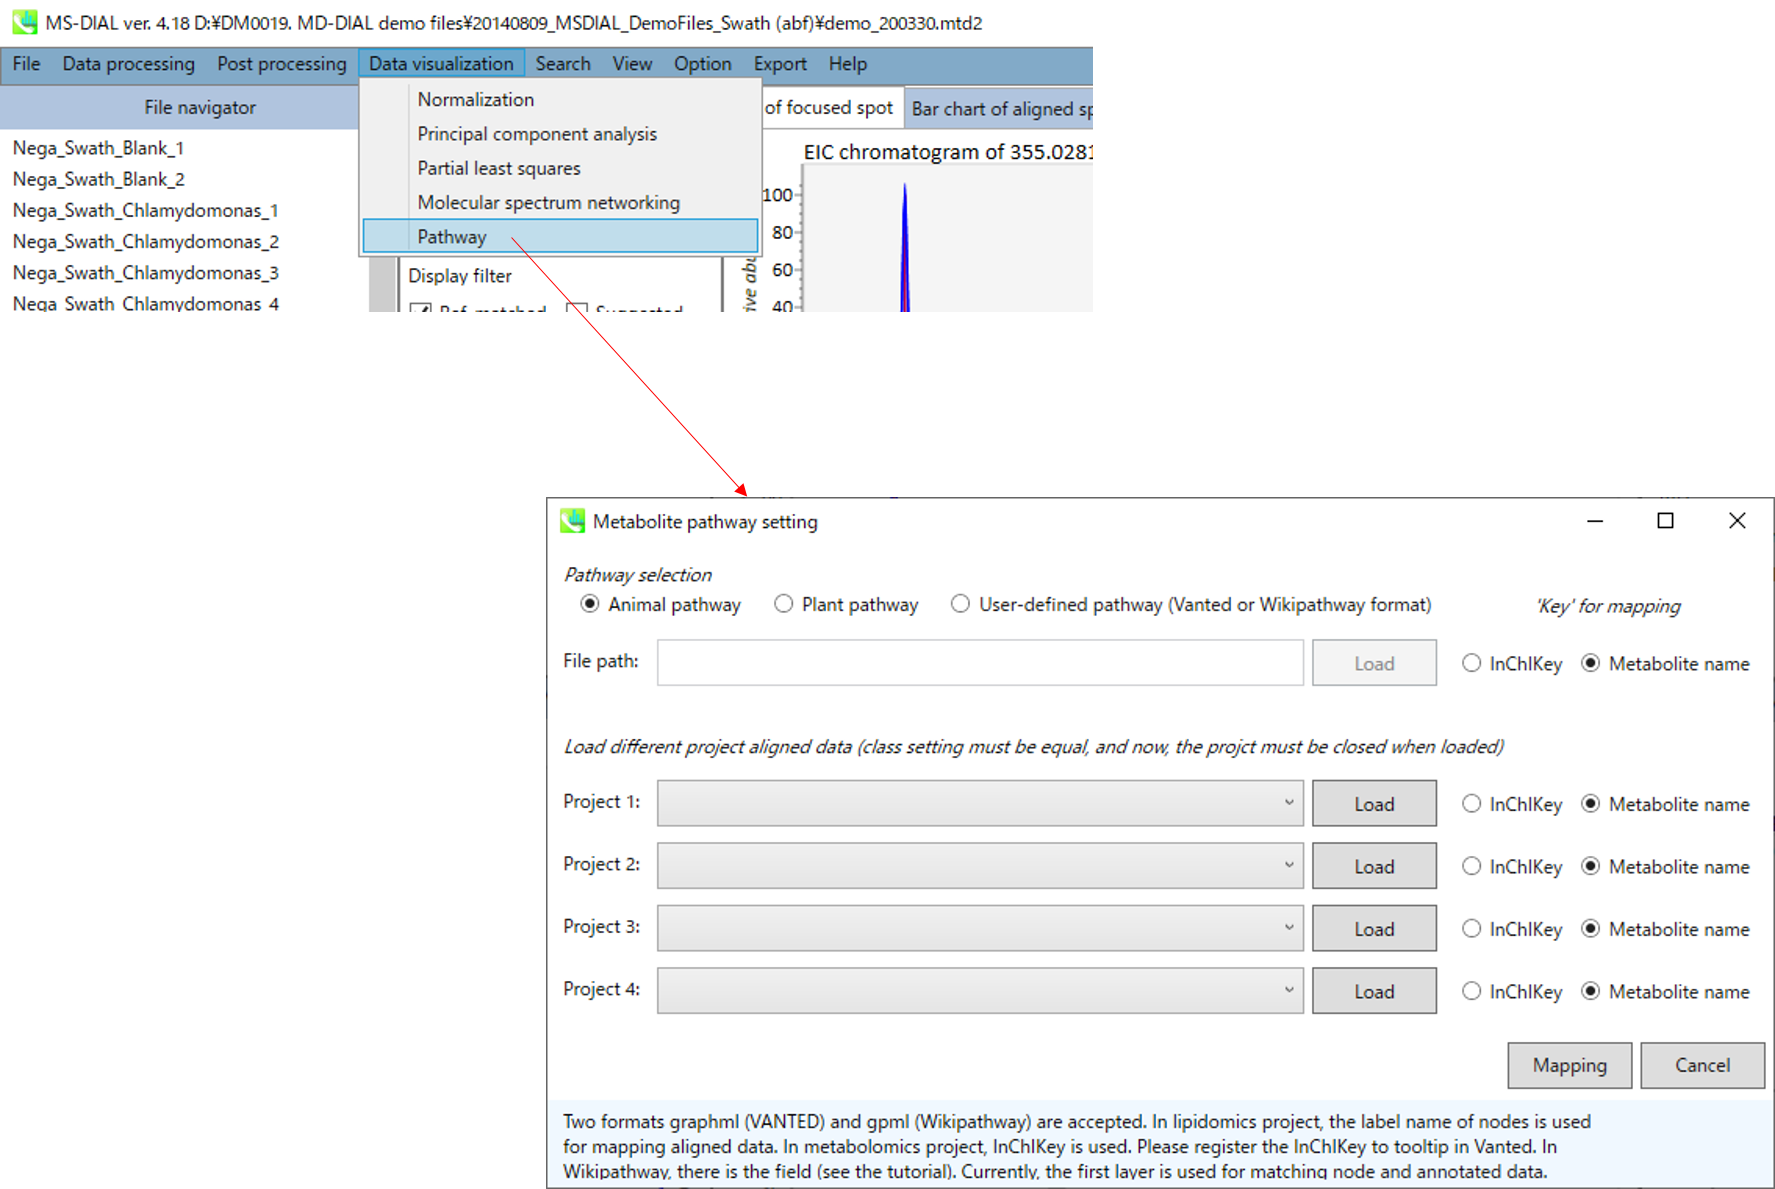
You can select one of 3 type of pathway, i.e. animal pathway, plant pathway and user-defined pathway (two formats, graphml (VANTED) and gpml (Wikipathway) are accepted). In lipidomics project, the label name of nodes is used for mapping aligned data. In metabolomics project, InChIKey is used. Please register the InChIKey to tooltip in Vanted. In Wikipathway, there is the field (see the tutorial). Currently, the first layer is used for matching node and annotated data.
您可以选择 3 种类型的通路之一,即动物通路、植物通路和用户自定义通路(接受两种格式,graphml (VANTED) 和 gpml (Wikipathway)。在脂质组学项目中,节点的标签名称用于映射对齐的数据。在代谢组学项目中,使用了InChIKey。请在 Vanted 中注册 InChIKey 到工具提示。在Wikipathway中,有一个字段(见教程)。目前,第一层用于匹配节点和标注数据。
You can also load up to 4 different project aligned data (class setting must be equal, and now, the project must be closed when loaded).
您还可以加载最多 4 个不同的项目对齐数据(类设置必须相等,现在,加载时必须关闭项目)。
Finally, click the Mapping button.
最后,单击“映射”按钮。
2. You can get the pathway map.
2.您可以获得路径图。
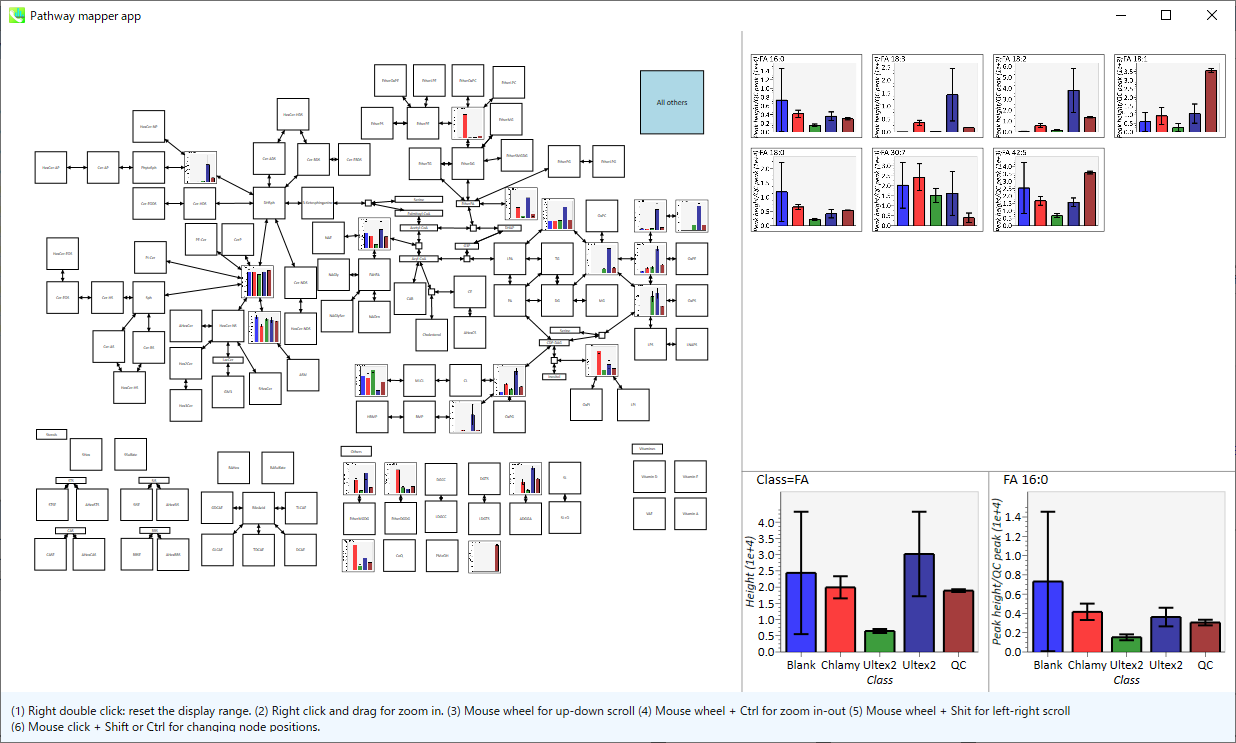
Right double click reset the display range.
右键双击重置显示范围。
Right click and drag for zoom in.
右键单击并拖动以放大。
Mouse wheel for up-down scroll.
用于上下滚动的鼠标滚轮。
Mouse wheel + Ctrl for zoom in-out.
鼠标滚轮 + Ctrl 用于放大。
Mouse wheel + Shift for left-right scroll.
鼠标滚轮 + Shift 用于左右滚动。
Mouse click + Shift or Ctrl for changing node position.
鼠标单击 + Shift 或 Ctrl 以更改节点位置。
Chapter 6 第 6 章
Other utilities of MS-DIAL
MS-DIAL的其他实用程序
Section 6-1 第 6-1 节
Link to MS-FINDER for searching unknowns
链接到MS-FINDER以搜索未知物
MS-FINDER aims to provide 4lutions for 1) formula predictions, 2) fragment annotations, and 3) structure elucidations by means of survey scan MS and MS/MS spectra of unknowns. The detail of MS-FINDER is described in http://prime.psc.riken.jp/Metabolomics_Software/MS-FINDER/index.html. Note that you have to download the MS-FIDNER program from the website above on your PC.
MS-FINDER 旨在通过未知物的 MS 和 MS/MS 谱图为 1) 公式预测、2) 片段注释和 3) 结构解析提供 4 个溶液。MS-FINDER 的详细信息在 http://prime.psc.riken.jp/Metabolomics_Software/MS-FINDER/index.html 中进行了描述。请注意,您必须在PC上从上述网站下载MS-FIDNER程序。
The current MS-DIAL program can send the unknown query. On the first time that you try to send a query into MS-FINDER, a pop up window will be generated, and then select ‘MSFINDER.exe’ from its dialog box. Moreover, MS-DIAL can export all of peak- or alignment spots as ‘MAT’ format file which can be imported by MS-FINDER (Add components to search list).
当前的 MS-DIAL 程序可以发送未知查询。首次尝试将查询发送到 MS-FINDER 时,将生成一个弹出窗口,然后从其对话框中选择“MSFINDER.exe”。此外,MS-DIAL可以将所有峰值或对齐点导出为“MAT”格式文件,该文件可以通过MS-FINDER(将组件添加到搜索列表)导入。
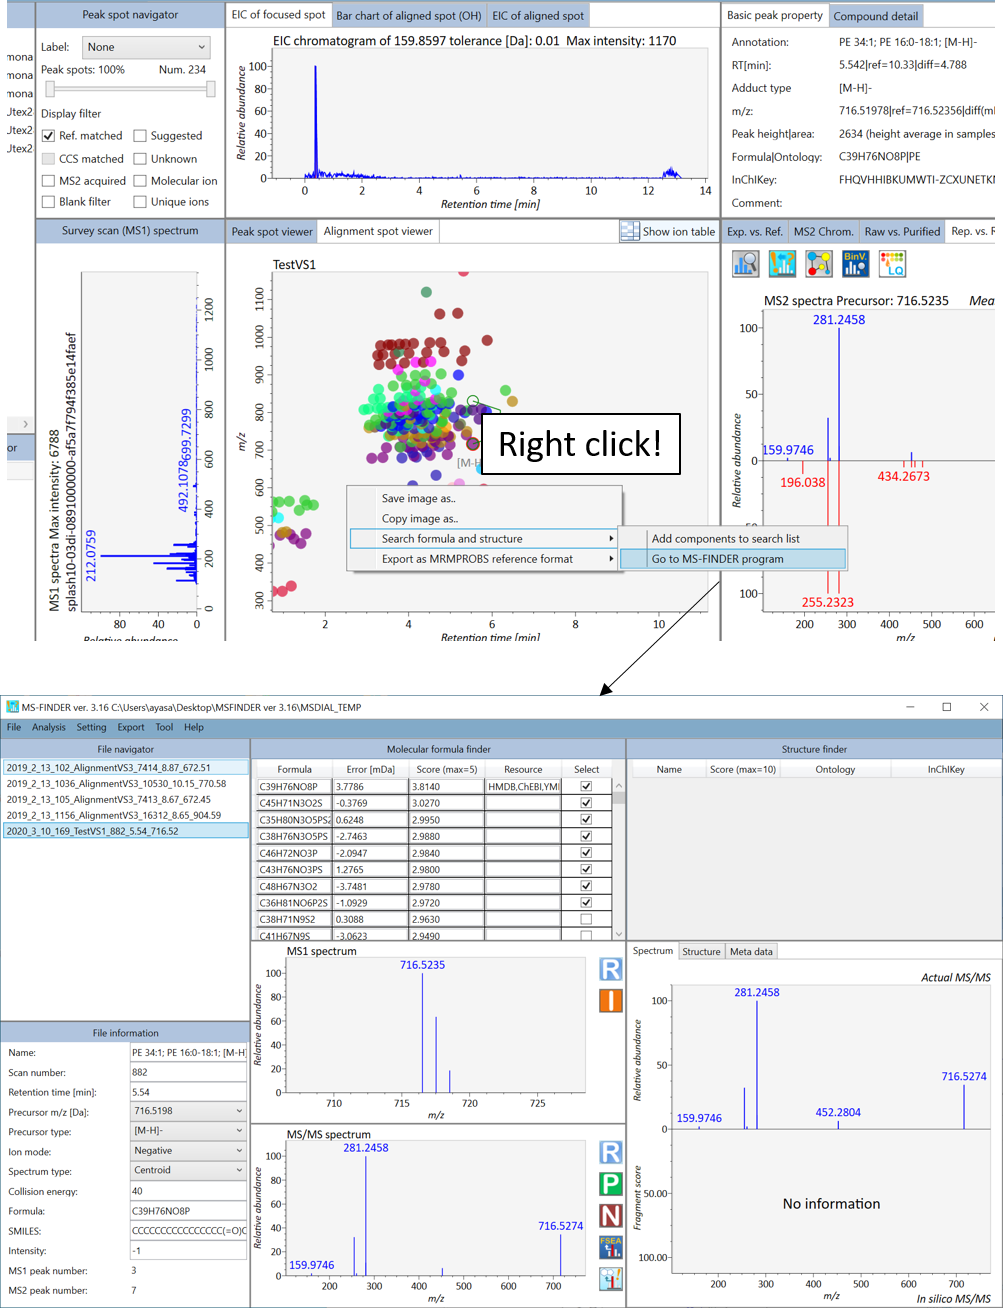
Section 6-2 第 6-2 节
Bridge to MRMPROBS for DIA-MS or GC/MS data sets
桥接至DIA-MS或GC/MS数据集的MRMPROBS
The purpose of this section is to announce the utility of ‘MRMPROBS’ instead of MS-DIAL for SWATH-MS or other DIA-MS data. MRMPROBS was originally developed for targeted metabolomics using triple quadrupole MS data (multiple reaction monitoring, MRM; selected reaction monitoring, SRM). It also supports the entire workflow from data import until statistical analysis as MS-DIAL does. Compared to the MS-DIAL program, MRMPROBS is optimized for targeted metabolomics: 1) users can manually curate the peak left- and right edges of chromatographic peaks, 2) users can simultaneously check all samples’ peaks of a targeted compound, and 3) users can easily curate the identification results. http://prime.psc.riken.jp/Metabolomics_Software/MRMPROBS/index.html
本节的目的是宣布“MRMPROBS”而不是MS-DIAL对SWATH-MS或其他DIA-MS数据的效用。MRMPROBS最初是为使用三重四极杆MS数据(多反应监测,MRM;选择反应监测,SRM)的靶向代谢组学而开发的。它还支持从数据导入到统计分析的整个工作流程,就像MS-DIAL一样。与MS-DIAL程序相比,MRMPROBS针对靶向代谢组学进行了优化:1)用户可以手动整理色谱峰的左边缘和右边缘,2)用户可以同时检查目标化合物的所有样品峰,以及3)用户可以轻松整理鉴定结果。http://prime.psc.riken.jp/Metabolomics_Software/MRMPROBS/index.html
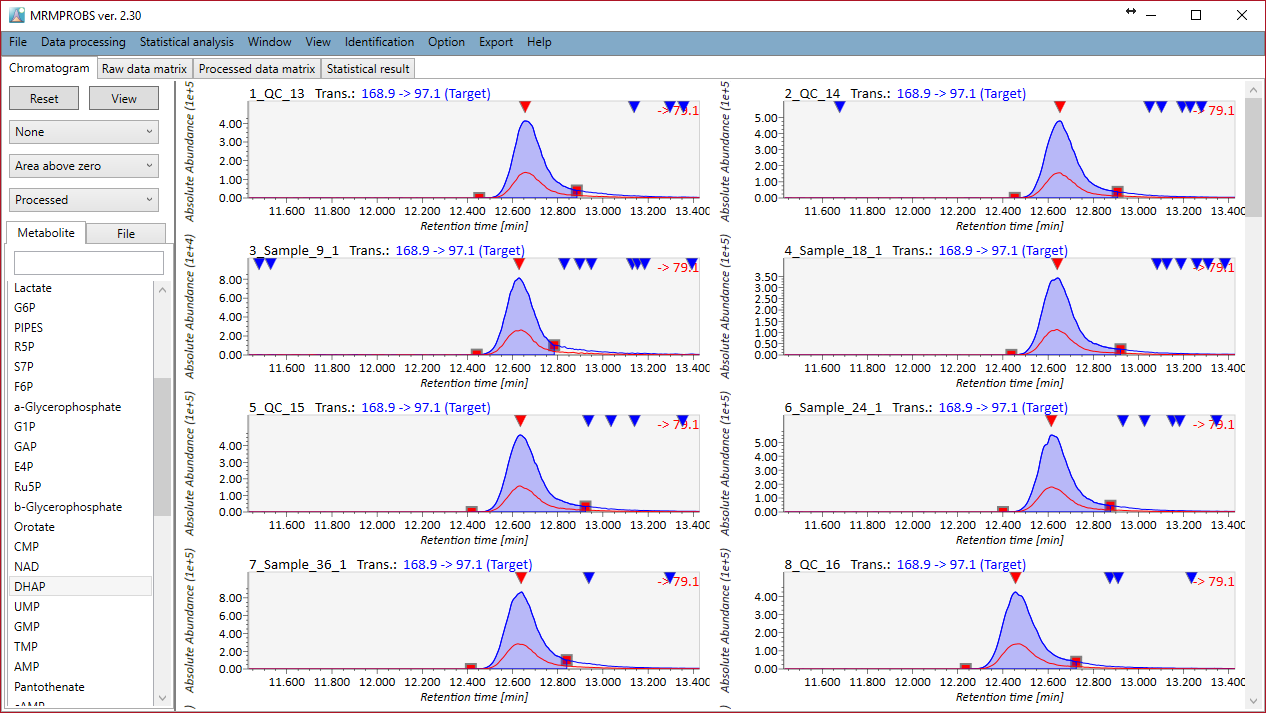
MRMPROBS is now launched as a universal program to deal with DIA-MS data and GC/MS data as well as QqQ-MS data. While the current MS-DIAL program always calculates the peak intensity (height) and peak area of compounds by the survey scan MS1 data, MRMPROBS can utilize the MS/MS chromatograms for metabolite quantifications. In addition, the tools for untargeted analysis like MS-DIAL will often provide the false positive things in the process of peak picking, deconvolution, and peak alignment. In contrast, users can easily parse the targeted compounds with the user-friendly graphical user interface. The ‘bridge’ from MS-DIAL to MRMPROBS was described in next figure. The workflow can also be utilized for GC/MS data. The detail of MRMPROBS is fully described in the tutorial of MRMPROBS program.
MRMPROBS现已作为通用程序推出,用于处理DIA-MS数据和GC/MS数据以及QqQ-MS数据。虽然当前的MS-DIAL程序总是通过调查扫描MS1数据计算化合物的峰强度(高度)和峰面积,但MRMPROBS可以利用MS/MS色谱图进行代谢物定量。此外,MS-DIAL等非靶向分析工具通常会在峰拾取、反卷积和峰对齐过程中提供误报。相比之下,用户可以通过用户友好的图形用户界面轻松解析目标化合物。从MS-DIAL到MRMPROBS的“桥”如下图所示。该工作流程也可用于GC/MS数据。MRMPROBS程序的教程中详细描述了MRMPROBS的细节。
http://prime.psc.riken.jp/Metabolomics_Software/MRMPROBS/index.html
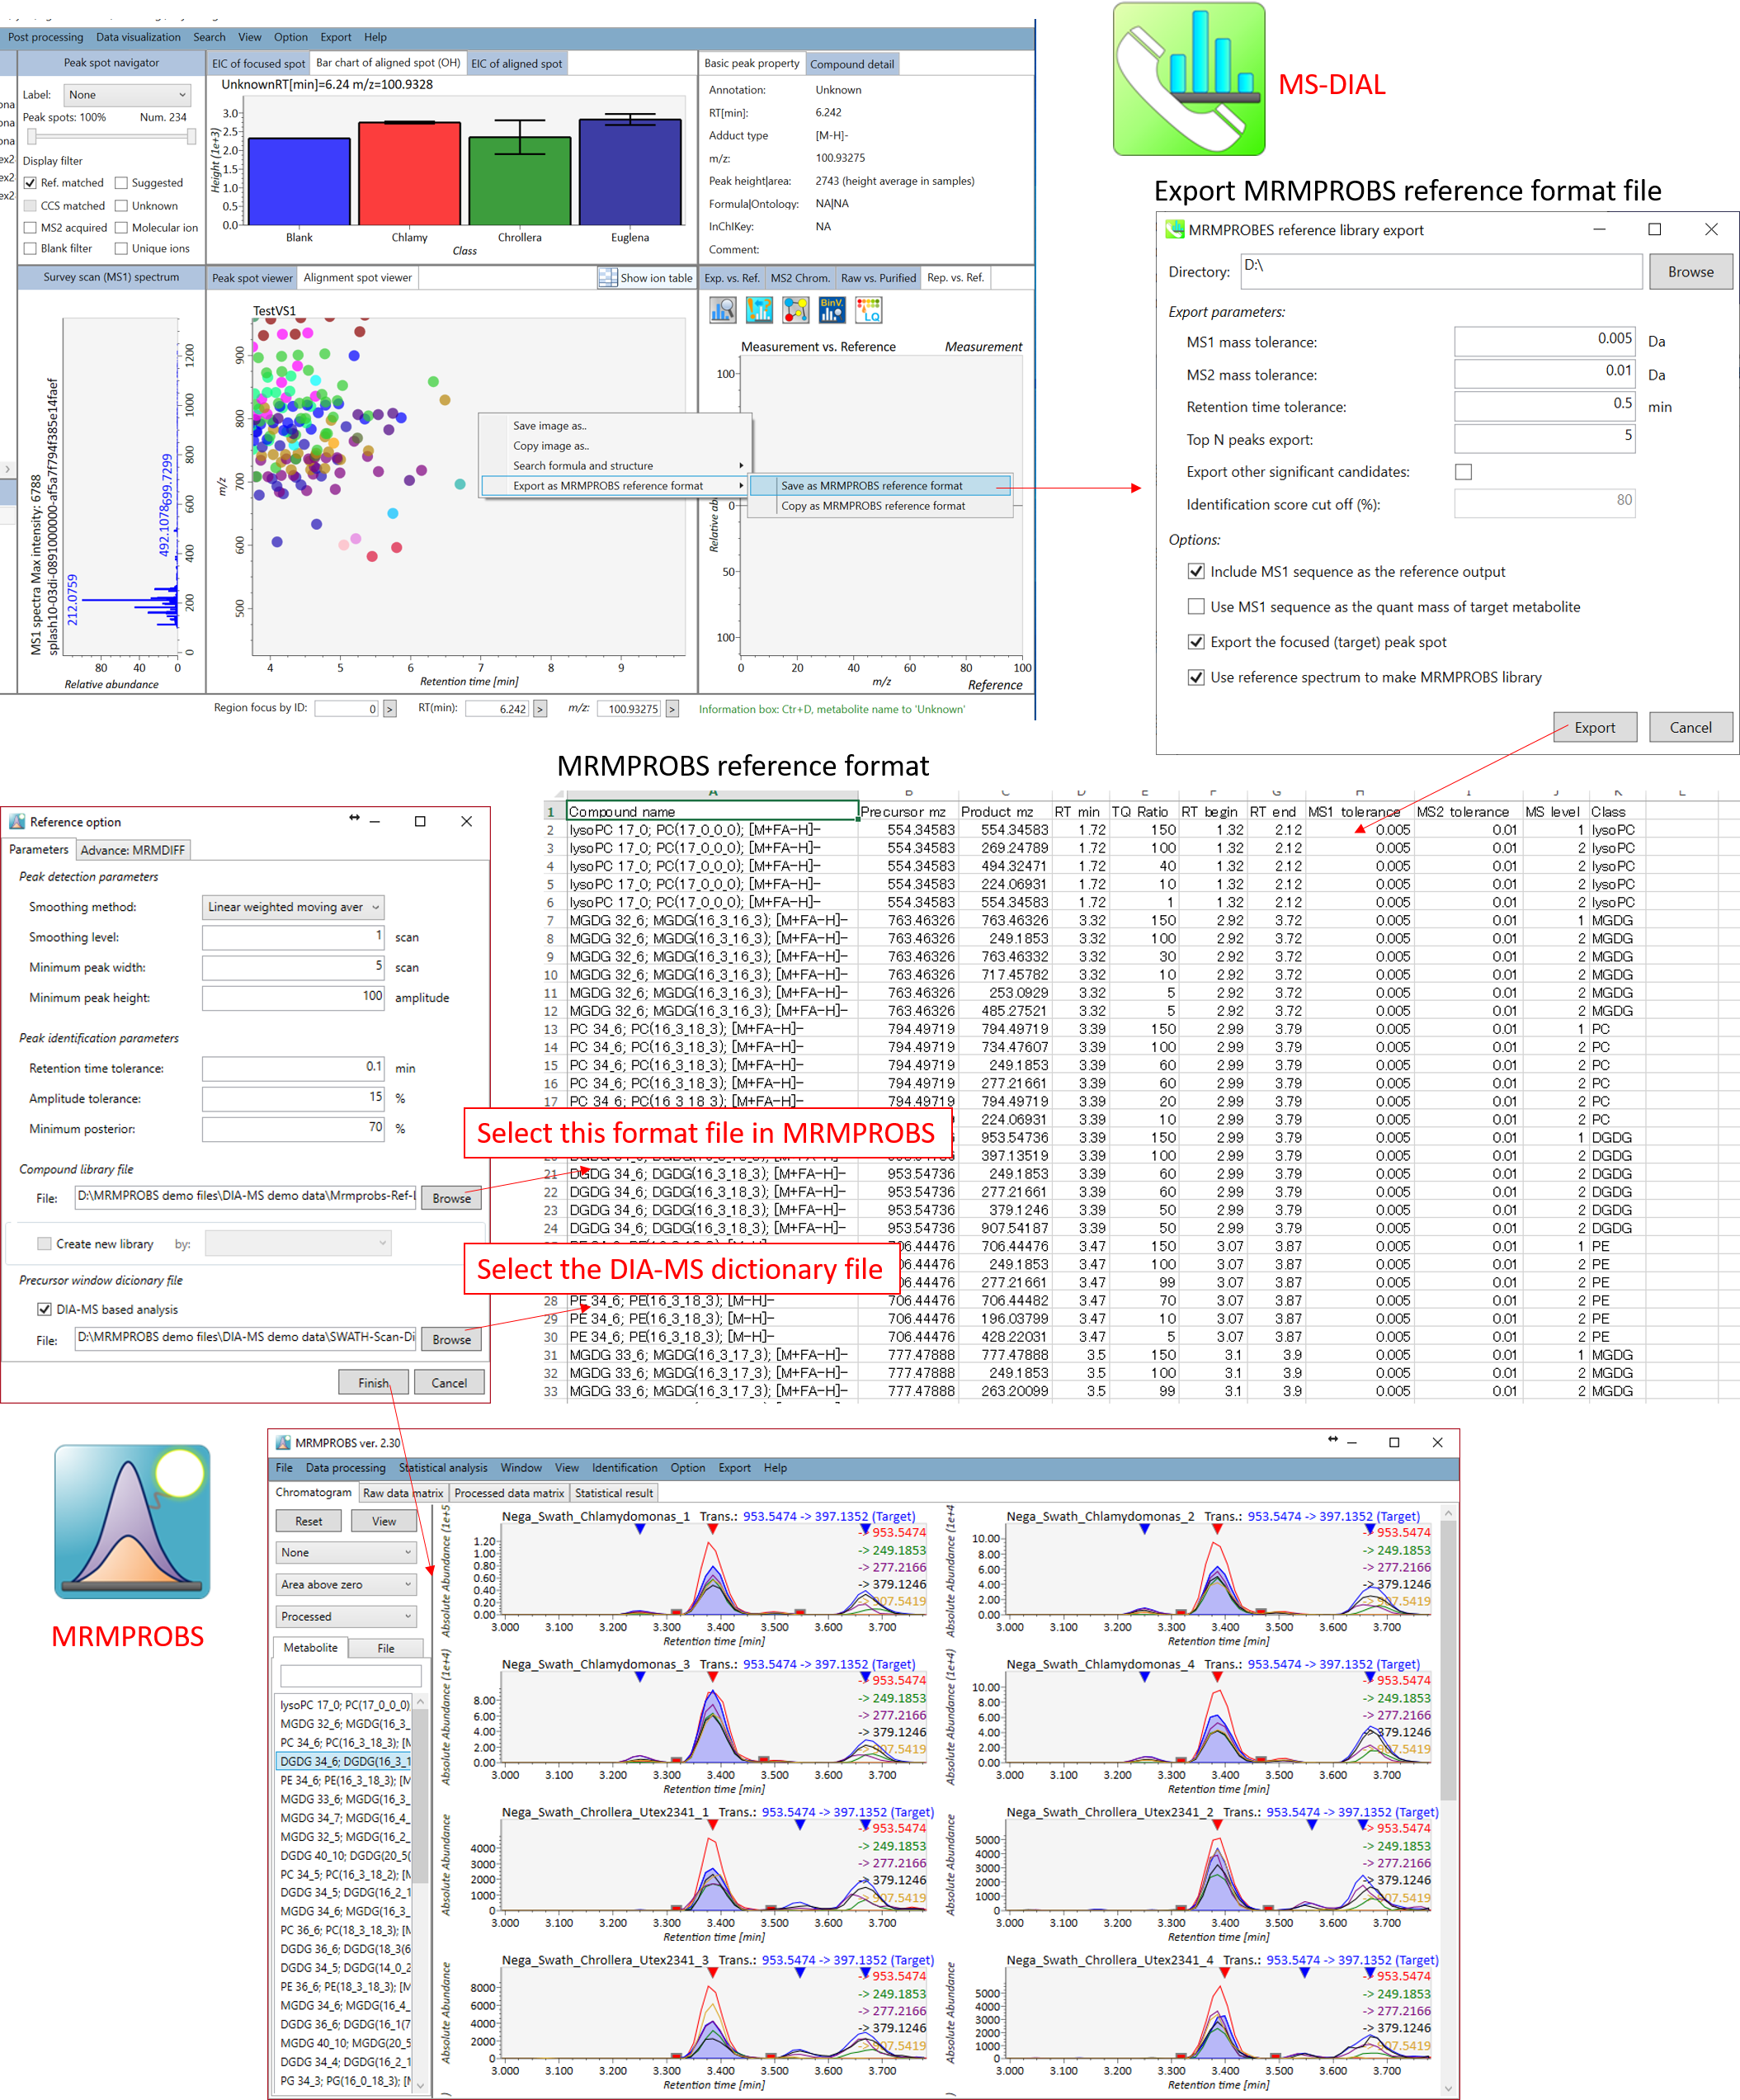 Workflow of the ‘bridge’ from MS-DIAL to MRMPROBS
从MS-DIAL到MRMPROBS的“桥接”工作流程
Section 6-3 第 6-3 节
Molecular spectrum networking for metabolite annotations
用于代谢物注释的分子谱网络
The molecular spectrum networking is a useful technique to get the insight for unknown metabolite structures as used in GNPS and MS2LDA projects. The basic hypothesis is that the mass spectra should be similar (and partially same) among a metabolite subfamily (class). In addition, the metabolic profile’s similarity among aligned ion spots is also a useful information to know the biosynthesis regulations among samples. There are several methods to perform the molecular spectrum networking analysis in MS-DIAL. Note that please set FireFox as the default html viewer for the rapid browsing of your result.
分子光谱网络是一种有用的技术,可用于深入了解 GNPS 和 MS2LDA 项目中使用的未知代谢物结构。基本假设是代谢物亚家族(类)之间的质谱图应该相似(且部分相同)。此外,排列离子斑点之间的代谢谱相似性也是了解样品间生物合成调控的有用信息。有几种方法可以在MS-DIAL中执行分子光谱网络分析。请注意,请将 FireFox 设置为默认的 html 查看器,以便快速浏览结果。
A. Follow as ‘Data visualization’ -> ‘Molecular spectrum networking’. Then, follow the below setting. If you select ‘Alignment spots’, the analysis is performed for the alignment spots displayed in ‘alignment spot viewer’. The mass tolerance [Da] should be the mass accuracy of MS/MS spectrum. For nominal mass GC-MS project, the tolerance should be set to 0.25 Da. The similarity cut off is applied to the score of ‘Bonanza spectral clustering algorithm’ [Falkner, J. A., Falkner, J. W., Yocum, A. K. & Andrews, P. C. J. Proteome Res. 7, 4614–4622 (2008)]: the algorithm is a little bit modified form the original one, and the detail will be described after new paper is published. MS-DIAL also provides the retention time tolerance where the target retention time is defined as what you select in the spot viewer.
A. 遵循“数据可视化”>“分子光谱网络”。然后,按照以下设置进行操作。如果选择“对齐点”,将对“对齐点查看器”中显示的对齐点进行分析。质量允差[Da]应为MS/MS谱图的质量精度。对于标称质量数的GC-MS项目,公差应设置为0.25 Da。相似性截止应用于“富矿光谱聚类算法”的分数 [Falkner, J. A., Falkner, J. W., Yocum, A. K. & Andrews, P. C. J. Proteome Res. 7, 4614–4622 (2008)]:该算法在原始算法的基础上略有修改,细节将在新论文发表后进行描述。MS-DIAL还提供保留时间容差,其中目标保留时间定义为您在Spot查看器中选择的时间。
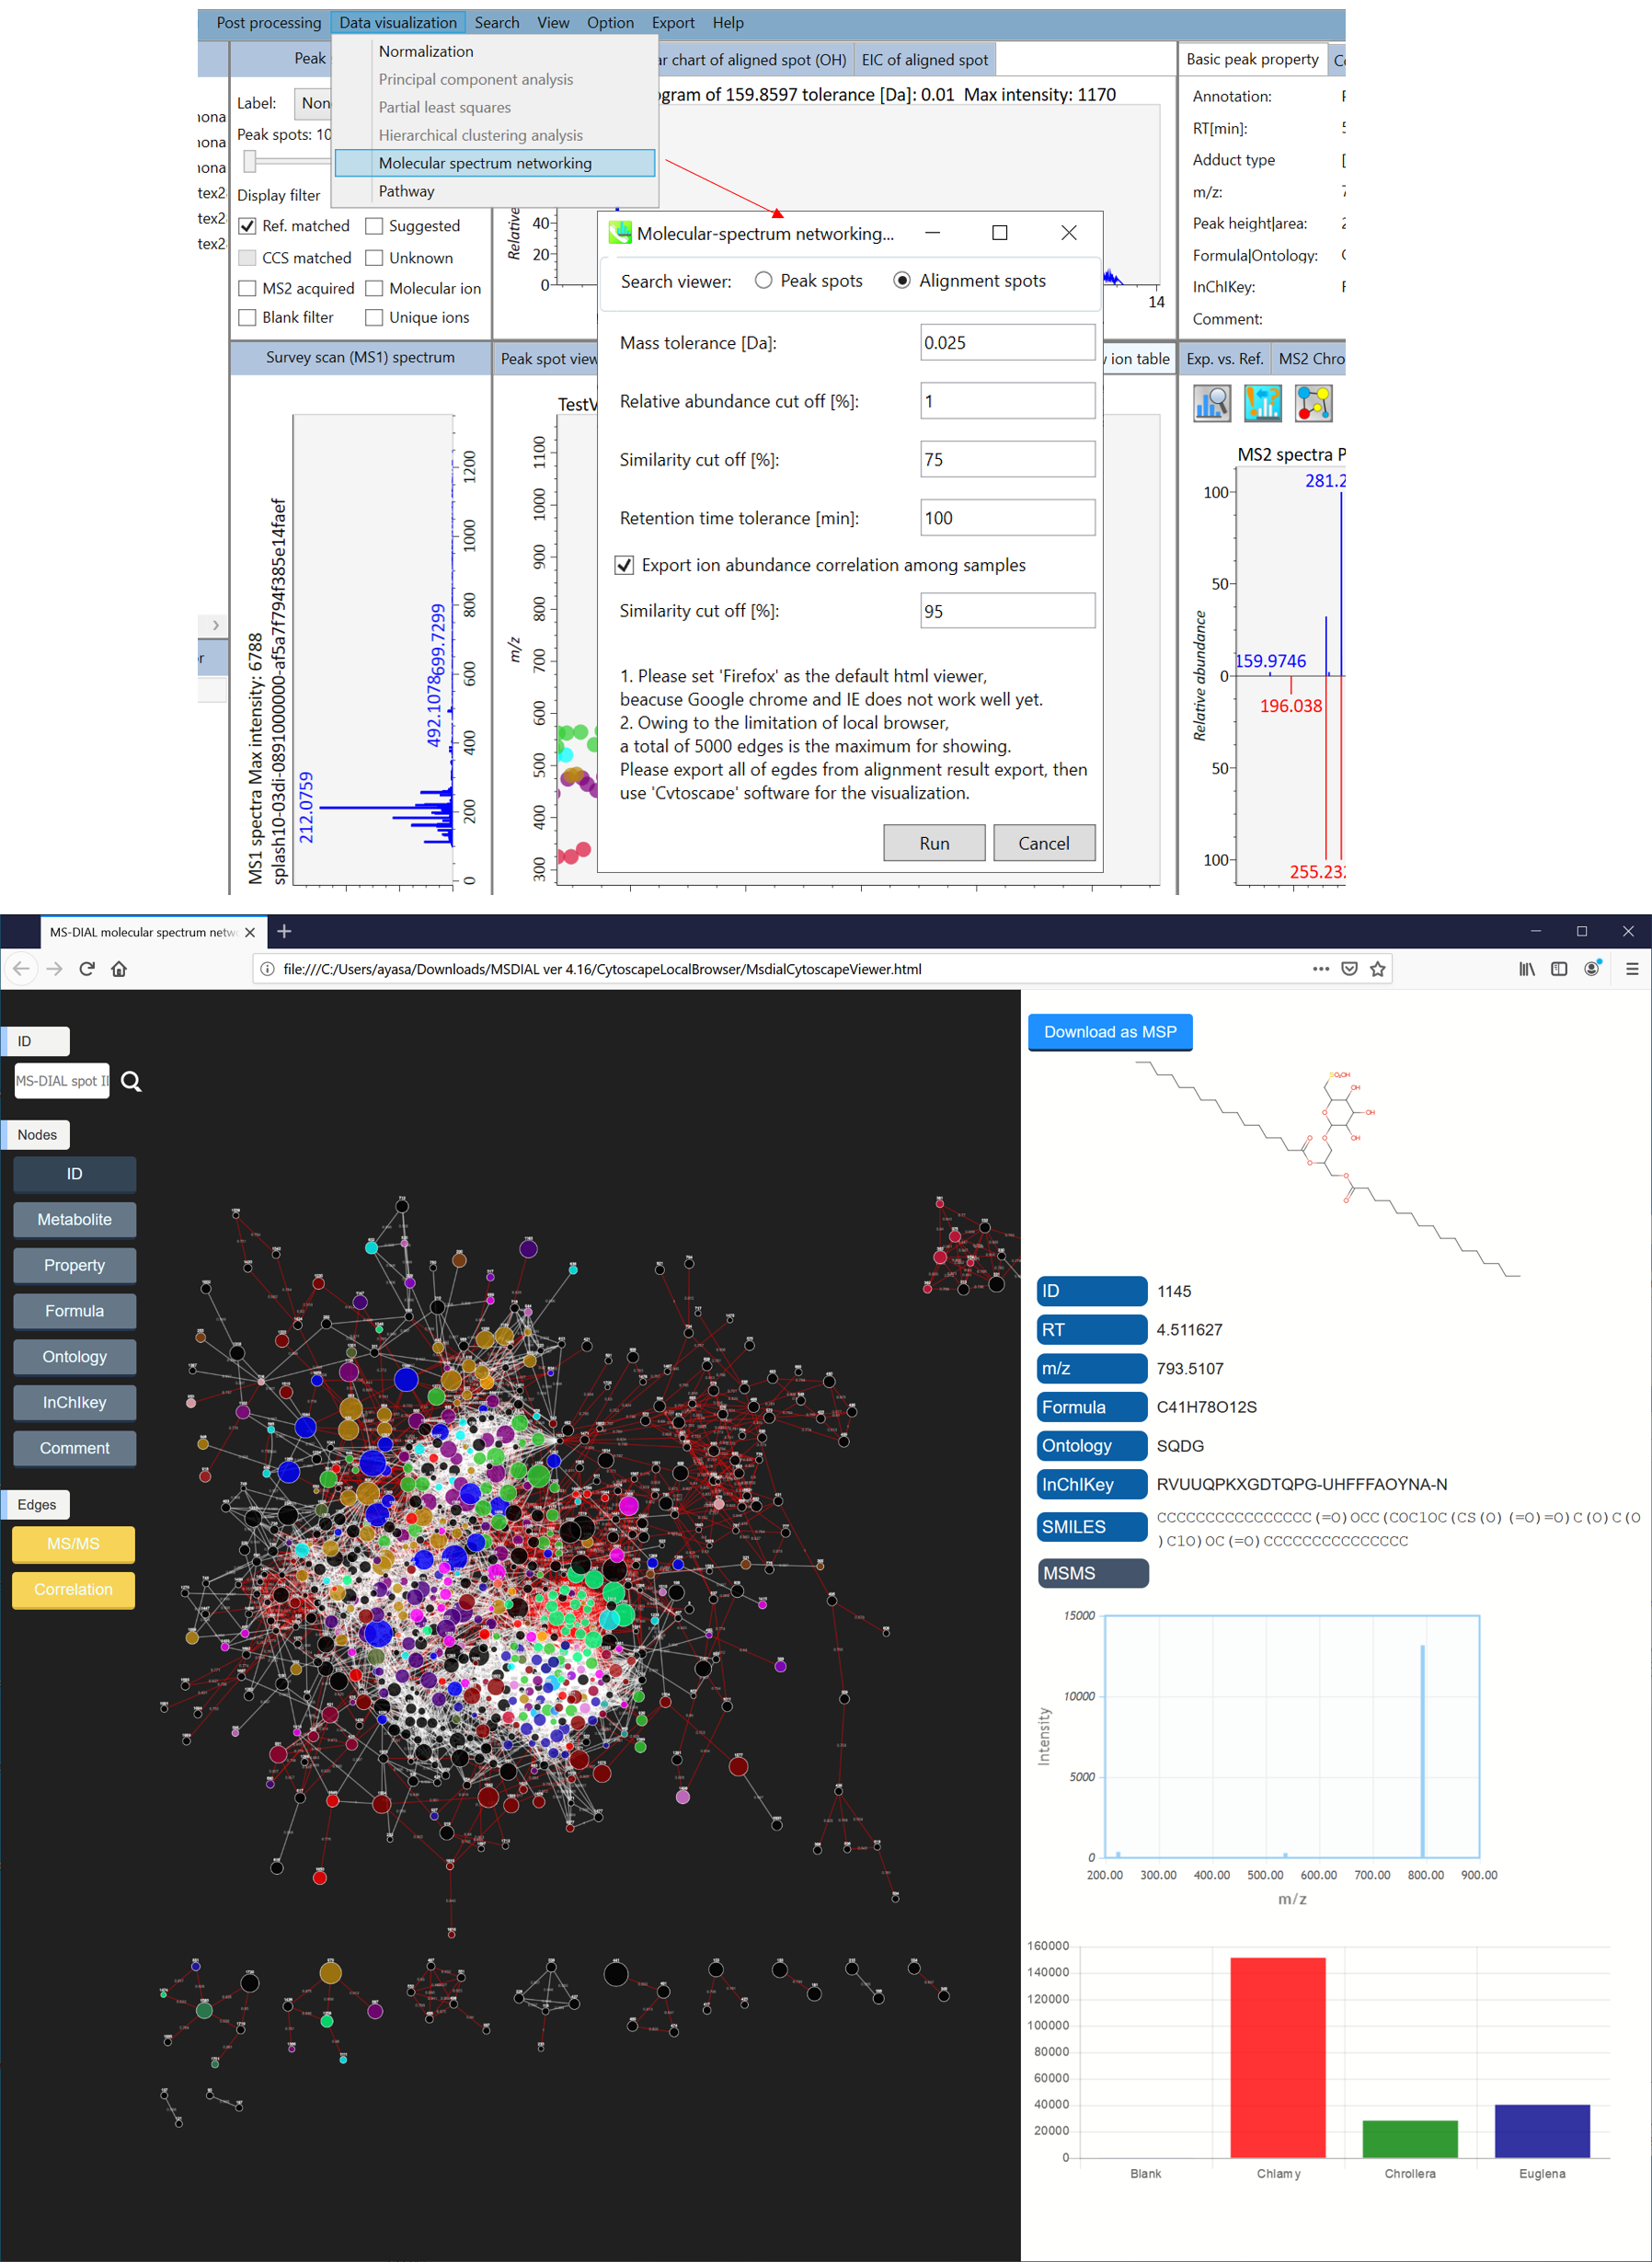
B. Second way to perform the network analysis is to click the network button at the right panel of MS-DIAL as shown below. This method is used to find the spots having similar MS/MS spectrum or similar metabolic profile among samples with the focused spot.
B.执行网络分析的第二种方法是单击MS-DIAL右侧面板上的网络按钮,如下所示。该方法用于在具有聚焦斑点的样品中查找具有相似MS/MS谱图或相似代谢谱的斑点。
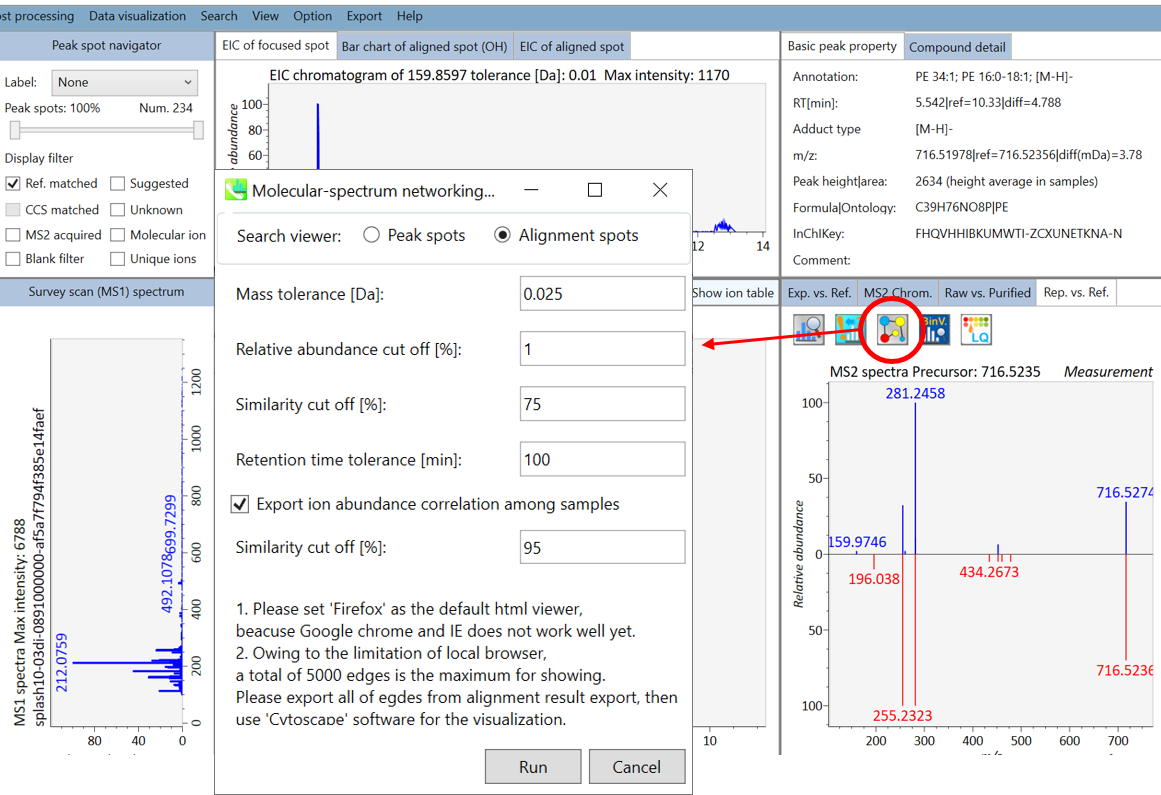
C. Due to the limitation of cytoscape.js as used in A and B, MS-DIAL does not show all of nodes and edges to be used in the network analysis. If you want to use all of information with the flexible graphical user interface, please export the node- and edge files from the export option. The exported results can be imported by the cytoscape program (http://www.cytoscape.org/cy3.html).
C.由于A和B中使用的cytoscape.js的限制,MS-DIDIAL不会显示网络分析中使用的所有节点和边。如果要在灵活的图形用户界面中使用所有信息,请从导出选项中导出节点和边缘文件。导出的结果可以通过 cytoscape 程序 ( http://www.cytoscape.org/cy3.html) 导入。
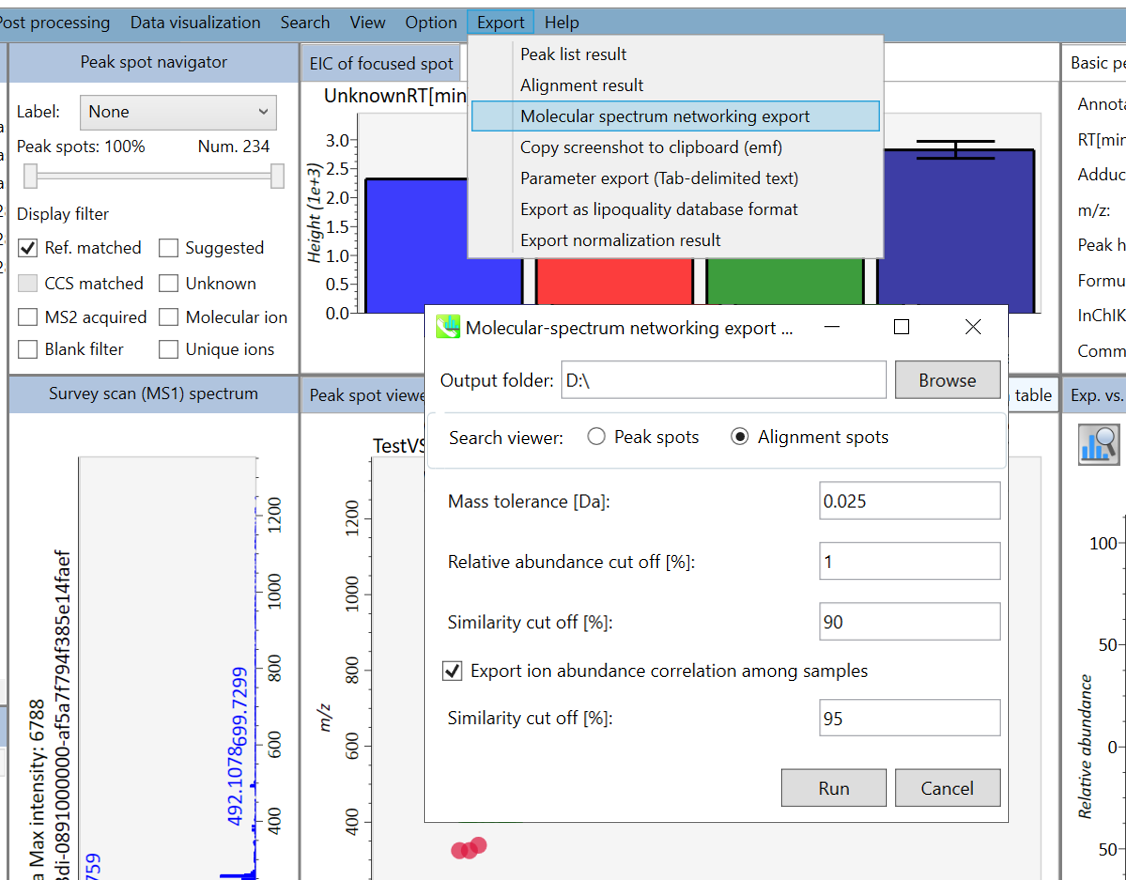
Chapter 7 第7章
MS-DIAL isotope tracking function
MS-DIAL同位素跟踪功能
Stable isotope assisted metabolomics is a great approach to reveal the metabolic turnover of a nutrient source, to calculate flux balances, and to determine the molecular element (CNOS) of unknown molecules. Here, a project using LC-MS/MS data sets of non-labeled- and fully 13C labeled Arabidopsis thaliana samples for the comprehensive annotation of plant specialized metabolites is demonstrated. The purpose of this study was to determine the carbon element count of molecular formula by using 13C labeled plant tissues. The files used for this demonstration can be downloaded from http://prime.psc.riken.jp/Metabolomics_Software/MS-DIAL/index.html.
稳定同位素辅助代谢组学是揭示营养来源代谢周转、计算通量平衡和确定未知分子的分子元素 (CNOS) 的好方法。在这里,展示了一个使用非标记和完全13C标记的拟南芥样品的LC-MS / MS数据集进行植物特化代谢物综合注释的项目。本研究的目的是利用13C标记的植物组织测定分子式的碳元素计数。用于此演示的文件可以从 http://prime.psc.riken.jp/Metabolomics_Software/MS-DIAL/index.html 下载。
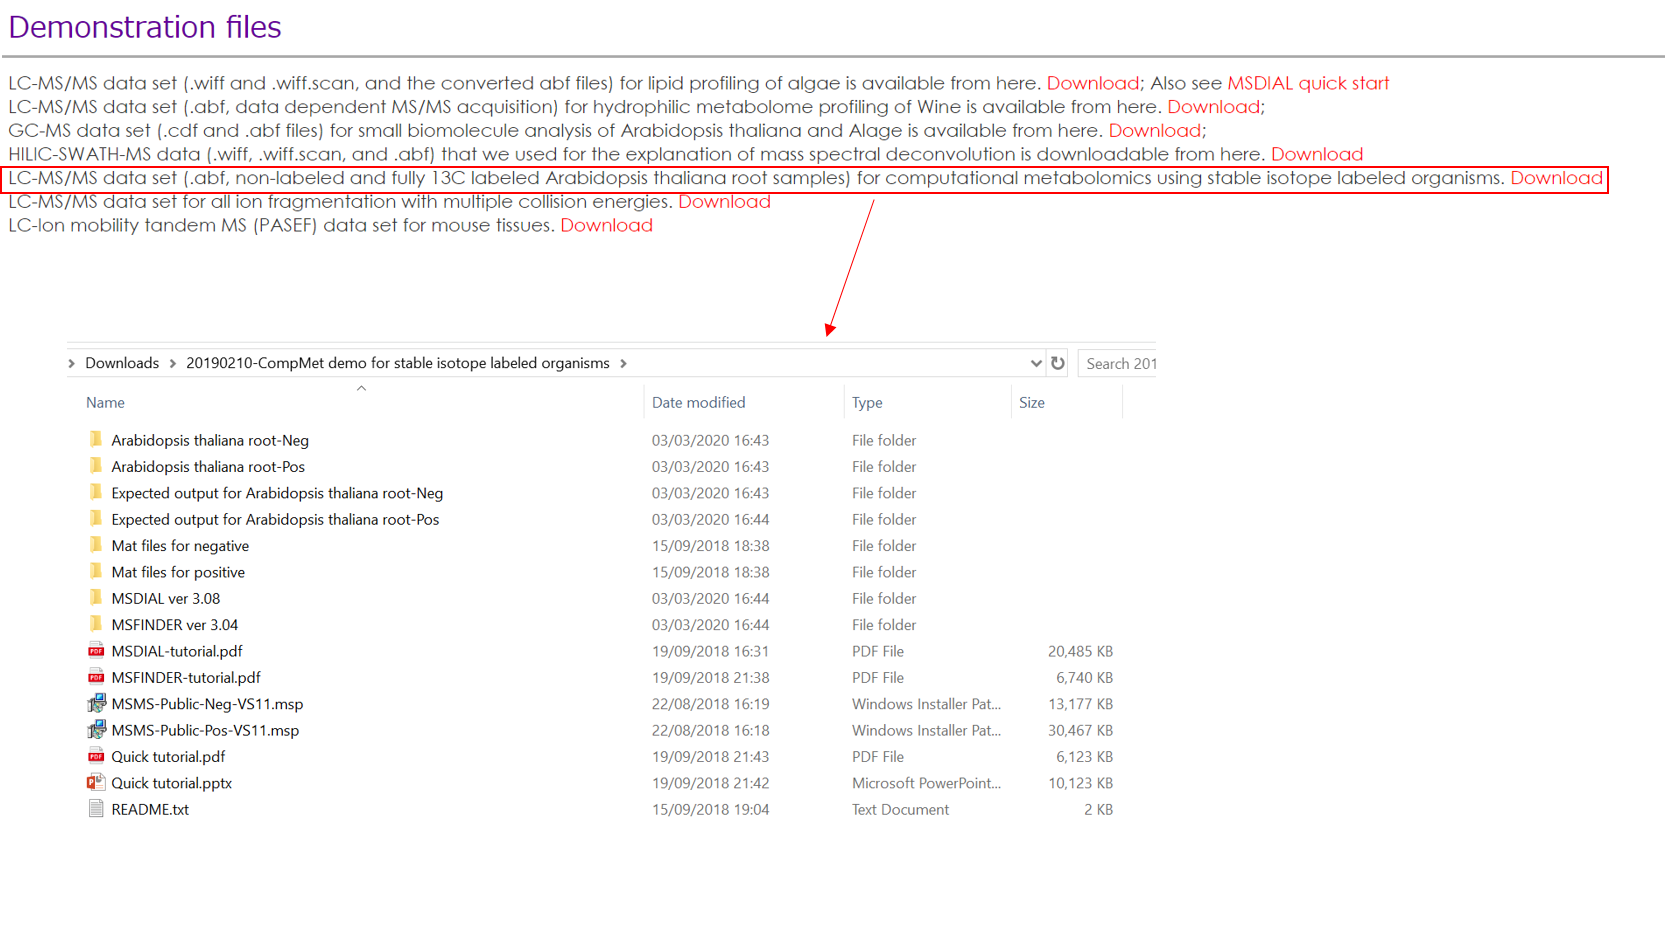
Please see our paper (Tsugawa et al. (2019) A cheminformatics approach to characterize metabolomes in stable-isotope-labeled organisms. Nature Methods volume 16, pages295–298) for detailed analysis method. Here we use two demonstration files in the folder named Arabidopsis thaliana root-Neg.
请参阅我们的论文(Tsugawa et al. (2019) 一种表征稳定同位素标记生物体中代谢组的化学信息学方法。Nature Methods 第 16 卷,第 295–298 页)的详细分析方法。在这里,我们在名为拟南芥根-负的文件夹中使用两个演示文件。
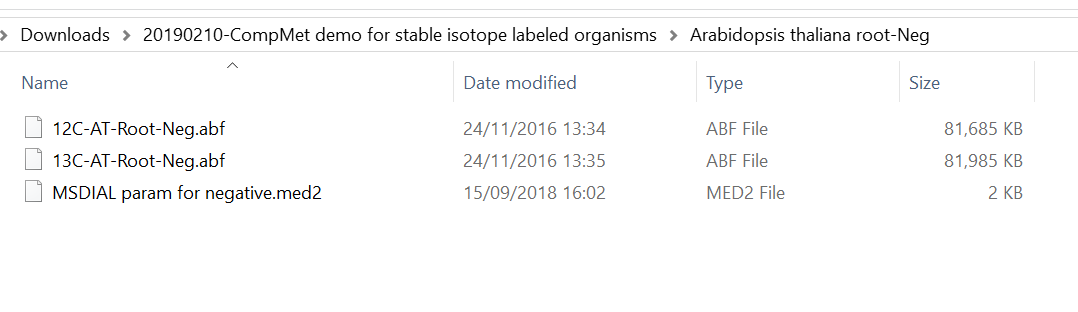
Section 7-1 第7-1节
Starting up your project
启动项目
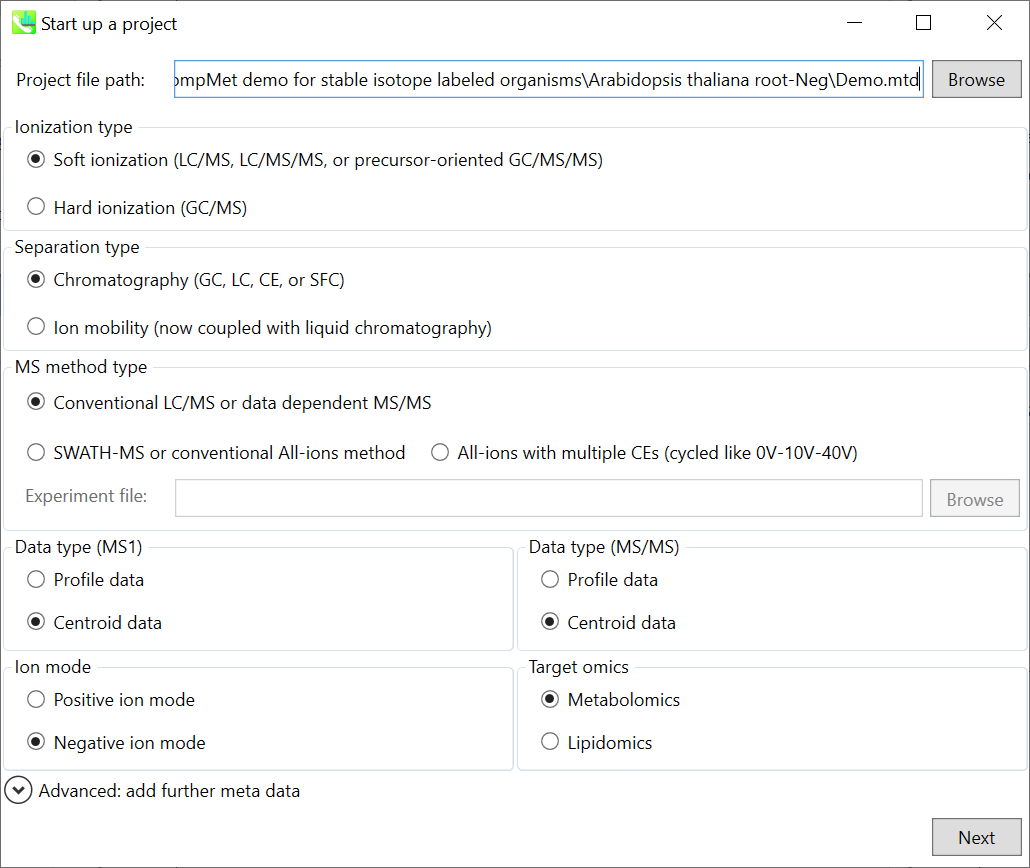
File -> new project
文件 -> 新项目
Set your project file path to the directory of your ABF files
将项目文件路径设置为 ABF 文件的目录
Select your ionization type as soft ionization
选择您的电离类型为软电离
Choose data type centroid data
选择数据类型质心数据
Choose negative ion mode
选择负离子模式
Section 7-2 第 7-2 节
Importing ABF files 导入 ABF 文件
Select ABF files 选择 ABF 个文件
Class ID in this demonstration is set to ‘Non-labeled’ and ‘Uniform-labeled’.
本演示中的类 ID 设置为“无标签”和“统一标签”。
Note: Please finalize your file name here, because you cannot change it later.
注意:请在此处完成您的文件名,因为您以后无法更改它。
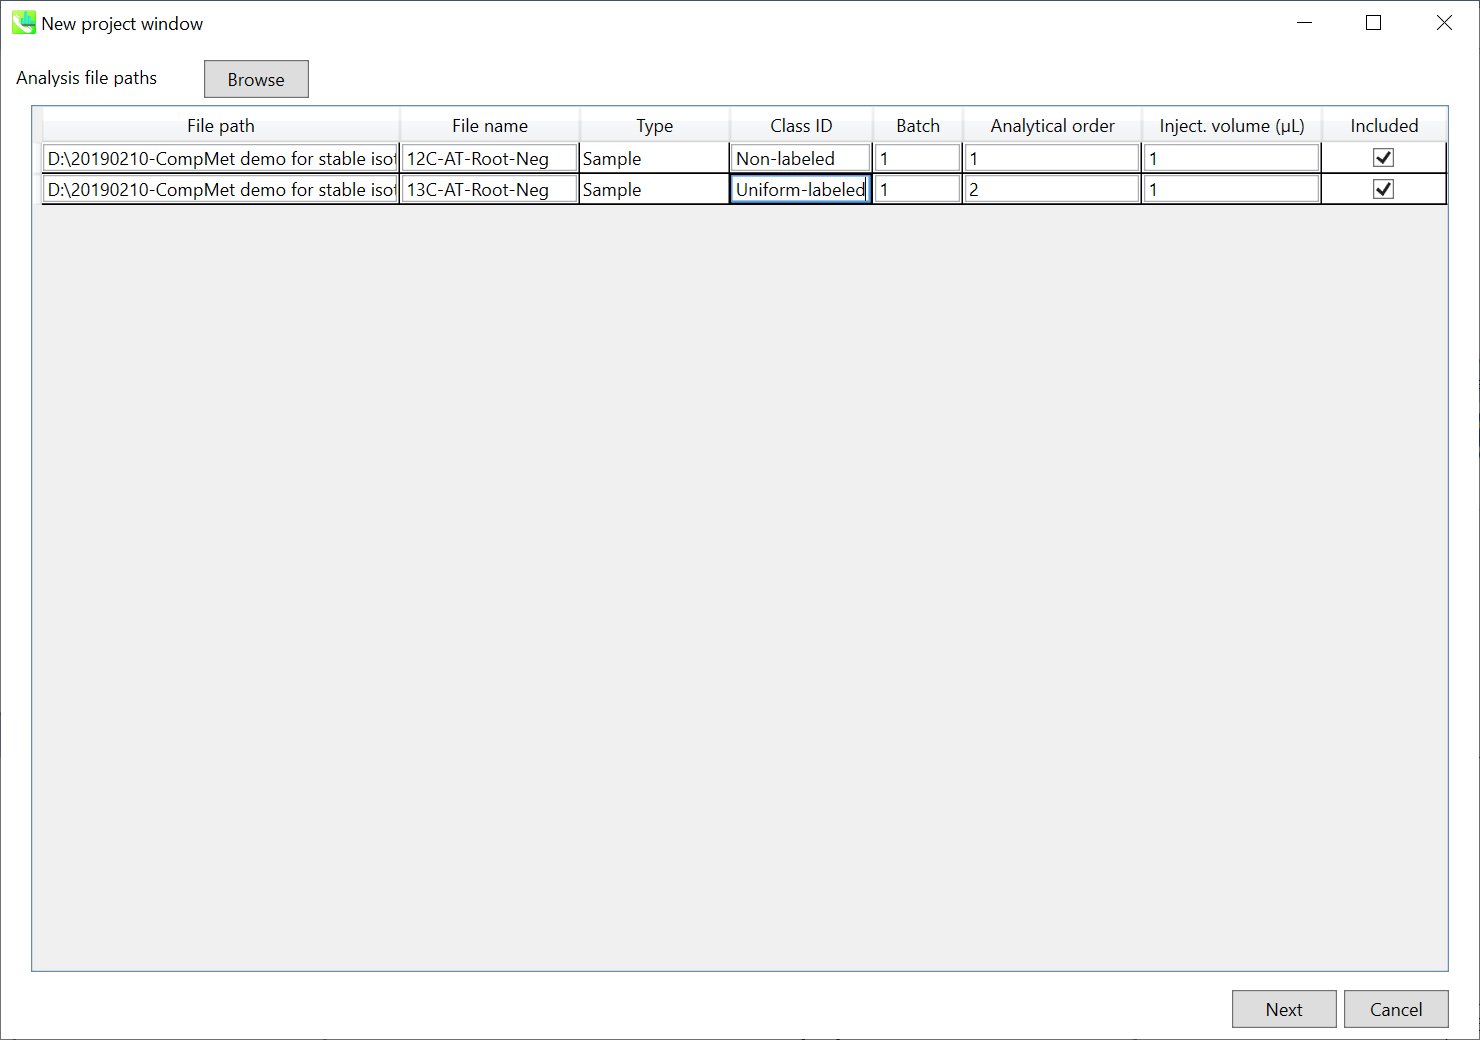
Section 7-3 第 7-3 节
Setting parameters 设置参数
Section 7-3-1 第 7-3-1 节
Data collection tab “数据收集”选项卡
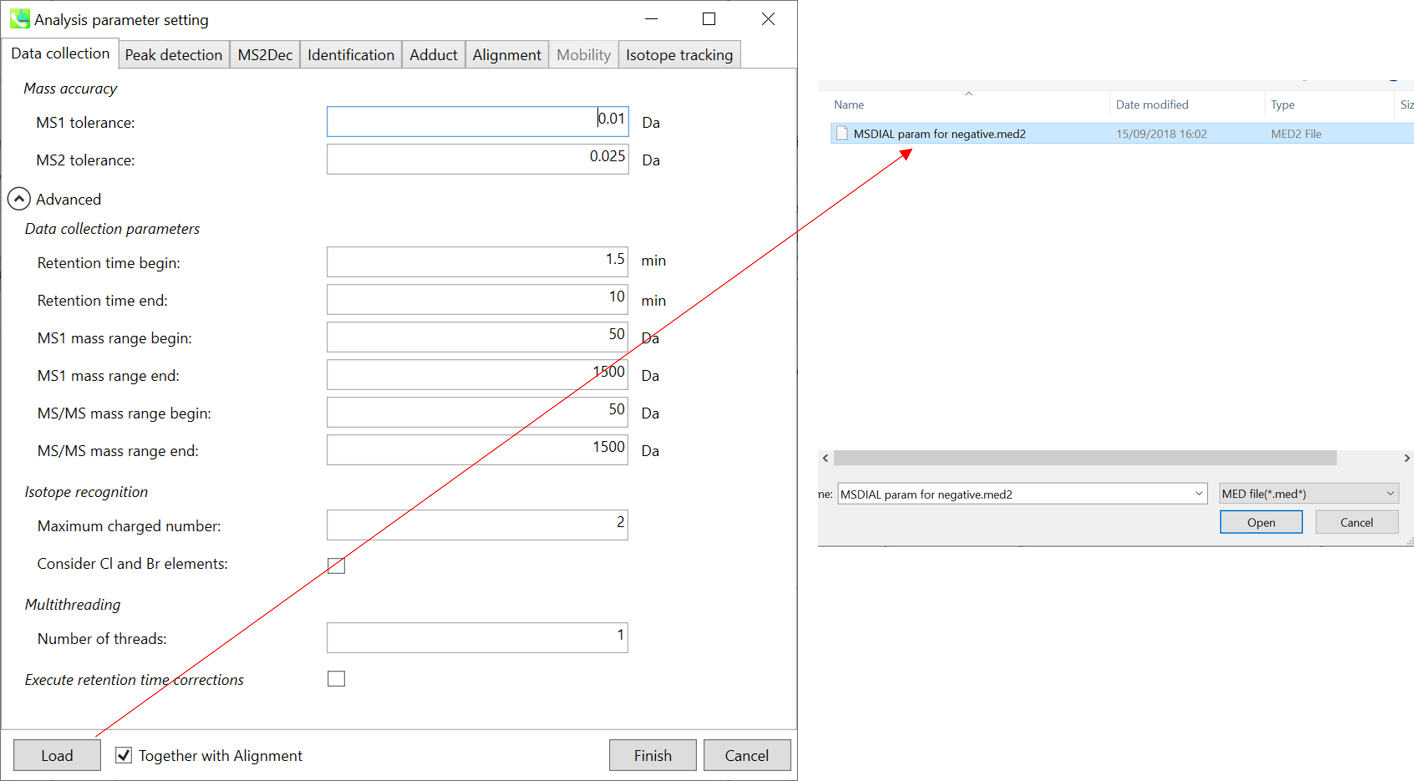
* For the quick start and its explanations, load ‘MSDIAL param for negative.med2’ as shown above.
* 有关快速入门及其说明,请加载 'MSDIAL param for negative.med2',如上所示。
Mass accuracy: After the peak detection algorithm is applied along the MS axis with a very low threshold, MS-DIAL performs spectral centroiding if your files are profile data. By default, mass spectrum of ±0.01 and ±0.025 Da range from each peak top is integrated in MS1 and MS2, respectively.
质量精度:在沿MS轴以非常低的阈值应用峰值检测算法后,如果您的文件是轮廓数据,MS-DIAL将执行光谱质心。默认情况下,MS1 和 MS2 中分别积分了每个峰顶的 ±0.01 和 ±0.025 Da 范围的质谱图。
Data collection parameters: You can set analysis ranges (RT, MS1 and MS/MS axis). Here, set 1.5-10.5 min, 50-1500 Da and 50-1500 Da for the ranges.
数据采集参数:可设置分析范围(RT、MS1、MS/MS轴)。在这里,设置范围为 1.5-10.5 分钟、50-1500 Da 和 50-1500 Da。
Isotope recognition: As long as you focus on small molecule researches (less than 2000 Da), Maximum charged number can be set to 2. On the other hand, the parameter can be changed to 8 or more to process proteome or snRNA research data.
同位素识别:只要专注于小分子研究(小于2000 Da),最大充电数可以设置为2。另一方面,可以将参数更改为 8 或更多以处理蛋白质组或 snRNA 研究数据。
Check Consider Cl and Br elements if you assume that your samples contain any halogen element as halogens have unique characteristic of isotope.
如果您假设您的样品含有任何卤素元素,请选中考虑 Cl 和 Br 元素,因为卤素具有同位素的独特特性。
Multithreading: Please set the count of threads that you want to use. You can check the maximum thread counts in resource monitor. (open task manager->open resource monitor)
多线程:请设置要使用的线程数。您可以在资源监视器中检查最大线程计数。(打开任务管理器->打开资源监视器)
Execute retention time corrections: For detail, visit ‘The tutorial and parameter files for MS-DIAL ALF dataprocessing and spectral library construction methodology’ in the website of MS-DIAL shown below(URL: http://prime.psc.riken.jp/Metabolomics_Software/MS-DIAL/).
执行保留时间校正:有关详细信息,请访问如下所示的MS-DIAL网站中的“MS-DIAL ALF数据处理和谱库构建方法的教程和参数文件”(URL:http://prime.psc.riken.jp/Metabolomics_Software/MS-DIAL/)。
Section 7-3-2 第 7-3-2 节
Peak detection tab and MS2Dec tab
峰值检测选项卡和 MS2Dec 选项卡
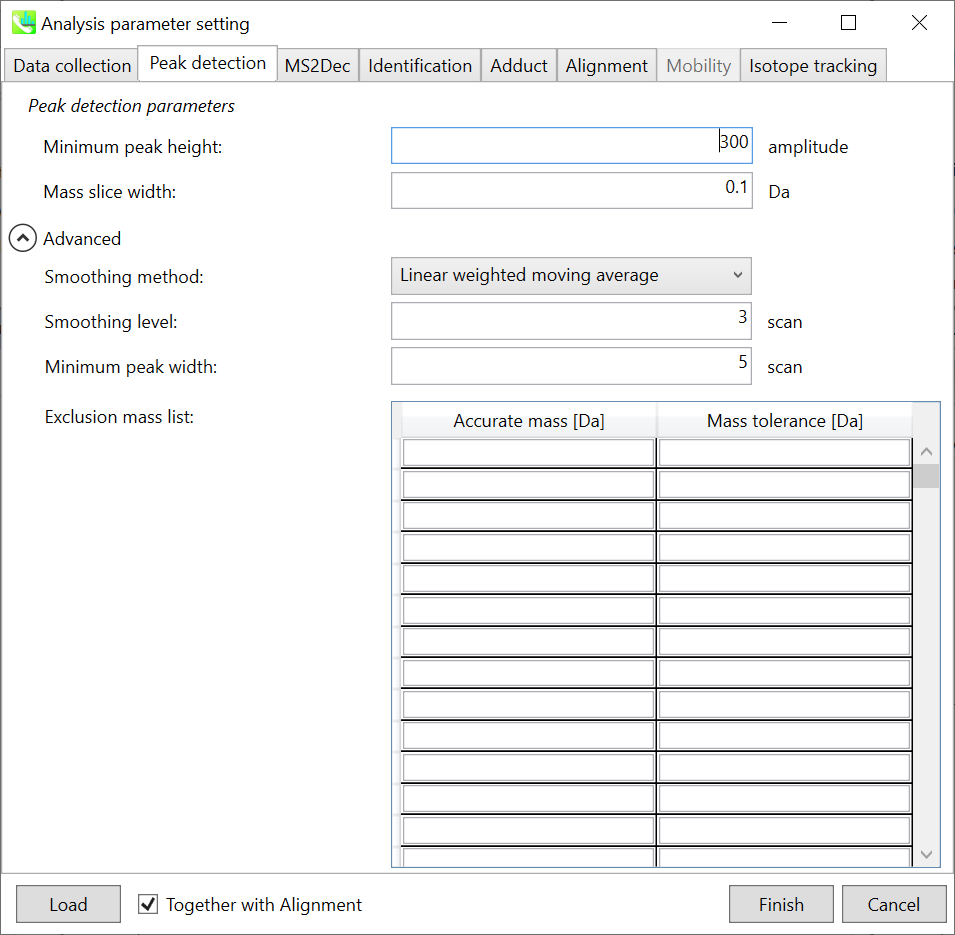
The details are described in Chapter 2&3. In Waters and Bruker QTOF, the minimum peak height can be set to 300-500 as long as I confirmed. Here, 300 is set for minimum peak height because the demonstration file was obtained by Waters Xevo QTOF.
详细信息在第 2 章和第 3 章中描述。在Waters和Bruker QTOF中,只要我确认,最小峰高可以设置为300-500。这里,最小峰高设置为300,因为演示文件是由Waters Xevo QTOF获得的。
Section 7-3-3 第 7-3-3 节
Identification tab “标识”选项卡
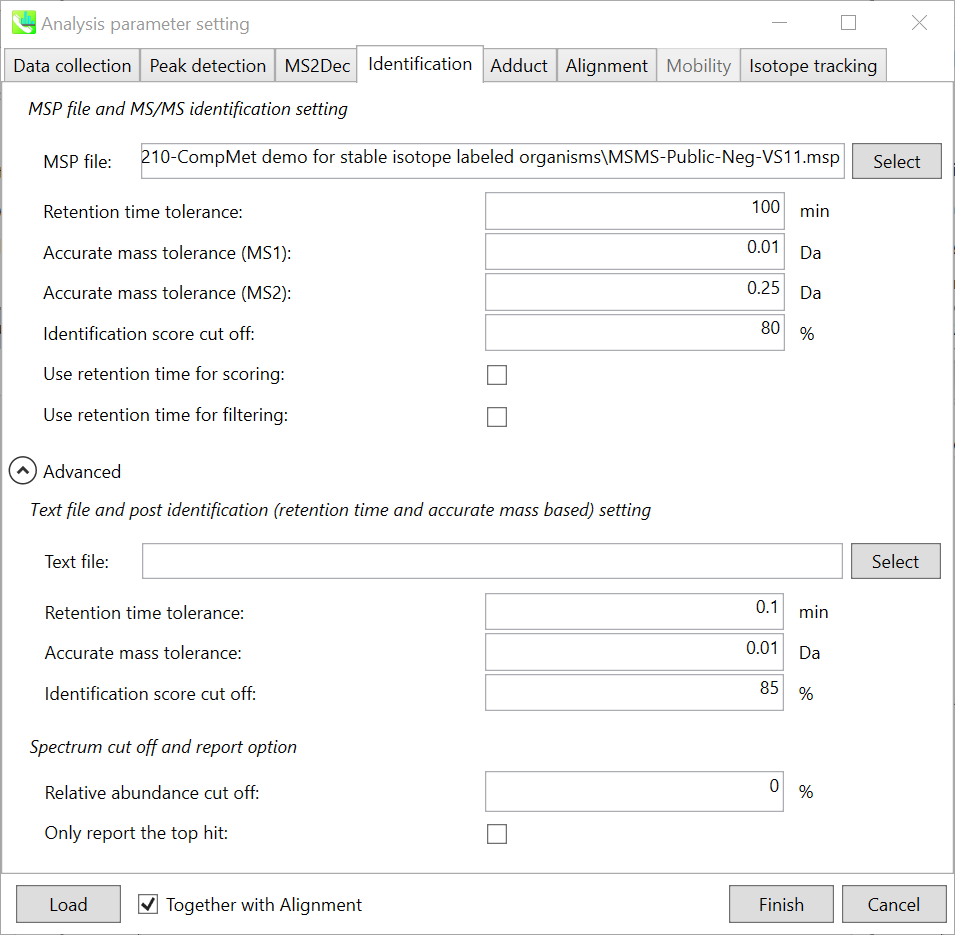
MSP file: Set your MSP file here. (Tutorial data: MSMS-Public-Neg-VS11.msp.)
MSP 文件:在此处设置您的 MSP 文件。(教程数据:MSMS-Public-Neg-VS11.msp。
Use retention information for scoring: Normally, there is no compatibility for retention time in LC-MS project in contrast to GC-MS. Therefore, the checkbox of ‘Use retention information for scoring’ was recently prepared. If the checkbox is unchecked, the scoring of retention time is not used for the calculation of total score which is used for the identification cut off.
使用保留信息进行评分:通常,与GC-MS相比,LC-MS项目中的保留时间不兼容。因此,最近准备了“使用保留信息进行评分”复选框。如果未选中该复选框,则保留时间的评分不会用于计算用于识别截止的总分。
Text file and post identification (retention time and accurate mass based) setting:
文本文件和柱子识别(保留时间和基于质量的准确)设置:
If you want to perform “post identification” processing, set your text file in Text file. (There is no file in this Tutorial data)
如果要执行“识别后”处理,请在“文本文件”中设置文本文件。(本教程数据中没有文件)
The meanings of parameters are the same as MSP based identification explained above.
参数的含义与上面解释的基于MSP的识别相同。
Spectrum cut off and report option:
频谱截止和报告选项:
The mass spectrum peak less than the user-defined value in Relative abundance cut off will not be used for the MS/MS similarity calculation.
小于相对丰度截止值中用户定义值的质谱图峰将不用于MS/MS相似性计算。
Since some chromatogram peaks will be annotated as the same compound from the identification algorithm, this Only report the top hit option allows us to determine only one candidate from such multiple results by means of the identification score.
由于某些色谱峰将在鉴定算法中被注释为同一化合物,因此“仅报告最热门”选项允许我们通过鉴定分数从此类多个结果中仅确定一个候选化合物。
Section 7-3-4 第 7-3-4 节
Adduct tab 加合物选项卡
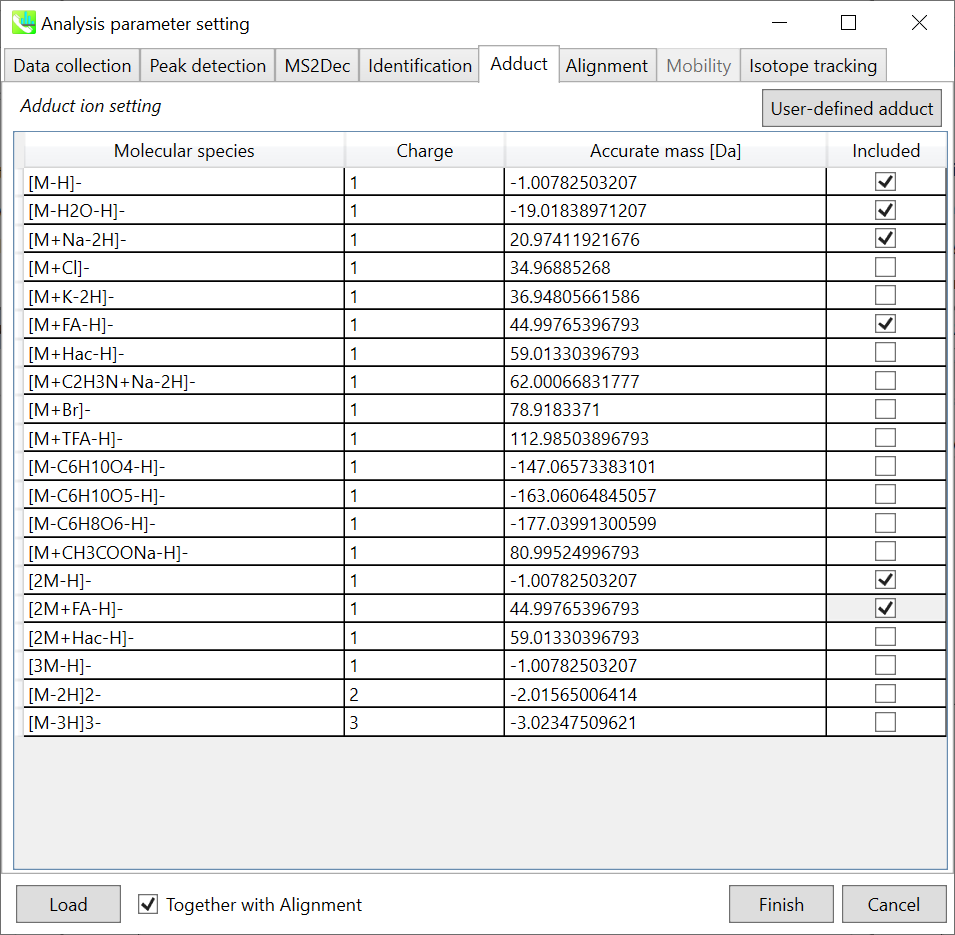
You can tick the adduct ions and charge values to be considered. In doing the metabolome analysis for plant specialized metabolites, the losses for C6H10O4, C6H10O5, and C6H8O6 etc may be added because there are many in source fragment ions detected in hexosylmetabolites.
您可以勾选要考虑的加合离子和电荷值。在对植物特化代谢物进行代谢组分析时,可能会添加C6H10O4、C6H10O5和C6H8O6等的损失,因为在己糖基代谢物中检测到许多源碎片离子。
Section 7-3-5 第 7-3-5 节
Alignment tab “对齐方式”选项卡
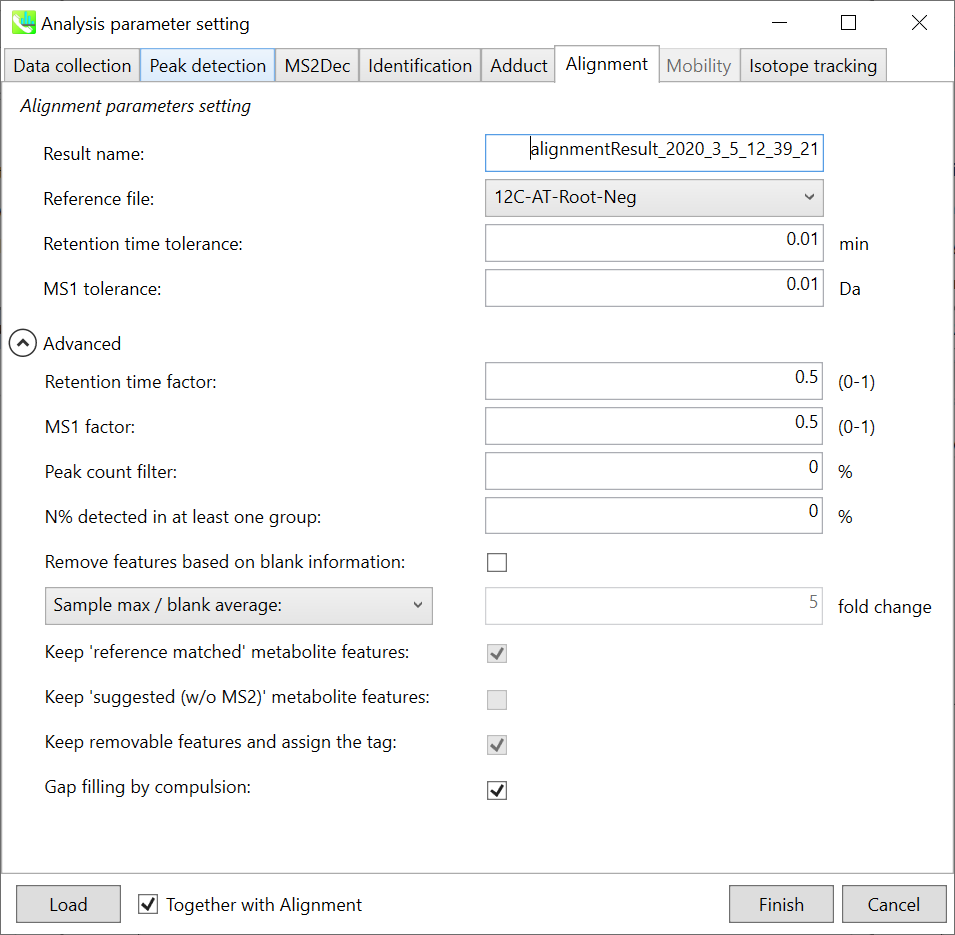
Parameters: The details of alignment parameter are shown in chapter 2 and 3.
参数:对齐参数的详细信息见第 2 章和第 3 章。
Note: Please set one of ‘non-labeled’ biological samples as the reference file when the isotope tracking function is used.
注意:使用同位素跟踪功能时,请将其中一个“未标记”的生物样品设置为参考文件。
Section 7-3-6 第 7-3-6 节
Isotope tracking tab “同位素跟踪”选项卡
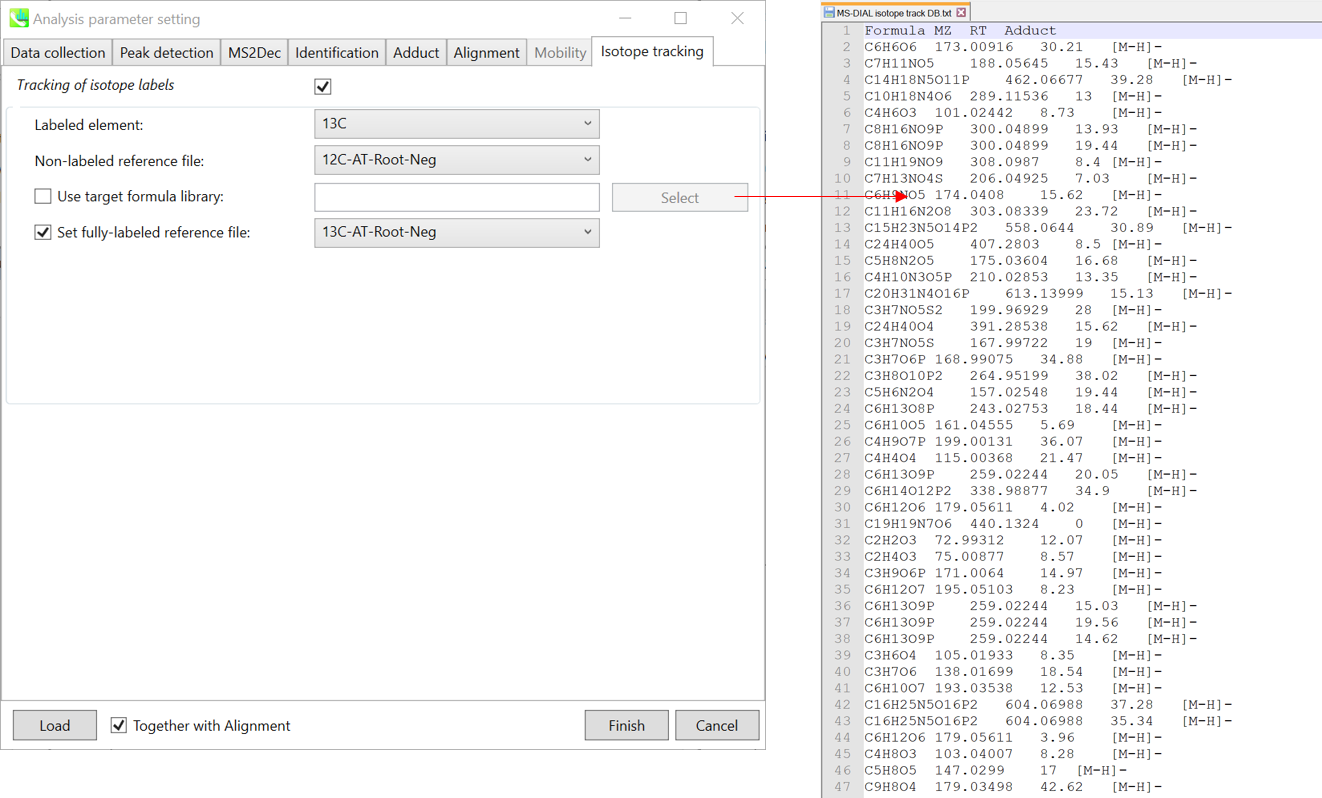
When the isotope tracking function is used, check ‘Tracking of isotope labels’. And select your labeled element (in this project, select ‘13C’). Currently, MS-DIAL requires at least one ‘non-labeled’ sample data in order to know which peaks should be considered as ‘baseline’.
使用同位素跟踪功能时,请勾选“同位素标签跟踪”。然后选择带标签的元素(在此项目中,选择“13C”)。目前,MS-DIAL需要至少一个“非标记”样本数据,以便知道哪些峰应被视为“基线”。
If you have the targeted formula list as shown above (top-right), please make the tab-delimited text file containing (first column) formula, (second column) m/z, (third column) retention time, and (last column, as option) adduct type. MS-DIAL will first identify the metabolites for non-labeled reference file by means of the library, and then, the isotope recognitions are performed.
如果您有如上图所示的目标公式列表(右上角),请制作制表符分隔的文本文件,其中包含(第一列)公式、(第二列)m/z、(第三列)保留时间和(最后一列,作为选项)加合物类型。MS-DIAL将首先通过文库鉴定非标记参考文件的代谢物,然后进行同位素识别。
If you have fully labeled sample data, check ‘set fully-labeled reference file’, and then, select one of the fully labeled sample data. In this demonstration, please follow the above setting (the targeted formula list is not prepared).
如果已完全标记示例数据,请选中“设置完全标记的参考文件”,然后选择一个完全标记的示例数据。在此演示中,请按照上述设置进行操作(未准备目标公式列表)。
Section 7-4 第 7-4 节
Data curation for isotope tracking result
同位素跟踪结果的数据管理
The result can be checked as described below. Practically, I recommend the following procedures for the data analysis of isotope labeled metabolomics.
可以按如下说明检查结果。实际上,我建议采用以下程序进行同位素标记代谢组学的数据分析。
It’s much better ‘NOT’ to perform the peak alignment at the first run of data analysis. It means that please perform peak spotting only.
最好在第一次运行数据分析时执行峰对齐。这意味着请仅执行峰值发现。
Then, please curate the identification result for non-labeled reference file because the identification result is reflected in the alignment result.
然后,请整理未标记参考文件的识别结果,因为识别结果会反映在对齐结果中。
After the curation is finished, run the peak alignment function with the setting of isotope tracking function.
整理完成后,使用同位素跟踪功能的设置运行峰对齐功能。
As described in next page, please check ‘Filtering by the result of isotope labeled tracking’ in the alignment result export. Of course, if you are a programmer, you do not check it because you can do the filtering method by yourself.
如下一页所述,请在对齐结果导出中勾选“按同位素标记跟踪结果过滤”。当然,如果你是一个程序员,你不要检查它,因为你可以自己做过滤方法。
Moreover, if you do right click at the panel of alignment spot viewer, then, follow as ‘Search formula and structure’ -> ‘Add components to search list’, you will get the mat files containing the information of determined carbon element number to be used in MS-FINDER.
此外,如果您右键单击对齐点查看器的面板,然后按照“搜索公式和结构”>“将组件添加到搜索列表”进行操作,您将获得包含确定的碳元素编号信息的垫子文件,以在MS-FINDER中使用。
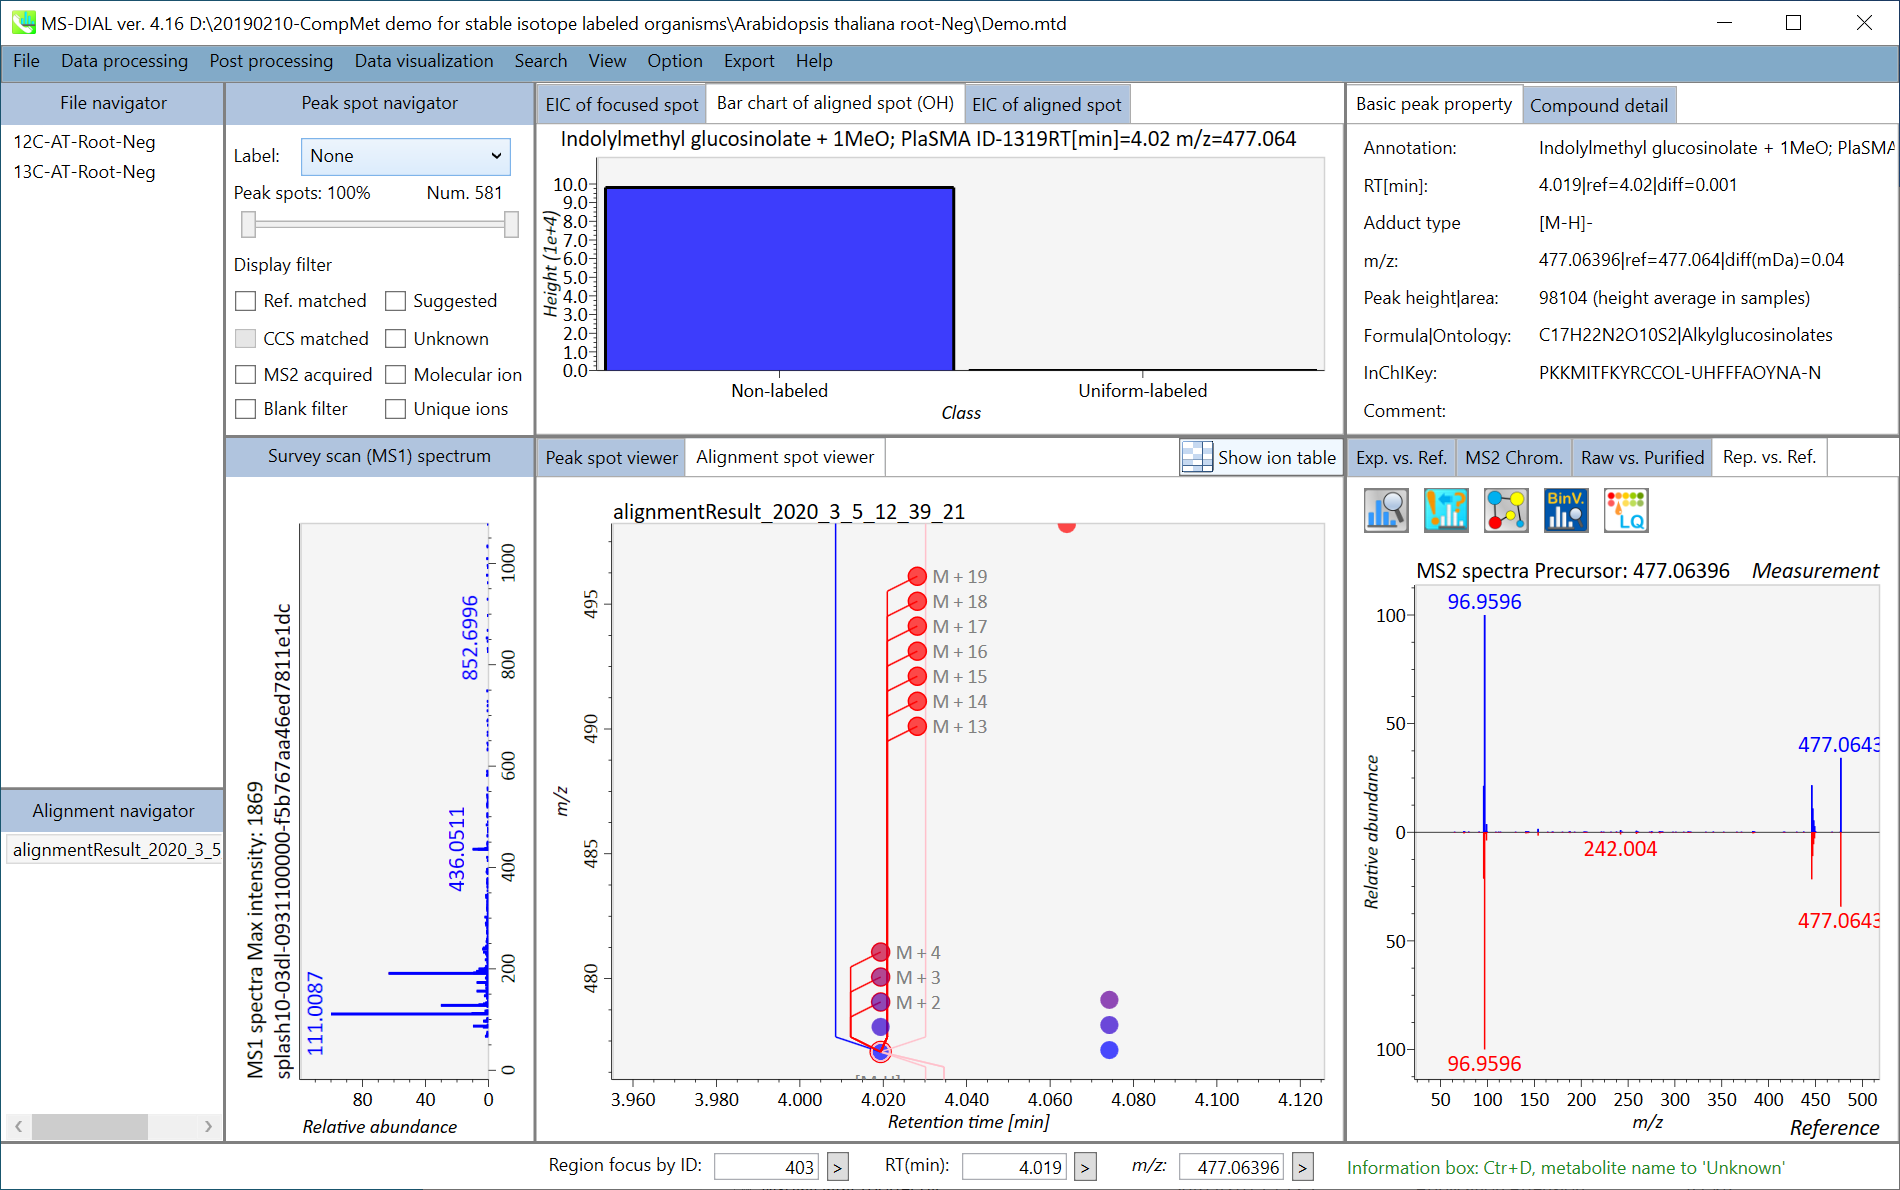
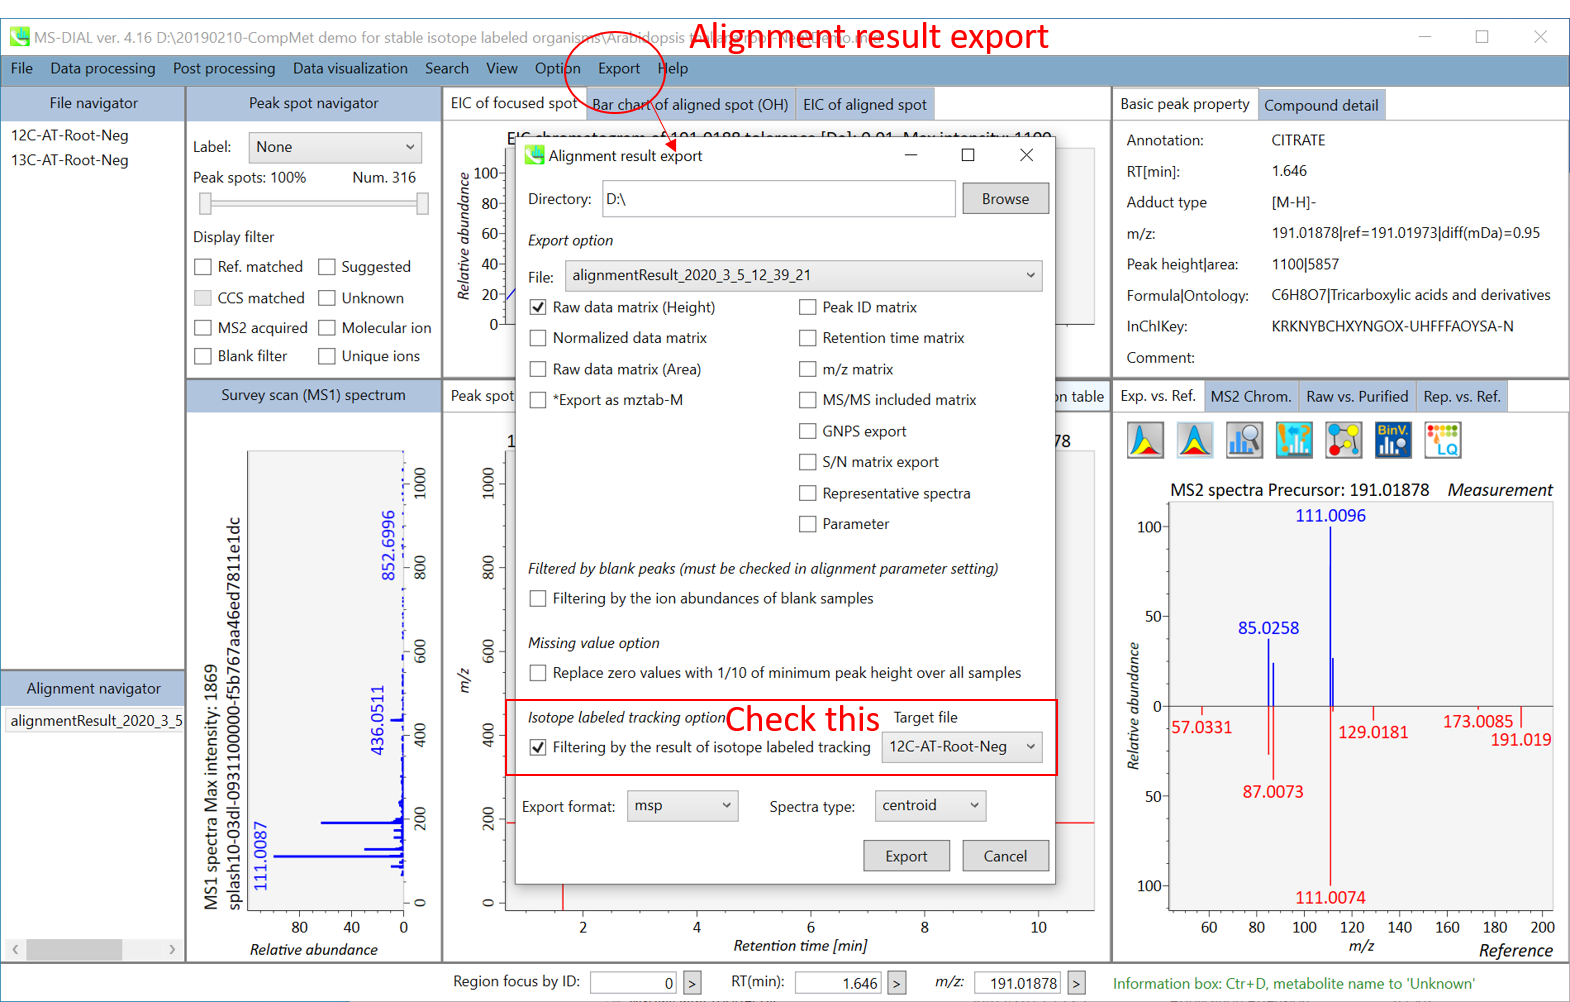
Chapter 8 第8章
Project for all ion fragmentation with multiple collision energies
具有多种碰撞能量的所有离子碎裂项目
We recently started the development for data independent MS/MS acquisition data from all-ion approach (such as MSE, all-ions, or all ion fragementations) with ‘multiple collision energies (like a sequential loop of 0V, 10V, and 40V)’. Here, a project is demonstrated using LC/MS/MS data sets from yeast strains, which have already published (Ohashi et al., 2017, DOI:10.1038/s41598-017-12392-6). The abf files used for this demonstration can be downloaded from the below link.
我们最近开始开发具有“多种碰撞能量(如0V、10V和40V的顺序环路)”的全离子方法(如MSE、全离子或全离子分流)的数据独立MS/MS采集数据。在这里,使用已经发表的酵母菌株的LC / MS / MS数据集演示了一个项目(Ohashi等人,2017,DOI:10.1038 / s41598-017-12392-6)。用于此演示的 abf 文件可以从以下链接下载。
http://prime.psc.riken.jp/Metabolomics_Software/MS-DIAL/index.html
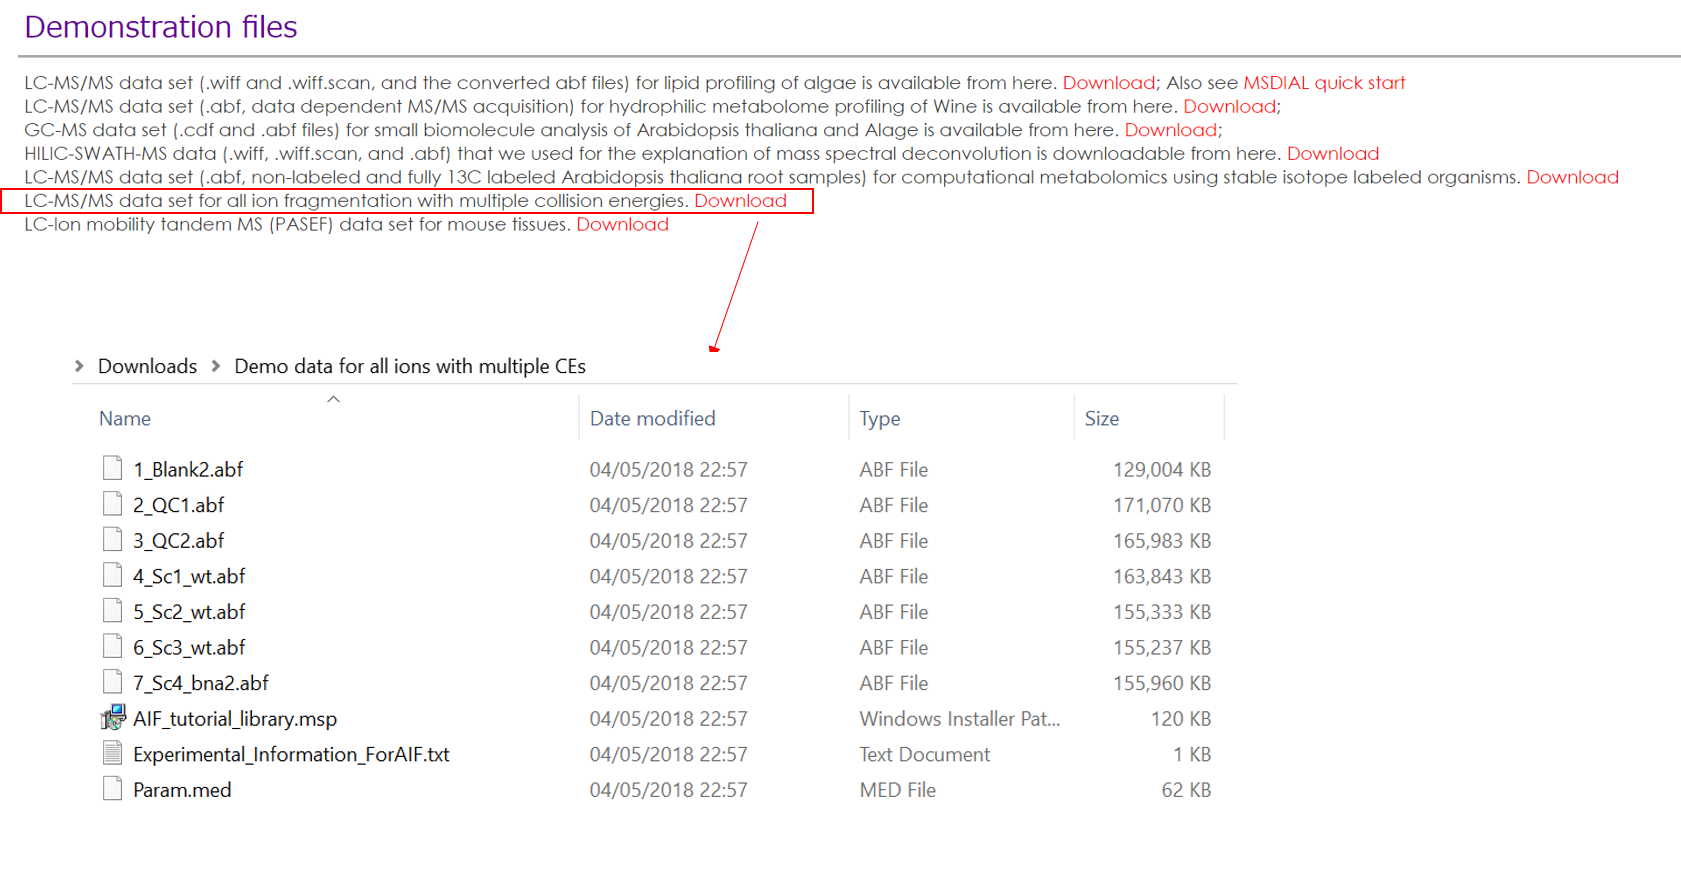
This chapter uses total 7 files and the MSP file is contained in the same folder of this demonstration. Also, there is a parameter file (Param.med) in this folder to be used in MS-DIAL for the quick start.
本章总共使用 7 个文件,MSP 文件包含在本演示的同一文件夹中。此外,此文件夹中还有一个参数文件 (Param.med),可在 MS-DIAL 中用于快速入门。
Experiment summary: 实验总结:
Samples: The demo project contains 7 files in total:
示例:演示项目总共包含 7 个文件:
Blank2 - blank sample
Blank2 - 空白样本
QC1, QC2 - quality control samples pooled from multiple yeast strain samples
QC1、QC2 - 从多个酵母菌株样品中混合的质控样品
Sc1, Sc2, Sc3 - WT yeast strain samples
Sc1、Sc2、Sc3 - WT 酵母菌株样品
Sc4 - bna2 yeast strain
Sc4 - bna2酵母菌株
Data was collected on a 1290 Infinity II ultrahigh performance liquid chromatography (UHPLC) system coupled to a 6550 iFunnel quadrupole time-of-flight (Q-TOF) mass spectrometer equipped with a dual AJS electrospray ionization source (Agilent Technologies) as published in Naz et al 2017 (DOI: 10.1021/acs.analchem.7b00925).
数据是在 Naz 等人 2017 年发表的 1290 Infinity II 超高效液相色谱 (UHPLC) 系统与配备双 AJS 电喷雾电离源 (Agilent Technologies) 的 6550 iFunnel 四极杆飞行时间 (Q-TOF) 质谱仪联用上收集的 (Agilent Technologies) (DOI: 10.1021/acs.analchem.7b00925)。
Liquid chromatography: Polar metabolites were separated on a HILIC SeQuant ZIC-HILIC (Merck, Darmstadt, Germany) column 100 Å (100 × 2.1 mm, 3.5 μm particle size) coupled to a guard column (2.1 × 2 mm, 3.5 μm particle size) and an inline-filter. Sample analysis in positive ionization mode was performed using water with 0.1% formic acid (solvent A) and acetonitrile with 0.1% formic acid (solvent B). The elution gradient used was as follows: isocratic step at 95% B for 1.5 min, 95 to 40% B in 12 min, maintained at 40% B for 2 min, then decreasing to 25% B at 14.2 min, maintained for 2.8 min, then returned to initial conditions over 1 min, and then the column was equilibrated at initial conditions for 7 min. The flow rate was 0.3 mL/min; injection volume was 2 μL, and the column oven was maintained at 25 °C.
液相色谱法:在HILIC SeQuant ZIC-HILIC(Merck,Darmstadt,Germany)色谱柱100 Å(100 × 2.1 mm,粒径3.5 μm)上分离极性代谢物,并与保护柱(2.1 × 2 mm,3.5 μm粒径)和在线过滤器联用。使用含0.1%甲酸的水(溶剂A)和含0.1%甲酸的乙腈(溶剂B)在正电离模式下进行样品分析。使用的洗脱梯度如下:在95%B下等度步骤1.5分钟,在12 min内从95%B到40%B,在40%B下保持2 min,然后在14.2 min时降至25% B,保持2.8 min,然后在1 min内恢复到初始条件,然后在初始条件下将色谱柱平衡7 min。流速为0.3 mL/min;进样体积为2μL,柱温箱保持在25°C。
Mass spectrometer: Nitrogen (purity >99.999%) was used as a sheath gas and drying gas at a flow of 8 and 15 L/min, respectively. The drying and sheath gas temperature was set at 250 °C with the nebulizer pressure at 35 psig and voltage 3000 V. The fragmentor voltage was set at 380 V. The acquisition was obtained with a mass range of 40−1200 m/z in AIF mode, where a single high-resolution full scan is acquired, including three sequential experiments at three alternating collision energies (one full scan at 0 eV, followed by one MS/ MS scan at 10 eV, and then followed by one MS/MS scan at 30 eV). The data acquisition rate was 6 scans/s. Data was acquired in centroid mode.
质谱仪:氮气(纯度>99.999%)分别用作鞘气和干燥气,流量分别为8和15 L/min。干燥和鞘气温度设定为250°C,雾化器压力为35 psig,电压为3000 V。碎裂器电压设置为380 V。在AIF模式下,采集质量范围为40−1200 m/z,其中采集单次高分辨率全扫描,包括在三个交替碰撞能量下进行三次连续实验(一次在0 eV下进行全扫描,然后在10 eV下进行一次MS / MS扫描,然后在30 eV下进行一次MS/MS扫描)。数据采集速率为6次扫描/秒。数据是在质心模式下采集的。
An internal lock mass mixture (Agilent Technologies) was prepared at a final concentration of 2 μM purine (C5H4N4) and 2.5 μM HP-0921 (C18H18O6N3P3F24) in acetonitrile:water (19:1, v/v). The internal lock mass mixture was constantly infused at a flow rate of 1 mL/min (split 1:100) using an isocratic pump together with the LC eluent for constant mass correction [positive ionization mode: purine (m/z 121.0509), HP-0921 (m/z 922.0098); Although observed mass accuracy will depends upon the resolution, potential metabolite coelution, and isobaric compounds, a mass accuracy of <5 ppm was expected.
在乙腈:水(19:1,v/v)中制备终浓度为2 μM嘌呤(C5H4N4)和2.5 μM HP-0921 (C18H18O6N3P3F24)的内锁质量混合物(Agilent Technologies)。使用等度泵和LC洗脱液以1 mL/min(1:100分割)的流速连续注入内部锁定质量混合物,以进行恒定质量校正[正电离模式:嘌呤(m/z 121.0509),HP-0921(m/z 922.0098);虽然观察到的质量精度取决于分辨率、潜在的代谢物共洗脱和同量异位化合物,但预计质量精度为<5 ppm。
Section 8-1 第 8-1 节
Starting up your project
启动项目
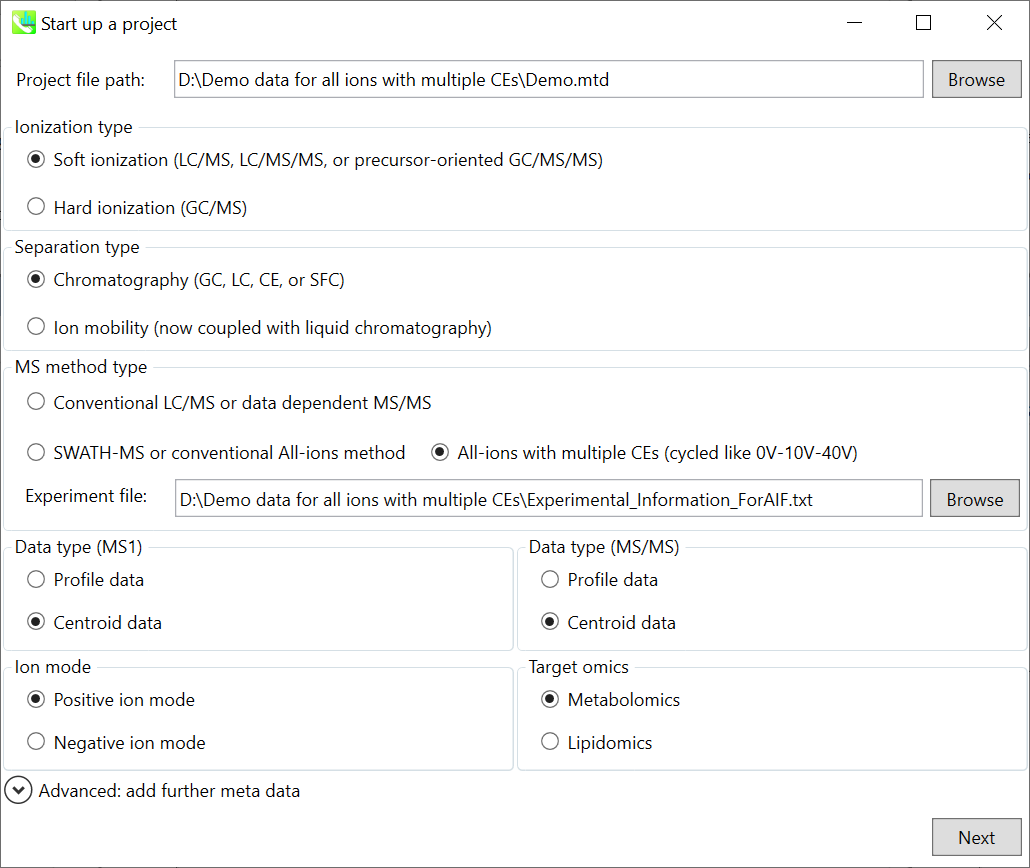
File -> new project
文件 -> 新项目
Set your project file path to the directory of your ABF files
将项目文件路径设置为 ABF 文件的目录
Select your method type as ‘All-ions with multiple CEs’
选择您的方法类型为“具有多个 CE 的全离子”
Select the experimental file: Experimental_Information_ForAIF.txt. (see the next page)
选择实验文件:Experimental_Information_ForAIF.txt。(见下一页)
Choose data type centroid data for both MS1 and MS/MS
为 MS1 和 MS/MS 选择数据类型质心数据
Choose positive ion mode
选择正离子模式
Choose target omics as metabolomics
选择目标组学作为代谢组学
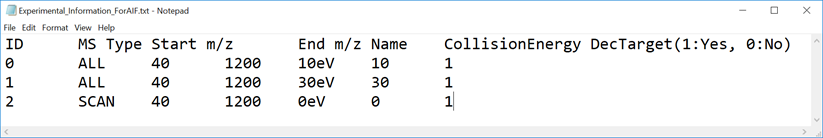
Experimental_Information_ForAIF.txt (tab-separated file)
Experimental_Information_ForAIF.txt(制表符分隔文件)
* To handle multiple collision energy data, please use this modified dictionary file format. First four columns are the same as the original dictionary file (see Section 4 of Chapter 1). The additional columns are set as follows;
* 要处理多个碰撞能量数据,请使用此修改后的字典文件格式。前四列与原始字典文件相同(参见第 1 章第 4 节)。其他列的设置如下;
ID: experimental ID from 0
ID:从 0 开始的实验 ID
MS Type: please set “SCAN” as MS1 scan
MS 类型:请将“SCAN”设置为 MS1 扫描
Start m/z: minimum m/z 起始 m/z:最小 m/z
End m/z: max m/z 结束 m/z:最大 m/z
Name: cycle name to show viewers
名称:向查看者显示的周期名称
Collision Energy: collision energy
碰撞能量:碰撞能量
DecTarget: 0 or 1. If you want to get deconvoluted spectra in this cycle, please set 1. Please set 1 at least 1 cycle.
DecTarget:0 或 1。如果您想在此循环中获得去卷积光谱,请设置 1。请至少设置 1 个周期。
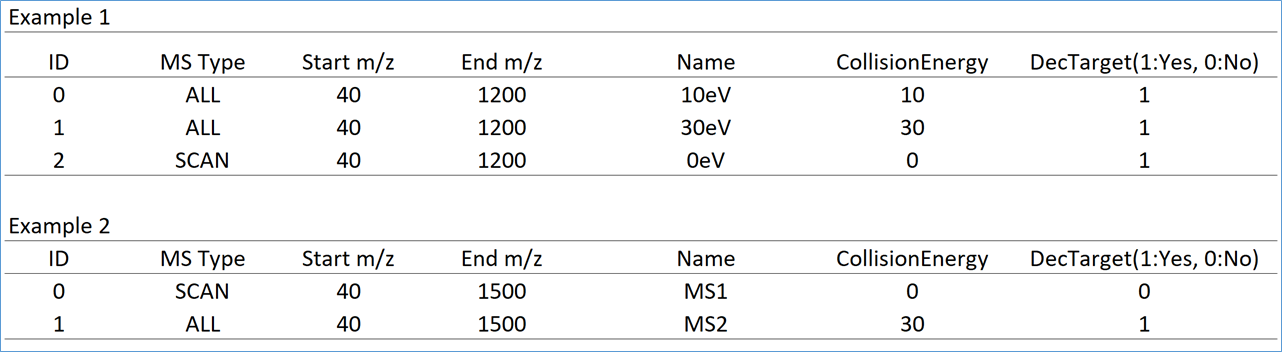 Examples of the modified dictionary file
修改后的字典文件的示例
Section 8-2 第 8-2 节
Importing ABF files 导入 ABF 文件
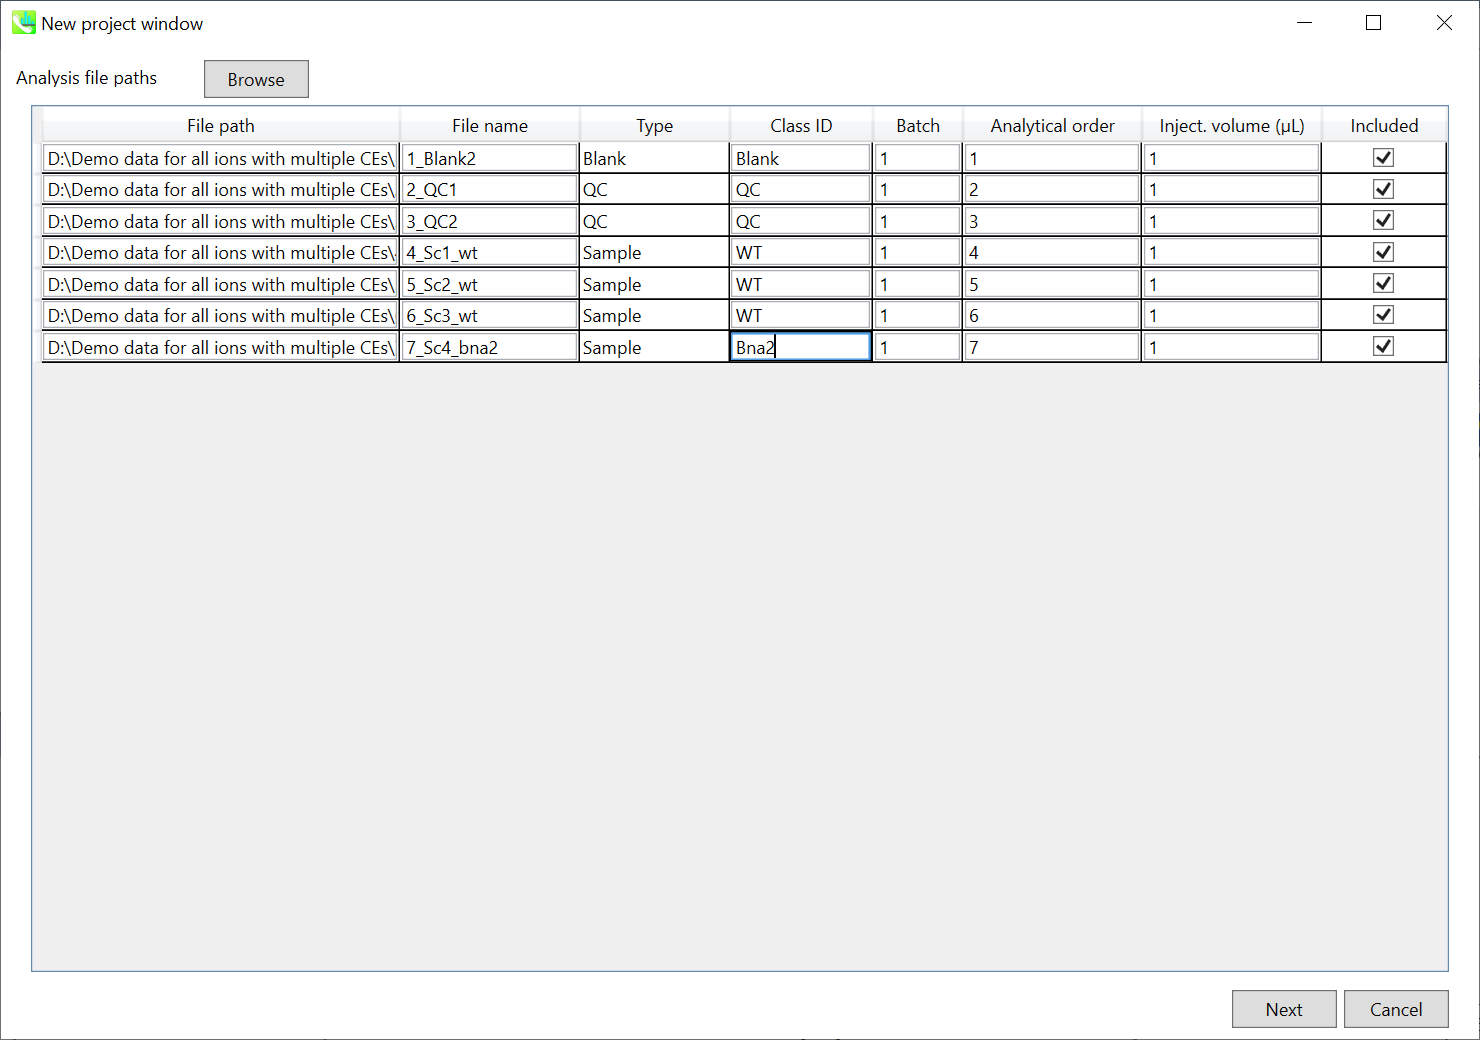
Select ABF files 选择 ABF 个文件
Change the sample names and set the sample type and class
更改样本名称并设置样本类型和类
Note: Please finalize your file name here, because you cannot change it later.
注意:请在此处完成您的文件名,因为您以后无法更改它。
Section 8-3 第 8-3 节
Setting parameters 设置参数
Section 8-3-1 第 8-3-1 节
Data collection tab “数据收集”选项卡
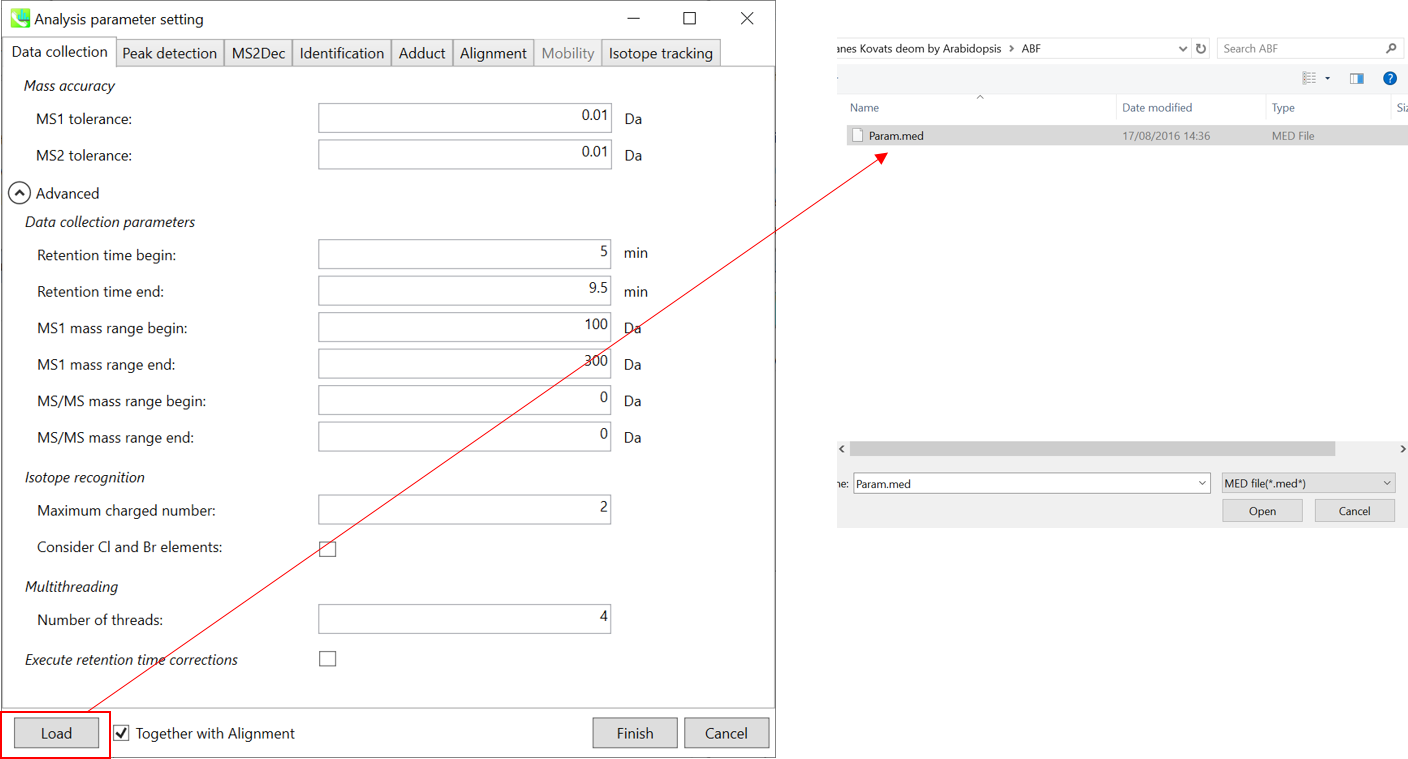
* For the quick start and its explanations, load ‘Param.med’.
* 有关快速入门及其说明,请加载“Param.med”。
Mass accuracy: After the peak detection algorithm is applied along the MS axis with a very low threshold, MS-DIAL performs spectral centroiding. By default, mass spectrum of ±0.01 and ±0.01 Da range from each peak top is integrated in MS1 and MS2, respectively. Importantly, this MS2 tolerance value is also used to build the MS/MS chromatogram for a certain m/z trace. The MS/MS chromatograms are dedicated to the MS2Dec deconvolution program.
质量精度:在以非常低的阈值沿MS轴应用峰值检测算法后,MS-DIAL执行光谱质心。默认情况下,MS1 和 MS2 中分别积分了每个峰顶的 ±0.01 和 ±0.01 Da 范围的质谱图。重要的是,该MS2容差值还用于构建特定m/z迹线的MS/MS色谱图。MS/MS色谱图专用于MS2Dec反卷积程序。
Data collection parameters: You can set analysis ranges (RT, MS1 and MS/MS axis). In this demonstration, your expected data range is 1.5-15 min for 40-1200 Da.
数据采集参数:可设置分析范围(RT、MS1、MS/MS轴)。在此演示中,对于 40-1200 Da,您的预期数据范围为 1.5-15 分钟。
Note: The chromatographic peaks are highly coeluted in the beginning of this LC-MS data, i.e. 0-1.5 min area. Therefore the AIF data deconvolution is applied for 1.5-15 min in this demonstration.
注意:色谱峰在LC-MS数据开始时高度共洗脱,即0-1.5 min区域。因此,在本演示中,AIF 数据反卷积应用了 1.5-15 分钟。
Isotope recognition: As long as you focus on small molecule researches (less than 2000 Da), Maximum charged number can be set to 2. On the other hand, the parameter can be changed to 8 or more to process proteome or snRNA research data.
同位素识别:只要专注于小分子研究(小于2000 Da),最大充电数可以设置为2。另一方面,可以将参数更改为 8 或更多以处理蛋白质组或 snRNA 研究数据。
Check Consider Cl and Br elements if you assume that your samples contain any halogen element as halogens have unique characteristic of isotope.
如果您假设您的样品含有任何卤素元素,请选中考虑 Cl 和 Br 元素,因为卤素具有同位素的独特特性。
Multithreading: Please set the count of threads that you want to use. You can check the maximum thread counts in resource monitor. (open task manager->open resource monitor)
多线程:请设置要使用的线程数。您可以在资源监视器中检查最大线程计数。(打开任务管理器->打开资源监视器)
Execute retention time corrections: For detail, visit ‘The tutorial and parameter files for MS-DIAL ALF dataprocessing and spectral library construction methodology’ in the website of MS-DIAL shown below(URL: http://prime.psc.riken.jp/Metabolomics_Software/MS-DIAL/).
执行保留时间校正:有关详细信息,请访问如下所示的MS-DIAL网站中的“MS-DIAL ALF数据处理和谱库构建方法的教程和参数文件”(URL:http://prime.psc.riken.jp/Metabolomics_Software/MS-DIAL/)。
Section 8-3-2 第 8-3-2 节
Peak detection tab 峰值检测选项卡
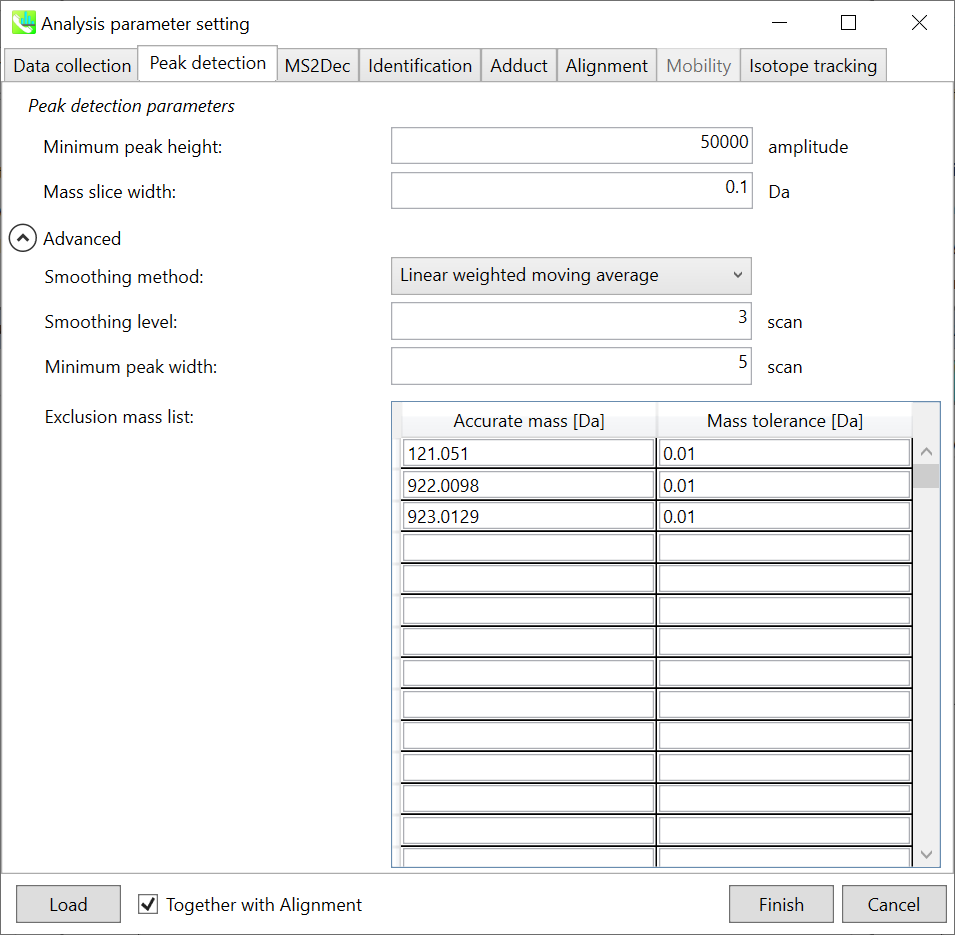
Peak detection parameters: Linear-weighted moving average is used for the peak detection by default to accurately determine the peak left- and right edges. The recommended smoothing level is 3 (see Note). MS-DIAL provides two simple thresholds: minimum values for peak width and height. Peaks below these thresholds are ignored (see also MS-DIAL mathematics: http://prime.psc.riken.jp/Metabolomics_Software/MS-DIAL/MS-DIAL%20FAQ-vs2.pdf). For FT-ICR or Orbitrap data, the minimum peak height may be 50,000 or more.
峰值检测参数:峰值检测默认采用线性加权移动平均,准确确定峰值左右边缘。建议的平滑级别为 3(请参阅注释)。MS-DIAL提供了两个简单的阈值:峰宽和峰高的最小值。低于这些阈值的峰值将被忽略(另请参阅 MS-DIAL 数学:http://prime.psc.riken.jp/Metabolomics_Software/MS-DIAL/MS-DIAL%20FAQ-vs2.pdf)。对于 FT-ICR 或 Orbitrap 数据,最小峰高可能为 50,000 或更高。
Note: check the smoothing level at the raw data
注意:检查原始数据的平滑级别
Note: it is recommended to set the minimum peak height at least 2-5 fold higher than the noise level, otherwise the data analysis will take very long time. To check the noise level you can for example check several scans in the non-busy region of the mass spectrum. The small peaks not found consistently across the scans can be regarded as noise.
注意:建议将最小峰值高度设置为至少比噪声水平高2-5倍,否则数据分析将花费很长时间。例如,要检查噪声水平,您可以检查质谱非繁忙区域中的多次扫描。在扫描过程中没有一致发现的小峰可以被视为噪声。
The width of mass slice is set in Mass slice width. From our experience, 0.1 or 0.05 is suitable for Agilent Q-TOF, AB Sciex TripleTOF, and Thermo Q-Exactive. If you already know unwanted m/z peaks from columns or solvent, you can specify them in the Exclusion mass list.
质量切片的宽度在“质量切片宽度”中设置。根据我们的经验,0.1 或 0.05 适用于 Agilent Q-TOF、AB Sciex TripleTOF 和 Thermo Q-Exactive。如果您已经知道色谱柱或溶剂中不需要的m/z峰,则可以在排除质量数列表中指定它们。
In this demonstration, the m/z values for calibrant compounds, i.e. purine and HP-921, are set in the exclusion list.
在本演示中,校准化合物(即嘌呤和 HP-921)的 m/z 值设置在排除列表中。
Purine 121.0509 [M+H]+, HP-921 922.0098 [M+H]+ and 923.0129 [M+H]+ isotope with 0.01 tolerance
嘌呤 121.0509 [M+H]+、HP-921、922.0098 [M+H]+ 和 923.0129 [M+H]+ 同位素,公差为 0.01
Section 8-3-3 第 8-3-3 节
MS2Dec tab MS2Dec 选项卡
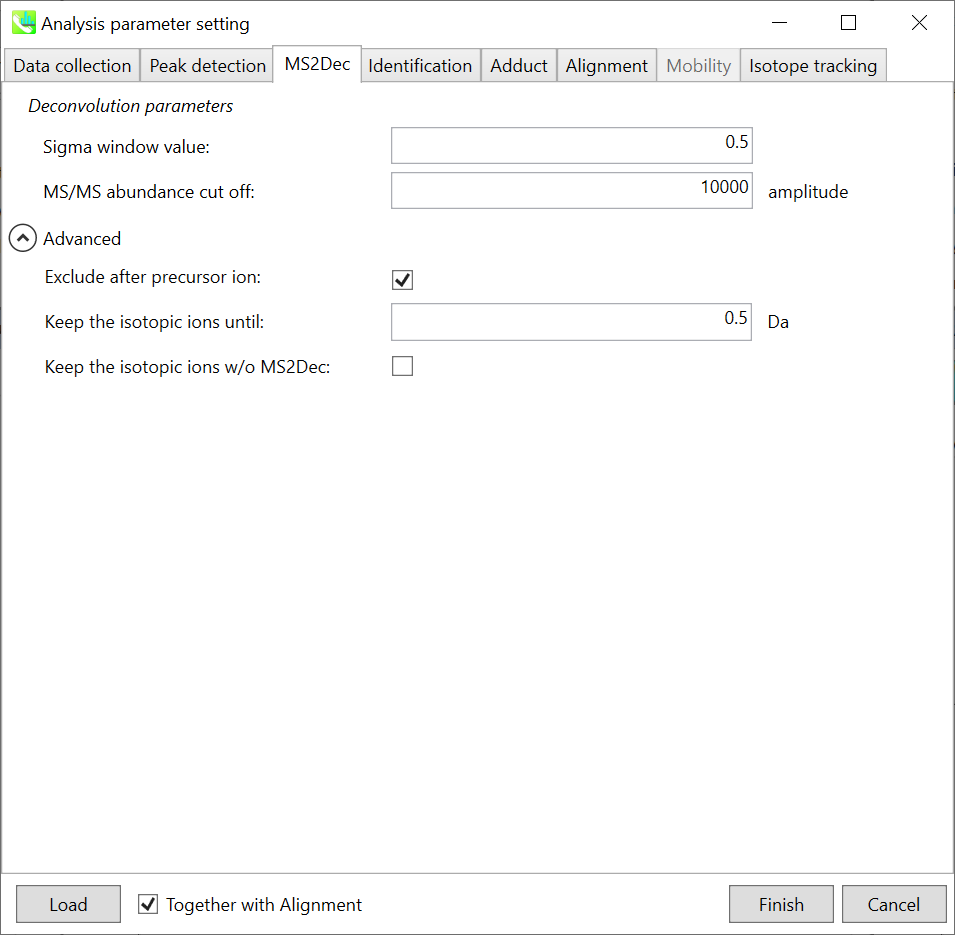
The Sigma window value is highly affected by the resolution of deconvolutions. A higher value (0.7-1.0) will reduce the peak top resolutions, i.e. the number of resolved peaks will be decreased. On the other hand, a lower value (0.1-0.3) may also recognize many noise chromatographic peaks.
Sigma 窗口值受反卷积分辨率的影响很大。较高的值(0.7-1.0)将降低峰值最高分辨率,即分离的峰值数量将减少。另一方面,较低的值(0.1-0.3)也可以识别许多噪声色谱峰。
In addition, you may be able to set a cut off value to reduce the MS noises (see Section 3-3 of Chapter 3). Finally, if you want to remove the product ions with higher m/z than the focused precursor ion (recommended for metabolomics and lipidomics), check Exclude after precursor ion.
此外,您还可以设置一个截止值来降低 MS 噪声(参见第 3 章第 3-3 节)。最后,如果要去除 m/z 高于聚焦母离子的子离子(推荐用于代谢组学和脂质组学),请选中母离子后排除。
Section 8-3-4 第 8-3-4 节
Identification tab “标识”选项卡
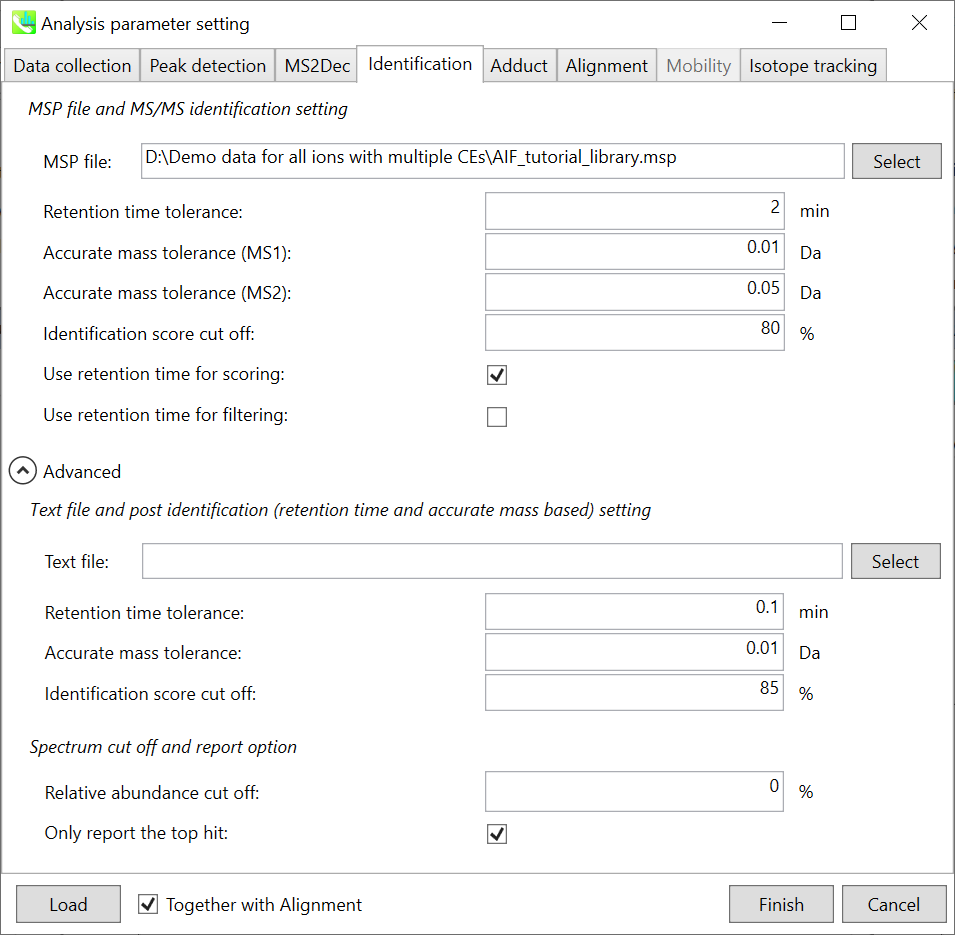
MSP file and MS/MS identification setting:
MSP 文件和 MS/MS 标识设置:
Set your MSP file here (Tutorial data: AIF_tutorial_library.msp). In the case that you selected ‘lipidomics’ project, please select what you want to find in your data sets for lipid profiling. MSP libary contains Tryptophan, Kynurenine, Kynurenic acid, 3-hydroxyanthranillic acid, 3-hydroxykynurenine, internal standards (MES, CHES, PIPES, HEPES).
在此处设置 MSP 文件(教程数据:AIF_tutorial_library.msp)。如果您选择了“脂质组学”项目,请选择您想在数据集中找到的内容以进行脂质分析。MSP文库包含色氨酸、犬尿氨酸、犬尿烯酸、3-羟基邻氨基苯甲酸、3-羟基犬尿氨酸、内标(MES、CHES、PIPES、HEPES)。
If you put retention time (RT) information in your MSP file, set the Retention time tolerance value (default is 0.5). The Accurate mass tolerance for MS1 and MS2 are required for the compound search and they are dependent on your instrument performance.
如果将保留时间 (RT) 信息放在 MSP 文件中,请设置保留时间容差值(默认值为 0.5)。化合物搜索需要 MS1 和 MS2 的精确质量允差,它们取决于您的仪器性能。
The cutoff of the identification score should be greater than 0.6 or 0.7 (Identification score cut off).
识别分数的截止值应大于 0.6 或 0.7(识别分数截止值)。
Text file and post identification (retention time and accurate mass based) setting:
文本文件和柱子识别(保留时间和基于质量的准确)设置:
If you want to perform “post identification” processing, set your text file in Text file.
如果要执行“识别后”处理,请在“文本文件”中设置文本文件。
Note: The meanings of parameters are the same as MSP based identification.
注意:参数的含义与基于MSP的识别相同。
Spectrm cut off and report option:
Spectrm 截止和报告选项:
The mass spectrum peak less than the user-defined value in Relative abundance cut off will not be used for the MS/MS similarity calculation.
小于相对丰度截止值中用户定义值的质谱图峰将不用于MS/MS相似性计算。
Since some chromatogram peaks will be annotated as the same compound from the identification algorithm, the Only report the top hit option allows us to determine only one candidate from such multiple results by means of the identification score.
由于某些色谱峰将在鉴定算法中被注释为同一化合物,因此“仅报告最热门的化合物”选项允许我们通过鉴定分数从此类多个结果中仅确定一个候选化合物。
Section 8-3-5 第 8-3-5 节
Adduct tab 加合物选项卡
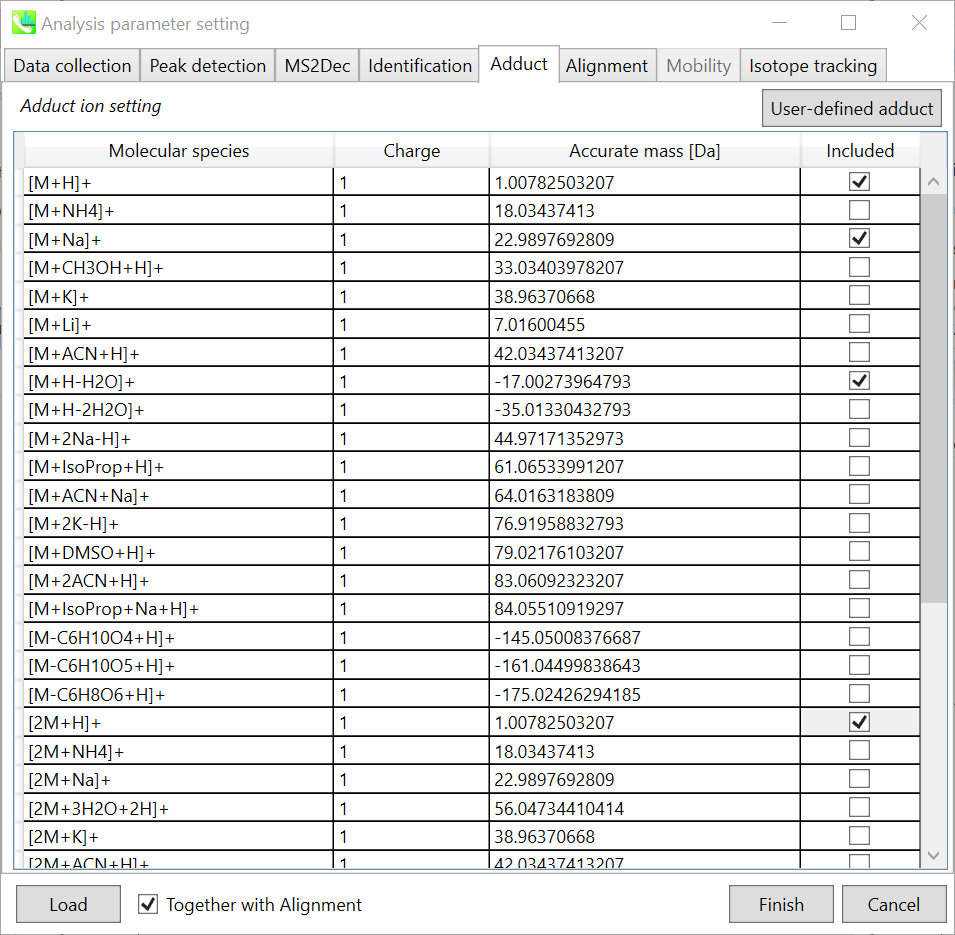
Adduct ion setting: You can tick the adduct ions and charge values to be considered.
加合离子设置:您可以勾选要考虑的加合离子和电荷值。
* see also the section 3-5 of Chapter 3 for the explanation of how to determine your own adduct ion.
* 另请参阅第 3 章第 3-5 节,了解如何确定自己的加合物离子。
Section 8-3-6 第 8-3-6 节
Alignment tab “对齐方式”选项卡
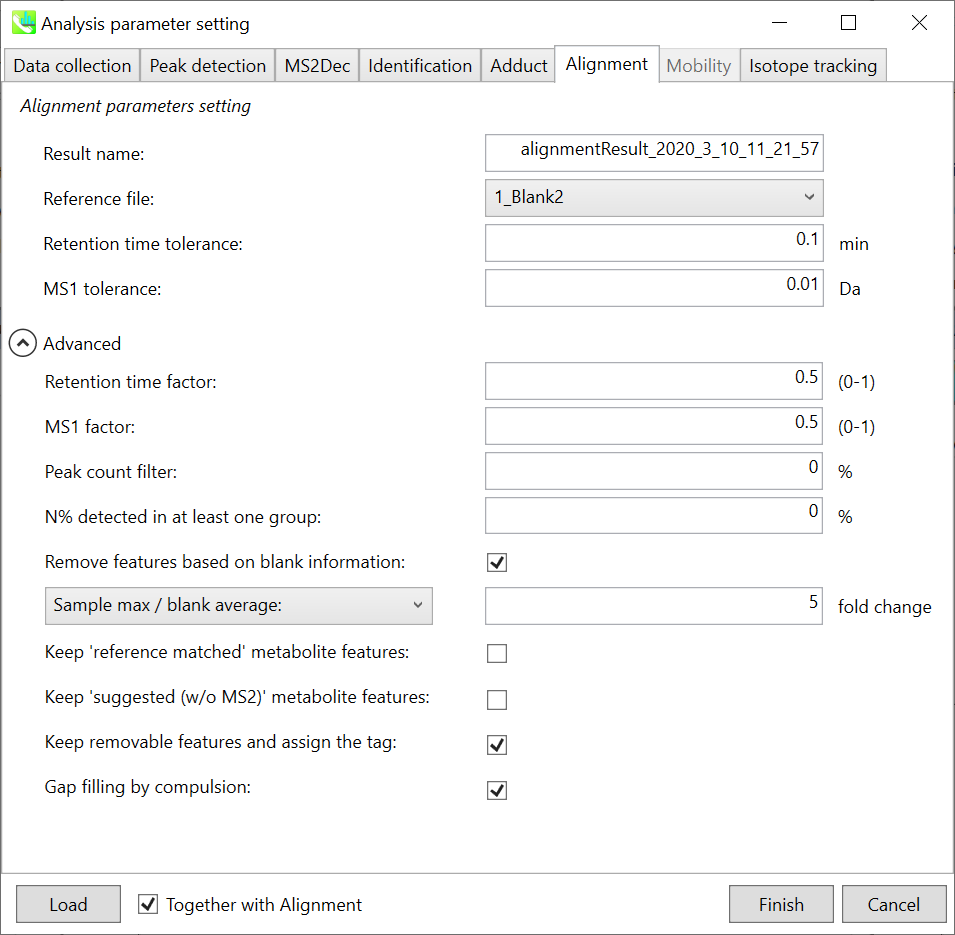
Parameters: If you already have a suitable quality control (QC) data, typically a mixed sample data, then specify the QC file here. All sample data will be aligned to this QC file. The RT and MS1 tolerances for peak alignment depend on your chromatographic conditions (see MS-DIAL mathematics for details). If you want to remove specific peaks that are not fully detected in the alignment, specify the peak count filter. If you can prepare many QC sample data, tick the “Detected in all QCs” box. Then a peak will be removed if it is missing in any of the QC samples.
参数:如果您已经有合适的质量控制 (QC) 数据,通常是混合样品数据,请在此处指定 QC 文件。所有样品数据都将与此 QC 文件对齐。峰比对的RT和MS1允差取决于您的色谱条件(有关详细信息,请参见MS-DIAL数学)。如果要删除在对齐中未完全检测到的特定峰,请指定峰计数过滤器。如果您可以准备许多QC样品数据,请勾选“在所有QC中检测到”框。然后,如果任何QC样品中缺少峰,则将去除该峰。
Note: When you execute the compound identification, the representative spectra with identification results are automatically determined from one of imported files which has the highest identification score. In the case that an alignment spot is not identified in any samples, the MS/MS spectrum of one sample which has the highest ion abundance in imported files is assigned as the representative spectrum.
注意:当您执行化合物鉴定时,将自动从鉴定分数最高的导入文件之一中确定具有鉴定结果的代表性谱图。如果在任何样品中未识别到对齐点,则将导入文件中离子丰度最高的一个样品的MS/MS谱图指定为代表性谱图。
Section 8-4 第 8-4 节
Result checking 结果检查
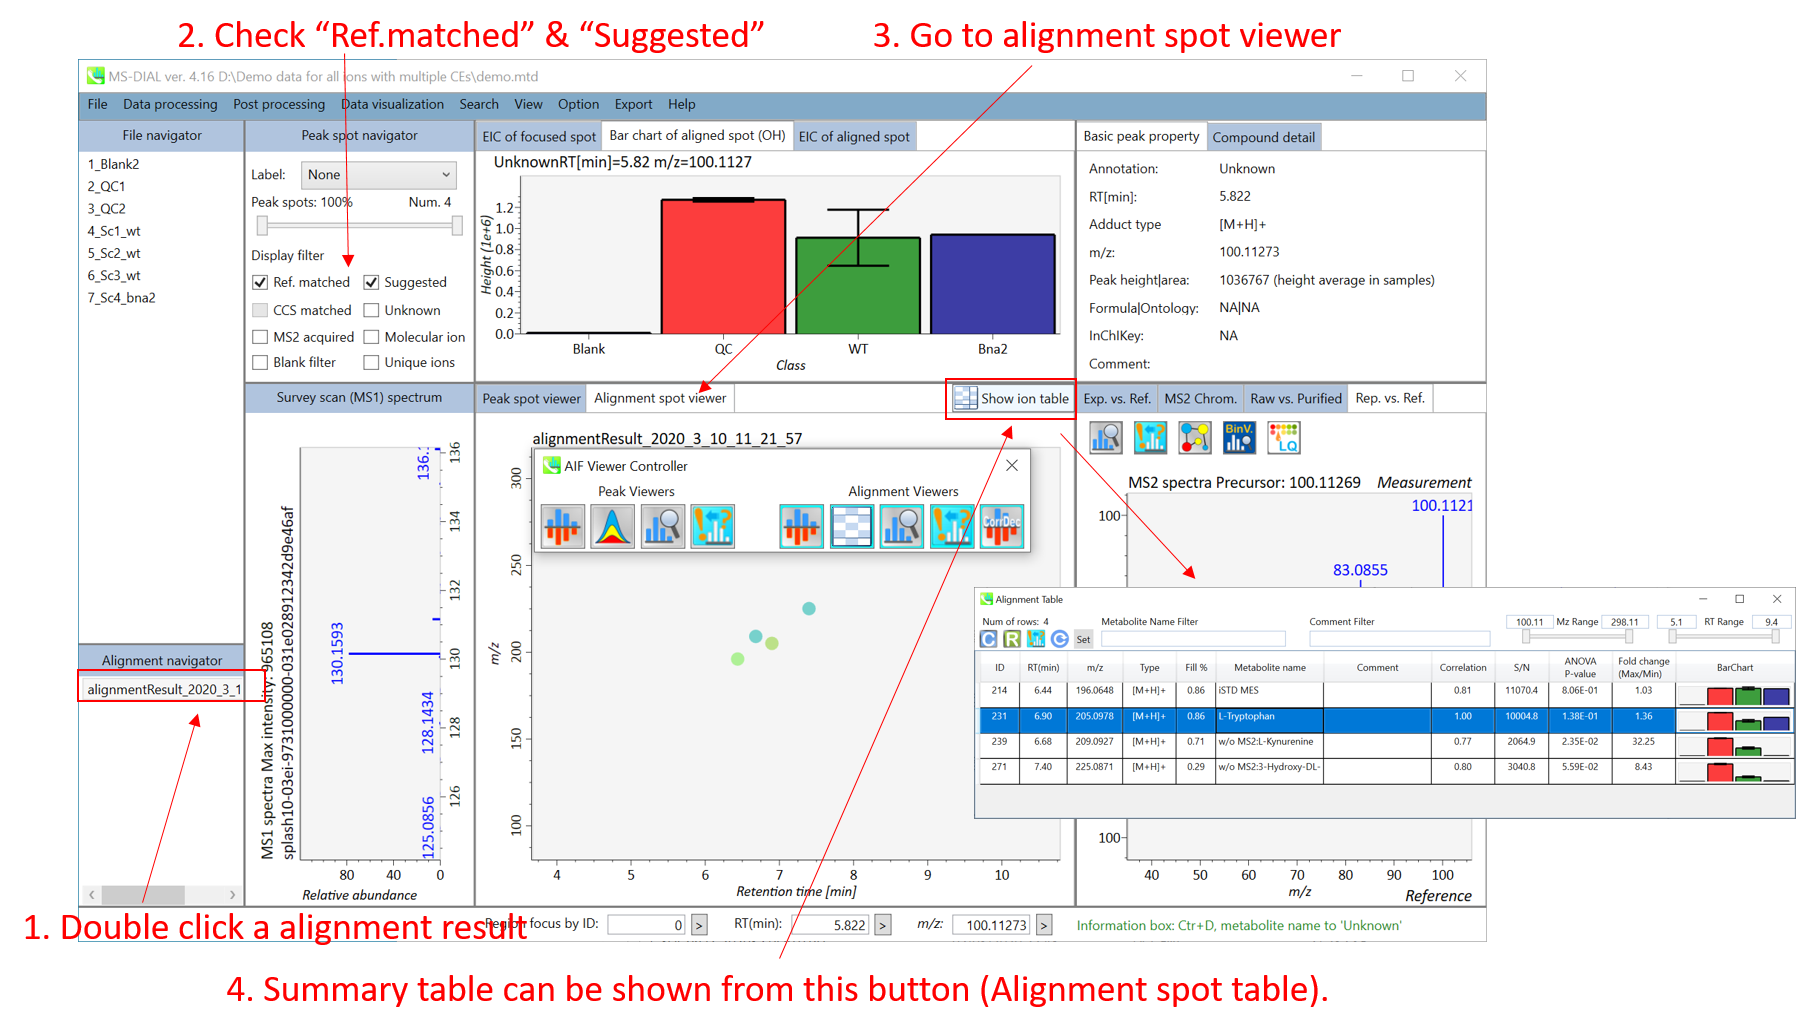
MS-DIAL can automatically identify metabolite peaks by the similarity calculation of retention time, precursor m/z, isotopic ratios, and MS/MS spectrum with the reference databases. You can easily check the result from alignment ion spot table.
MS-DIAL可以通过与参考数据库的保留时间、母离子m/z、同位素比值和MS/MS谱图的相似性计算来自动识别代谢物峰。您可以从对准离子光斑表中轻松查看结果。
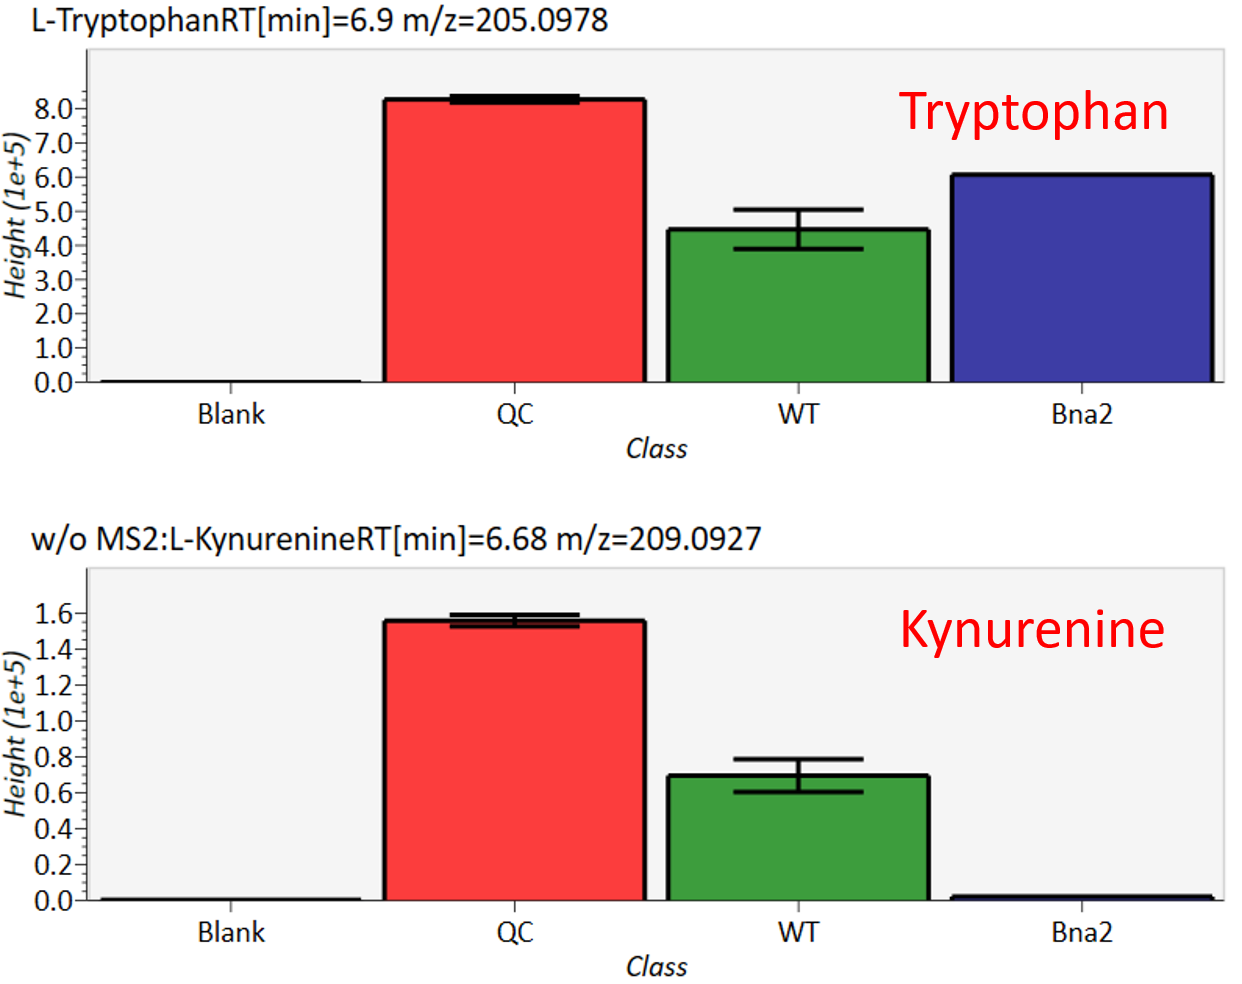
Ion intensities of tryptophan are stable across samples; however, the intensity of kynurenine, which is synthesized from tryptophan, is very low in the mutant sample (bna2). Please refer to the original paper for details (Ohashi et al., 2017, DOI:10.1038/s41598-017-12392-6). For further information about GUI of MS-DIAL, see Chapter 5 & Chapter 9.
色氨酸的离子强度在样品中是稳定的;然而,由色氨酸合成的犬尿氨酸的强度在突变体样品(bNa2)中非常低。详见原文(Ohashi et al., 2017, DOI:10.1038/s41598-017-12392-6)。有关 MS-DIAL 的 GUI 的更多信息,请参阅第 5 章和第 9 章。
Chapter 9 第9章
Graphical user interface of MS-DIAL in AIF mode
AIF 模式下 MS-DIAL 的图形用户界面
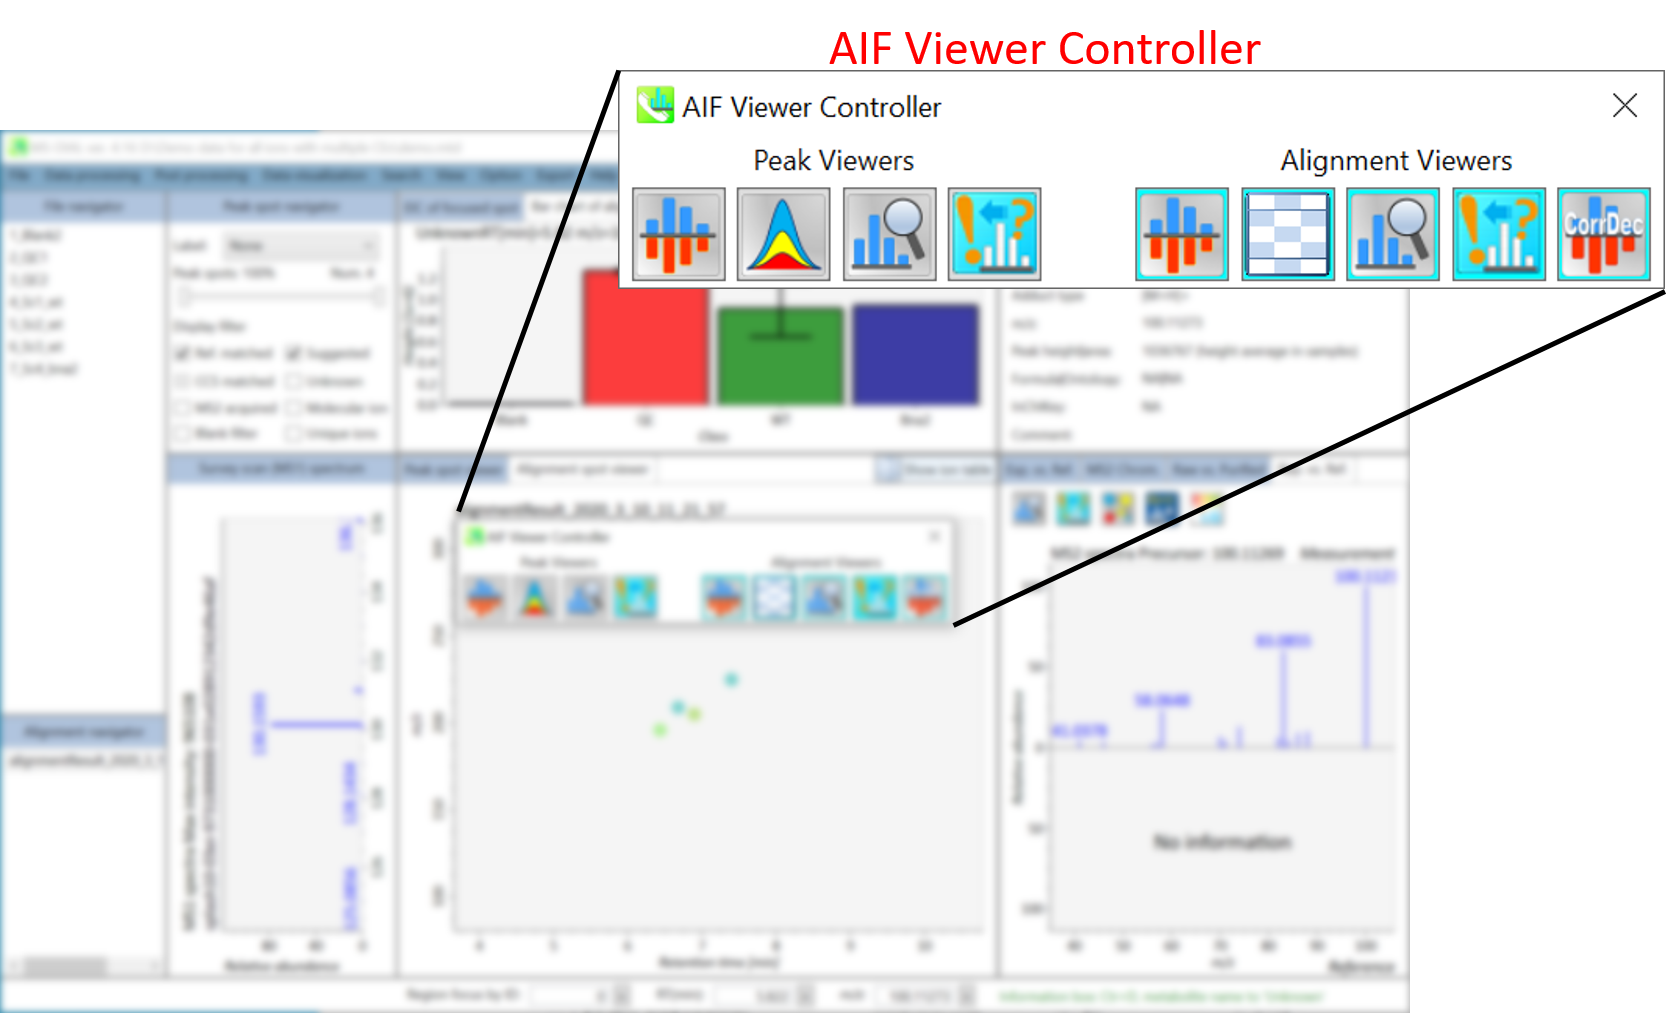
If you choose “All-ions with multiple CEs” as method type in the project, the AIF Viewer Controller will be launched when you open the project. The controller currently has 9 buttons to lunch additional viewers.
如果在项目中选择“具有多个 CE 的全离子”作为方法类型,则打开项目时将启动 AIF 查看器控制器。控制器目前有 9 个按钮,可以为其他观众提供午餐。
Section 9-1 第9-1节
Mass spectrum viewers in peak spot and alignment viewer
峰斑和对准查看器中的质谱查看器
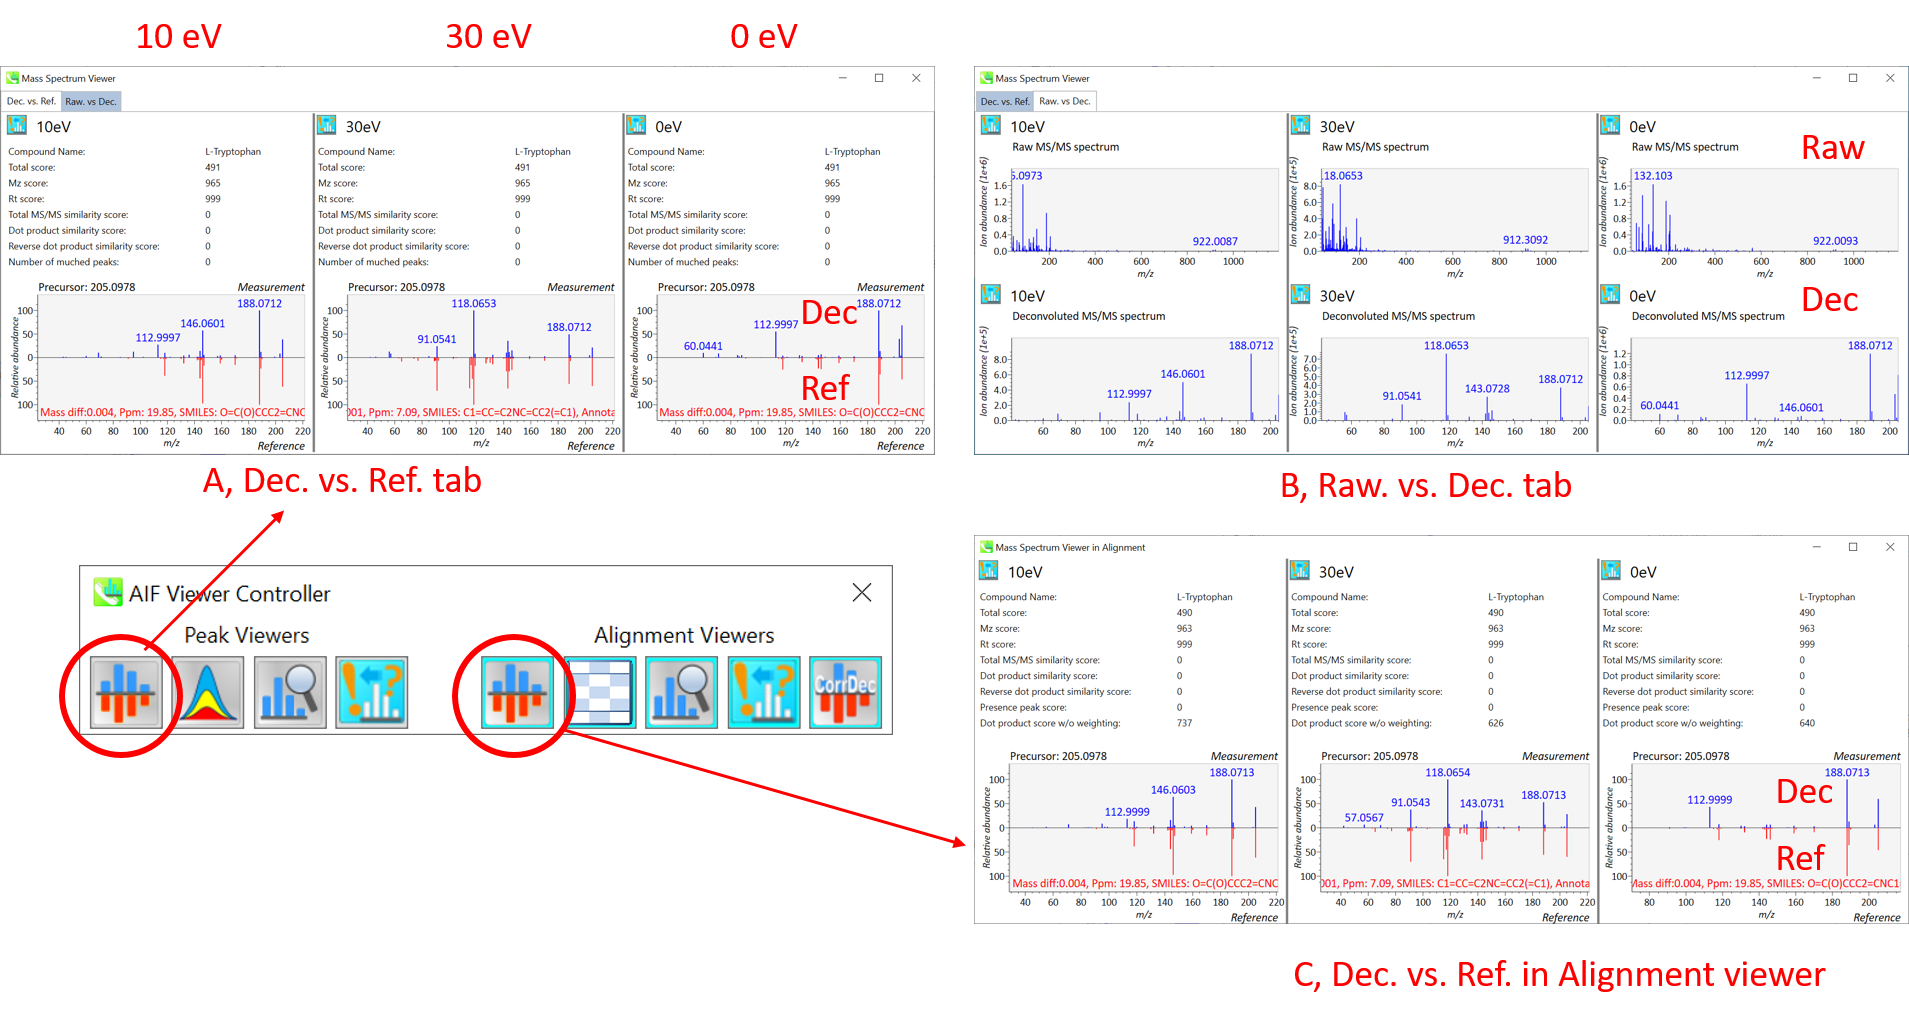
These viewers show mass spectrum with different collision energies in parallel. Mass Spectrum Viewer in peak viewer has two tabs. The window (A) on Dec. vs. Ref. tab displays the deconvoluted MS/MS spectrum (blue, the upper part) and the reference MS/MS spectrum (red, the lower part). The window (B) on Raw. vs Dec. tab displays the raw- and deconvoluted MS/MS spectrum on the upper and lower panel respectively. The window (C, Mass Spectrum Viewer in alignment) displays the deconvoluted MS/MS spectrum (blue, upper) and the reference (red, lower).
这些观察器显示了具有不同碰撞能量的质谱并行。峰值查看器中的质谱查看器有两个选项卡。12 月与参考选项卡上的窗口 (A) 显示去卷积的 MS/MS 谱图(蓝色,上部)和参考 MS/MS 谱图(红色,下部)。Raw 上的窗口 (B)。vs Dec. 选项卡分别在上面板和下面板上显示原始和反卷积的 MS/MS 谱图。窗口(C,质谱查看器对齐)显示去卷积的MS/MS谱图(蓝色,上)和参考(红色,下)。
Section 9-2 第9-2节
MS/MS chromatogram viewer in peak viewer
峰查看器中的MS/MS色谱图查看器
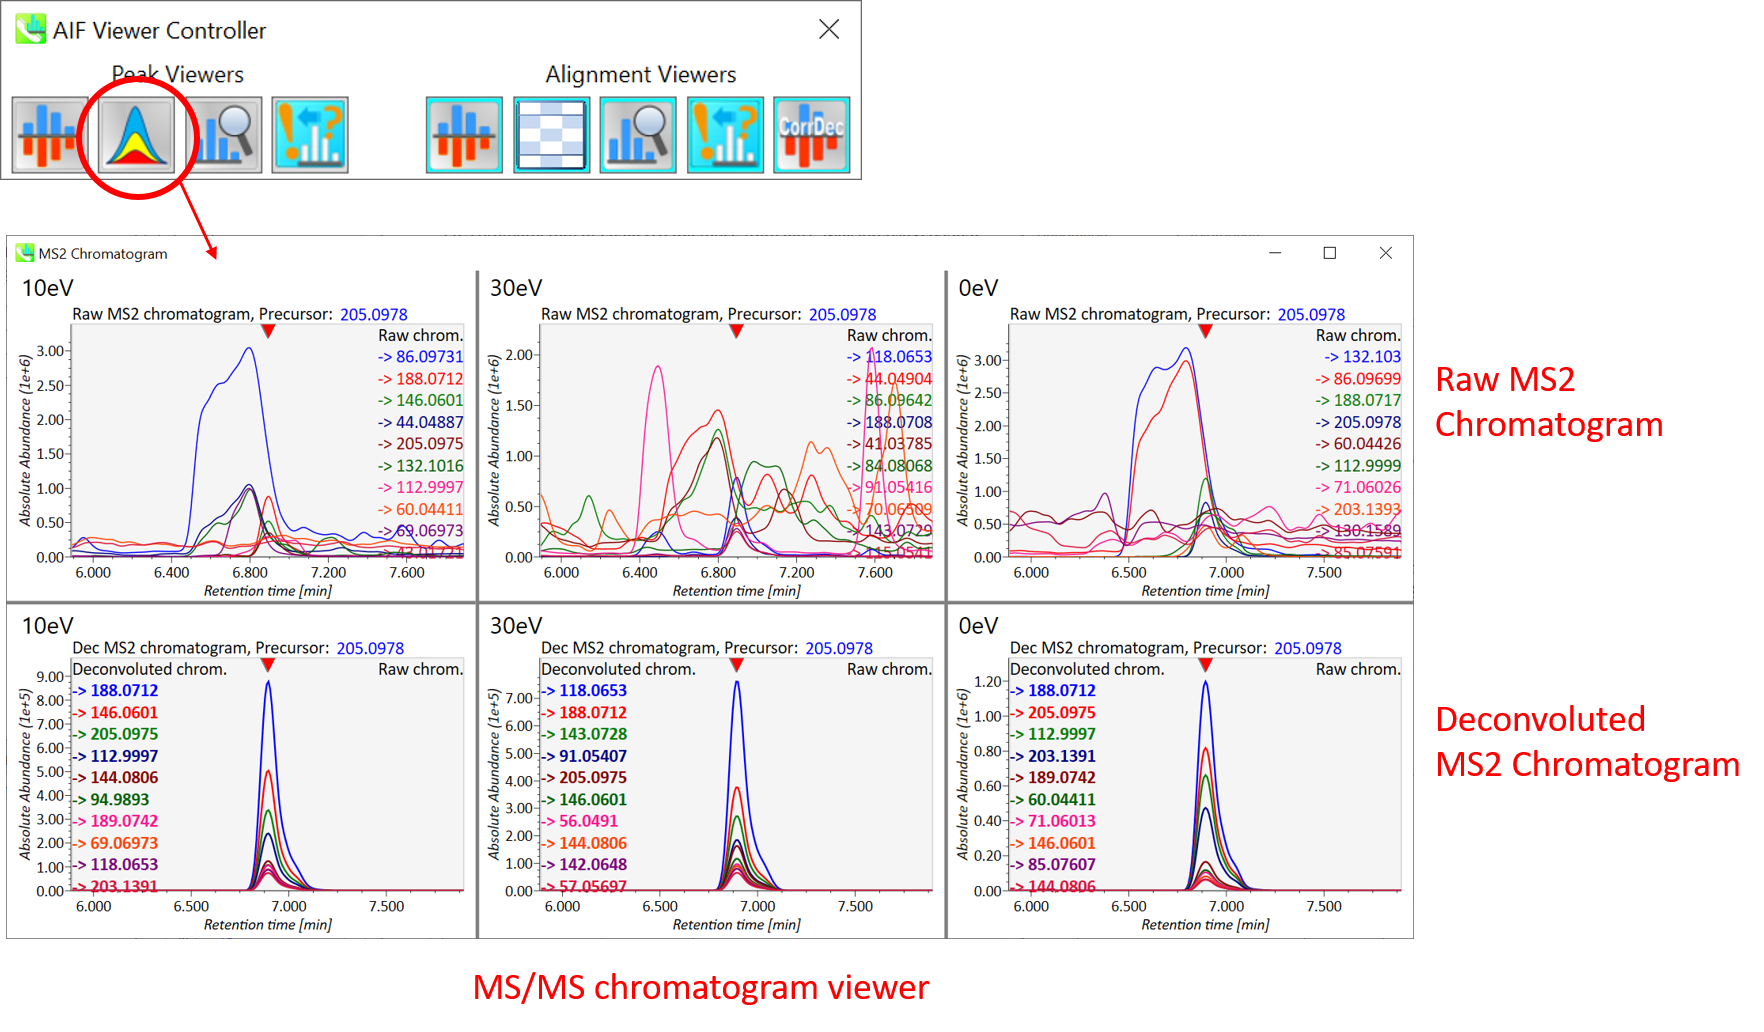
The detail of deconvolution is shown in the MS2 chromatogram viewer. The window displays the raw- and deconvoluted MS/MS chromatogram on the upper and lower panel respectively. Please use this viewer for checking the quality of deconvolution.
反卷积的细节显示在MS2色谱图查看器中。该窗口分别在上面板和下面板上显示原始和反卷积的MS/MS色谱图。请使用此查看器检查反卷积的质量。
Section 9-3 第 9-3 节
Compound search for the curation of peak identification
用于峰鉴定的化合物检索
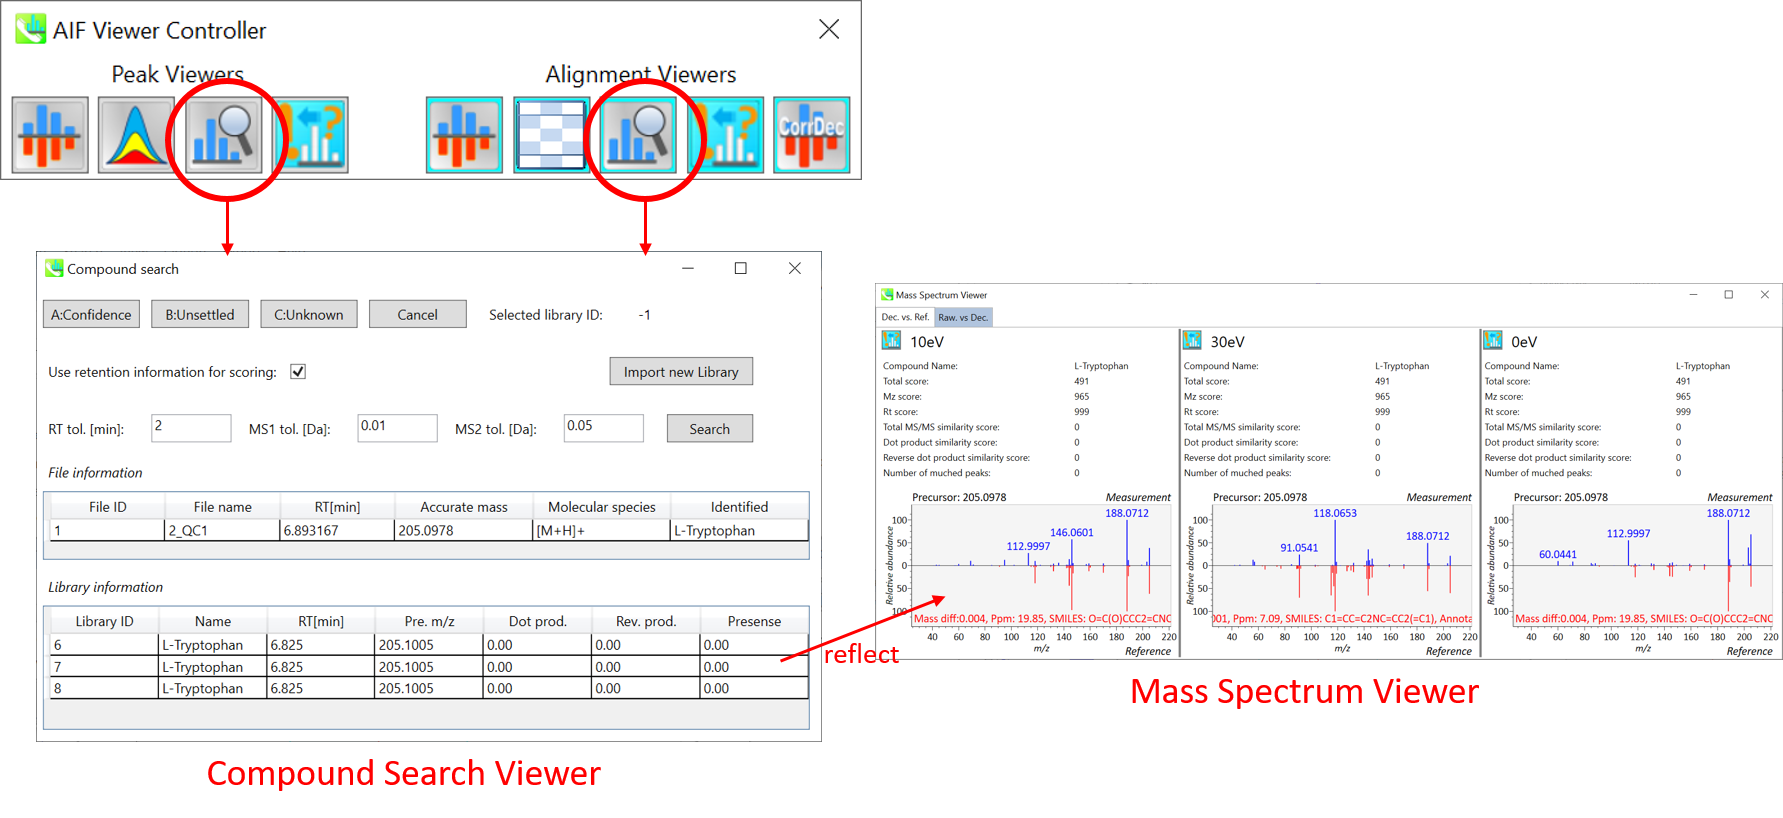
This function is almost the same as the compound search in the main viewer. Please refer to Section 4 of Chapter 5. Additionally, you can change a compound library by clicking the “Import new Library” button. After changing a library file, you cannot click the confidence/unsettled button. In that case, please change the annotation using the ion table directly.
此功能与主查看器中的复合搜索几乎相同。请参阅第 5 章第 4 节。此外,您可以通过单击“导入新库”按钮来更改化合物库。更改库文件后,无法单击“置信度/未解决”按钮。在这种情况下,请直接使用离子表更改注释。
When you select a different reference spectrum, the mass spectrum viewers will be changed (the score and the reference MS/MS spectrum). Then, please also launch Mass Spectrum Viewer when you use this function.
当您选择不同的参考谱图时,质谱查看器将发生变化(分数和参考MS/MS谱图)。然后,当您使用此功能时,也请启动质谱查看器。
Section 9-4 第 9-4 节
Aligned sample table viewer for checking each sample
对齐的样品表查看器,用于检查每个样品
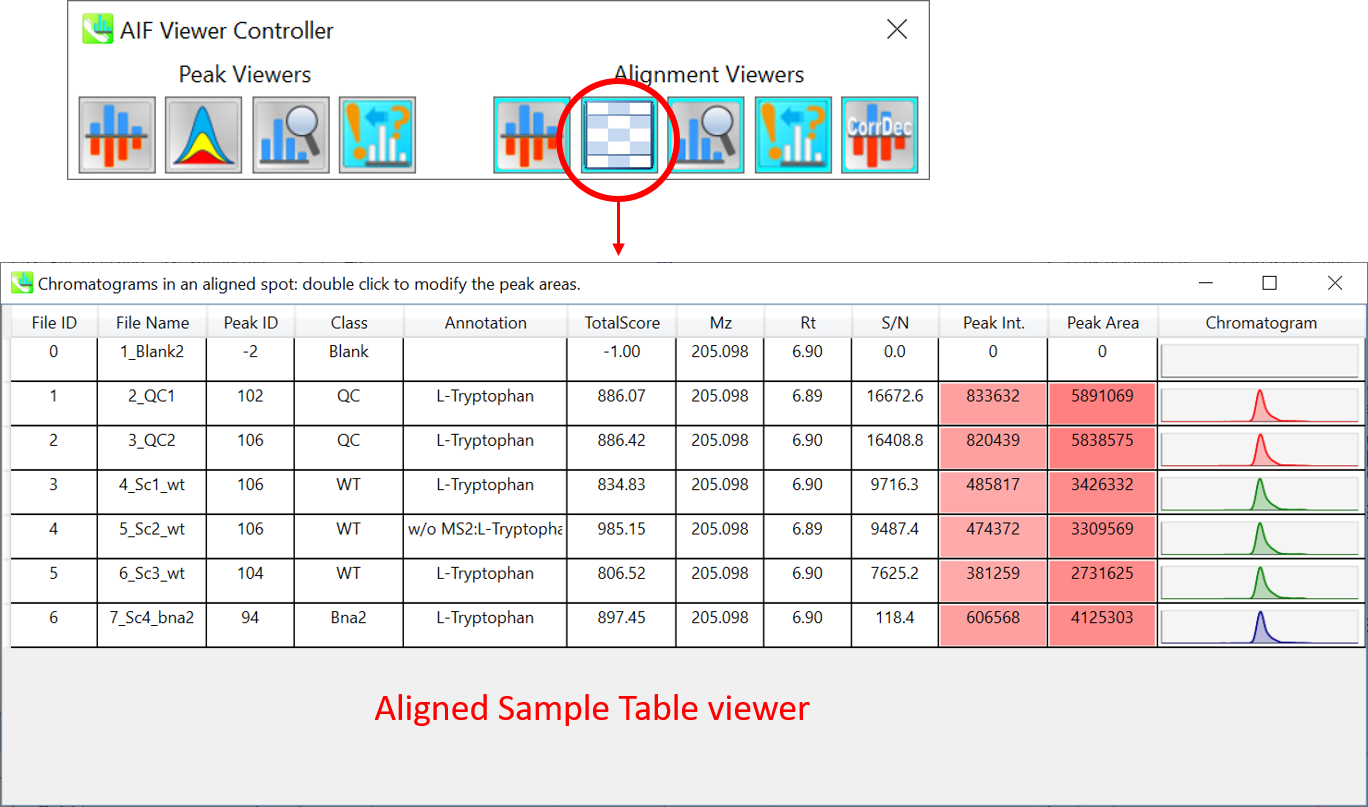
This viewer shows each sample’s peak information including chromatogram peak shapes in an alignment spot. The value of ‘-2’ in “Peak ID” column means that the peak is not detected by peak picking process. (but calculated by gap-filling method). In the case of gap-filled peak, the colors of the “Peak Int.” and “Peak Area” columns become light blue. In normal, the colors (red) reflect the level of peak intensity or peak area. You cannot refine the peak and alignment yet, but that function will be developed.
该查看器显示每个样品的峰信息,包括色谱图峰形。“峰值 ID”列中的“-2”值表示峰值拾取过程未检测到峰值。(但通过间隙填充法计算)。在间隙填充峰的情况下,“峰内部”和“峰面积”列的颜色变为浅蓝色。在正常情况下,颜色(红色)反映了峰强度或峰面积的水平。您还不能细化峰值和对齐,但该功能将被开发。
Section 9-5 第 9-5 节
Bulk export to MS-FINDER from peak and alignment spot table
从峰值和对齐点表批量导出到 MS-FINDER
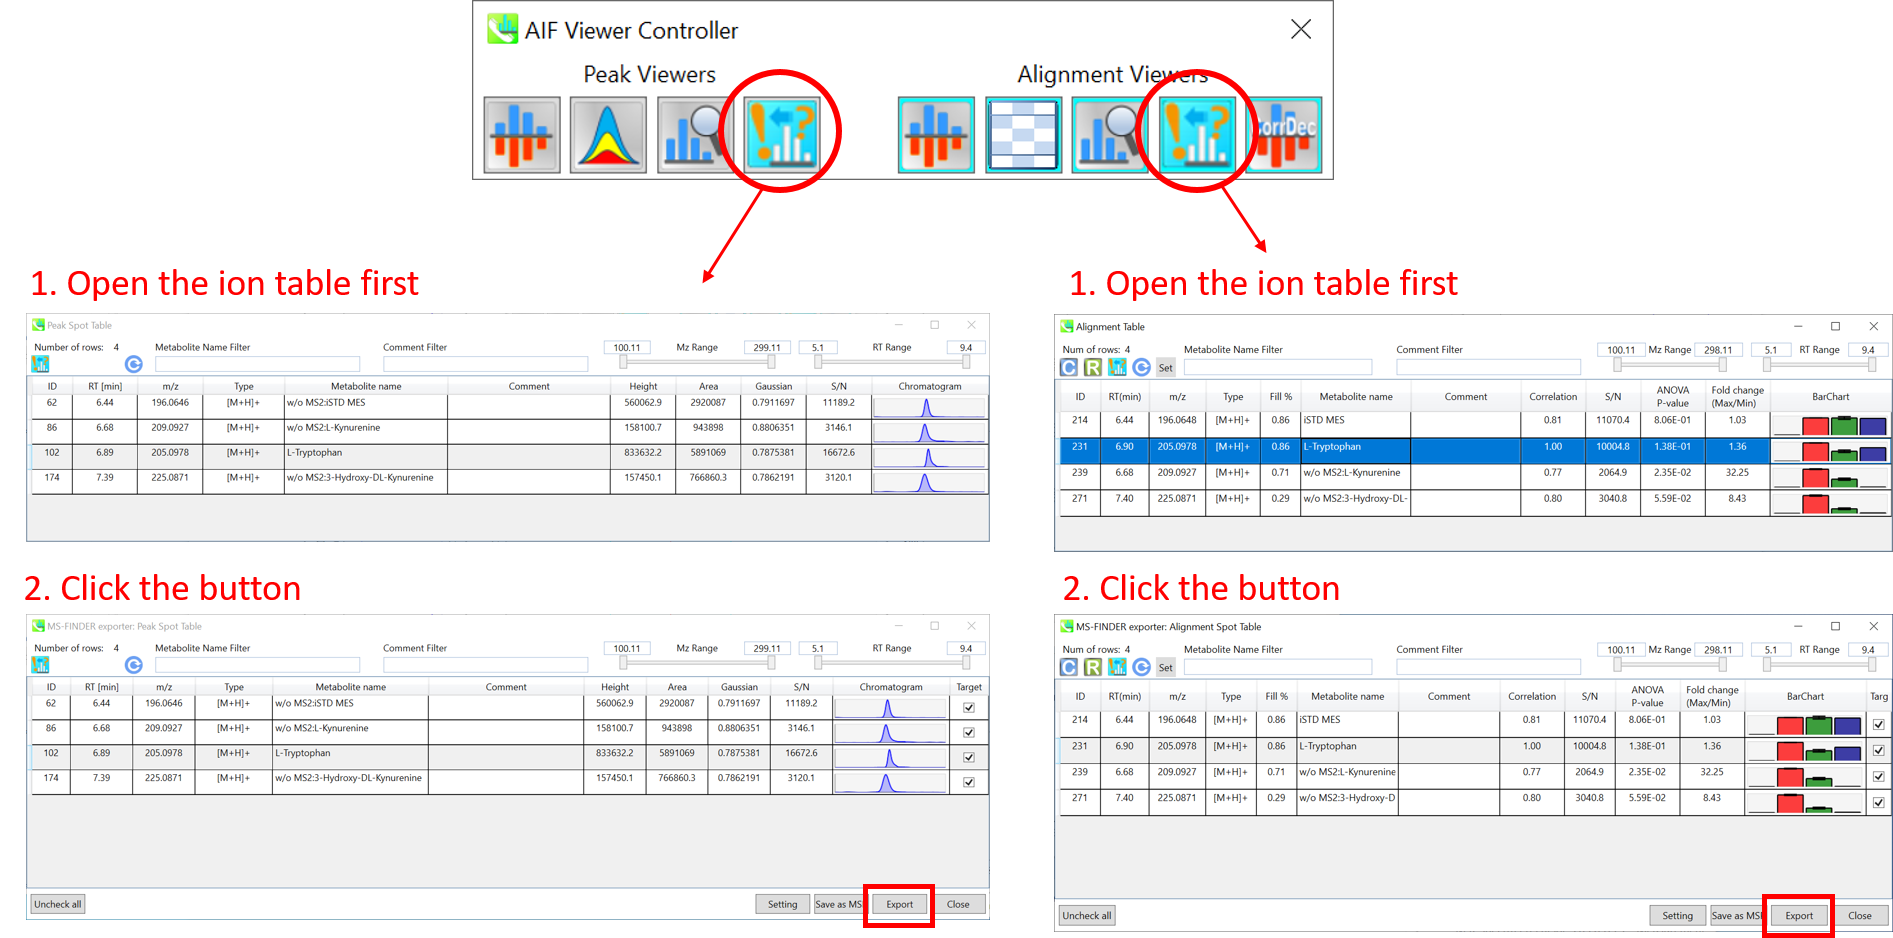
Please open the peak spot table or alignment spot table first. Then, click the button. You can export the selected compounds to MS-FINDER. On the first time that you try to export into MS-FINDER, a pop up window will be generated, and then select ‘MSFINDER.exe’ from its dialog box. The detail of MS-FINDER is described in http://prime.psc.riken.jp/Metabolomics_Software/MS-FINDER/index.html. Note that you have to download the MS-FIDNER program from the website above on your PC.
请先打开峰点表或对齐点表。然后,单击按钮。您可以将选定的化合物导出到MS-FINDER。首次尝试导出到 MS-FINDER 时,将生成一个弹出窗口,然后从其对话框中选择“MSFINDER.exe”。MS-FINDER 的详细信息在 http://prime.psc.riken.jp/Metabolomics_Software/MS-FINDER/index.html 中进行了描述。请注意,您必须在PC上从上述网站下载MS-FIDNER程序。
Section 9-6 第 9-6 节
MS viewer for correlation based deconvolution
用于基于相关性的反卷积的 MS 查看器
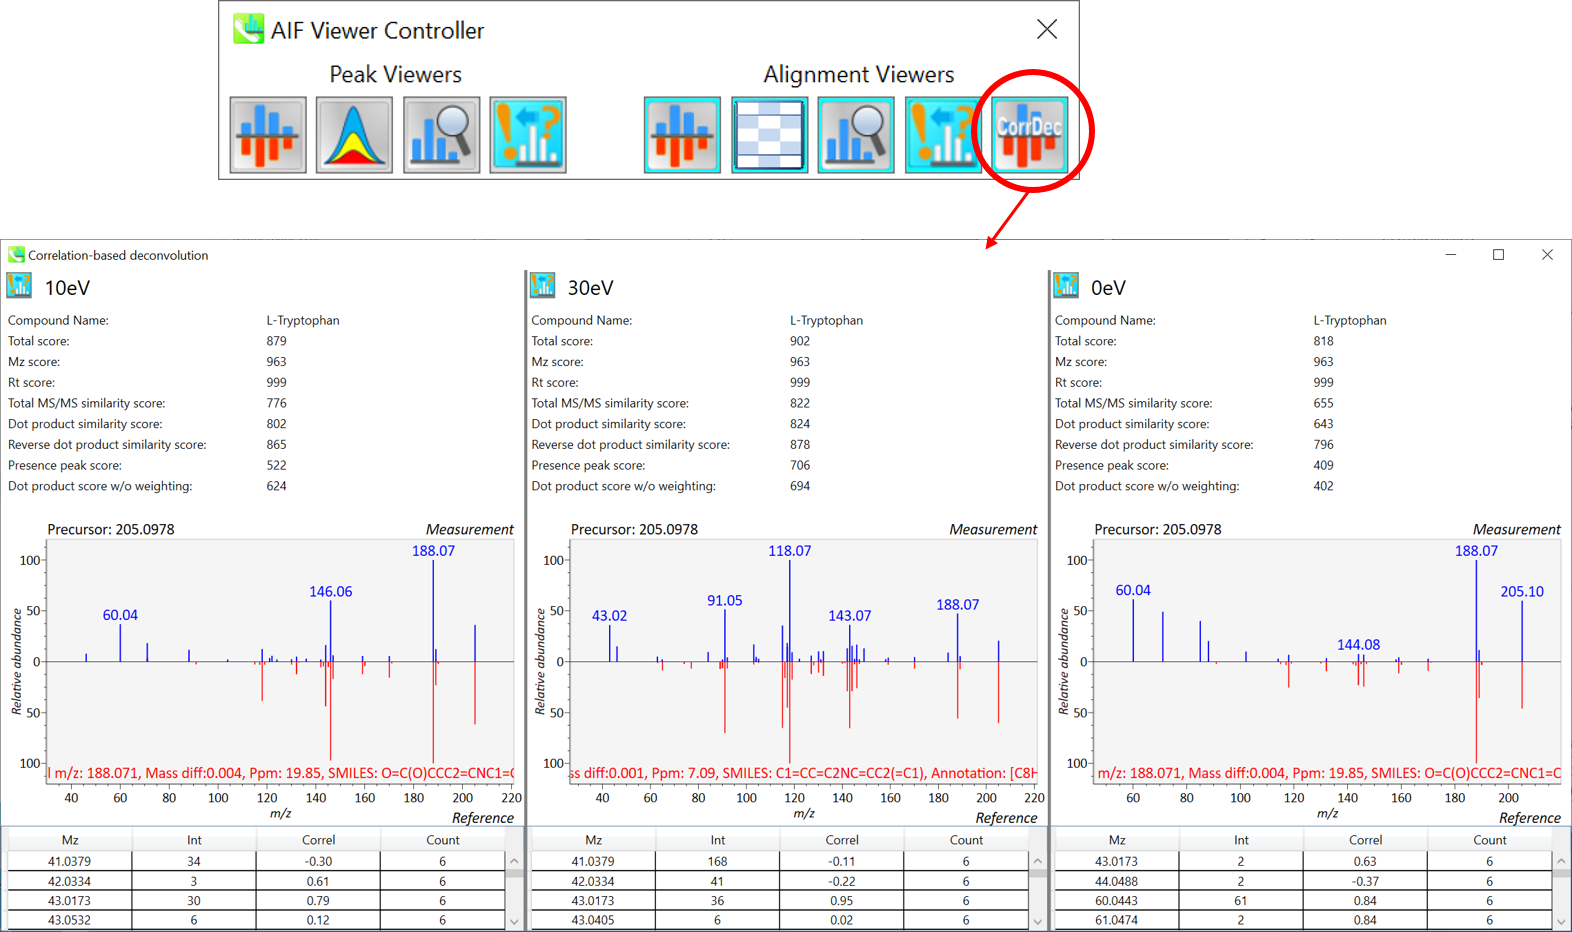
If you have done the correlation-based deconvolution analysis, you can check the deconvoluted MS/MS spectrum (blue, the upper part) and the reference MS/MS spectrum (red, the lower part) by this button.
如果您已经完成了基于相关性的反卷积分析,您可以通过此按钮检查去卷积的 MS/MS 谱图(蓝色,上部)和参考 MS/MS 谱图(红色,下部)。
Chapter 10 第10章
LC-Ion mobility project LC-Ion迁移率项目
A project dealing with LC-Ion mobility is demonstrated.
演示了一个涉及LC-离子迁移率的项目。
This tutorial uses LC-Ion mobility tandem MS (PASEF) data set which are downloadable from the below link.
本教程使用LC-离子淌度串联质谱(PASEF)数据集,可从以下链接下载。
http://prime.psc.riken.jp/Metabolomics_Software/MS-DIAL/index.html
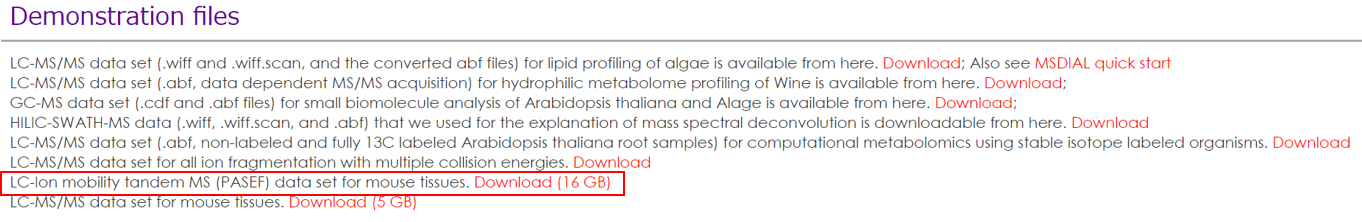
Experiment summary: 实验总结:
Liquid chromatography: total 30 min run per sample with Waters Acquity UPLC BEH peptide C18 column (50×2.1 mm; 1.7 μm).
液相色谱:使用Waters Acquity UPLC BEH肽C18色谱柱(50×2.1 mm;1.7 μm)对每个样品进行总运行30分钟。
Ion mobility: Bruker PASEF acquisition doing ion mobility (IM) separation with data dependent MS/MS acquisition (DDA).
离子淌度:布鲁克 PASEF 采集通过数据依赖型 MS/MS 采集 (DDA) 进行离子淌度 (IM) 分离。
Data: Total 10 LC-ESI(-)-IM-DDA-MS data from blank, mouse liver (n=3), mouse kidney (n=3), and mouse skeletal muscle (n=3) are demonstrated in this tutorial.
数据:本教程演示了来自空白、小鼠肝脏 (n=3)、小鼠肾脏 (n=3) 和小鼠骨骼肌 (n=3) 的总共 10 个 LC-ESI(-)-IM-DDA-MS 数据。
Section 10-1 第 10-1 节
Convert a vendor’s format into IBF
将供应商的格式转换为 IBF
The first step is to convert your vendor’s format into IBF format. The file converter is included in the MS-DIAL package.
第一步是将供应商的格式转换为 IBF 格式。文件转换器包含在 MS-DIAL 软件包中。
Bruker: Raw data can readily be converted into .ibf format without any additional steps.
布鲁克:原始数据可以很容易地转换为.ibf格式,无需任何额外的步骤。
Waters: Raw data can readily be converted into .ibf format without any additional steps.
Waters:原始数据可以很容易地转换为.ibf格式,无需任何额外的步骤。
Agilent: Please convert your data into .mzML format by means of ProteoWizard msconvert at first.
Agilent:请先通过 ProteoWizard msconvert 将您的数据转换为 .mzML 格式。
Start “IbfConverter.exe”.
启动“IbfConverter.exe”。
Drag & drop vendor files into this program.
将供应商文件拖放到此程序中。
Click “Convert”. 点击“转换”。
The IBF files are generated in the same directory as the raw data files. (See the figure below)
IBF 文件与原始数据文件在同一目录中生成。(见下图)
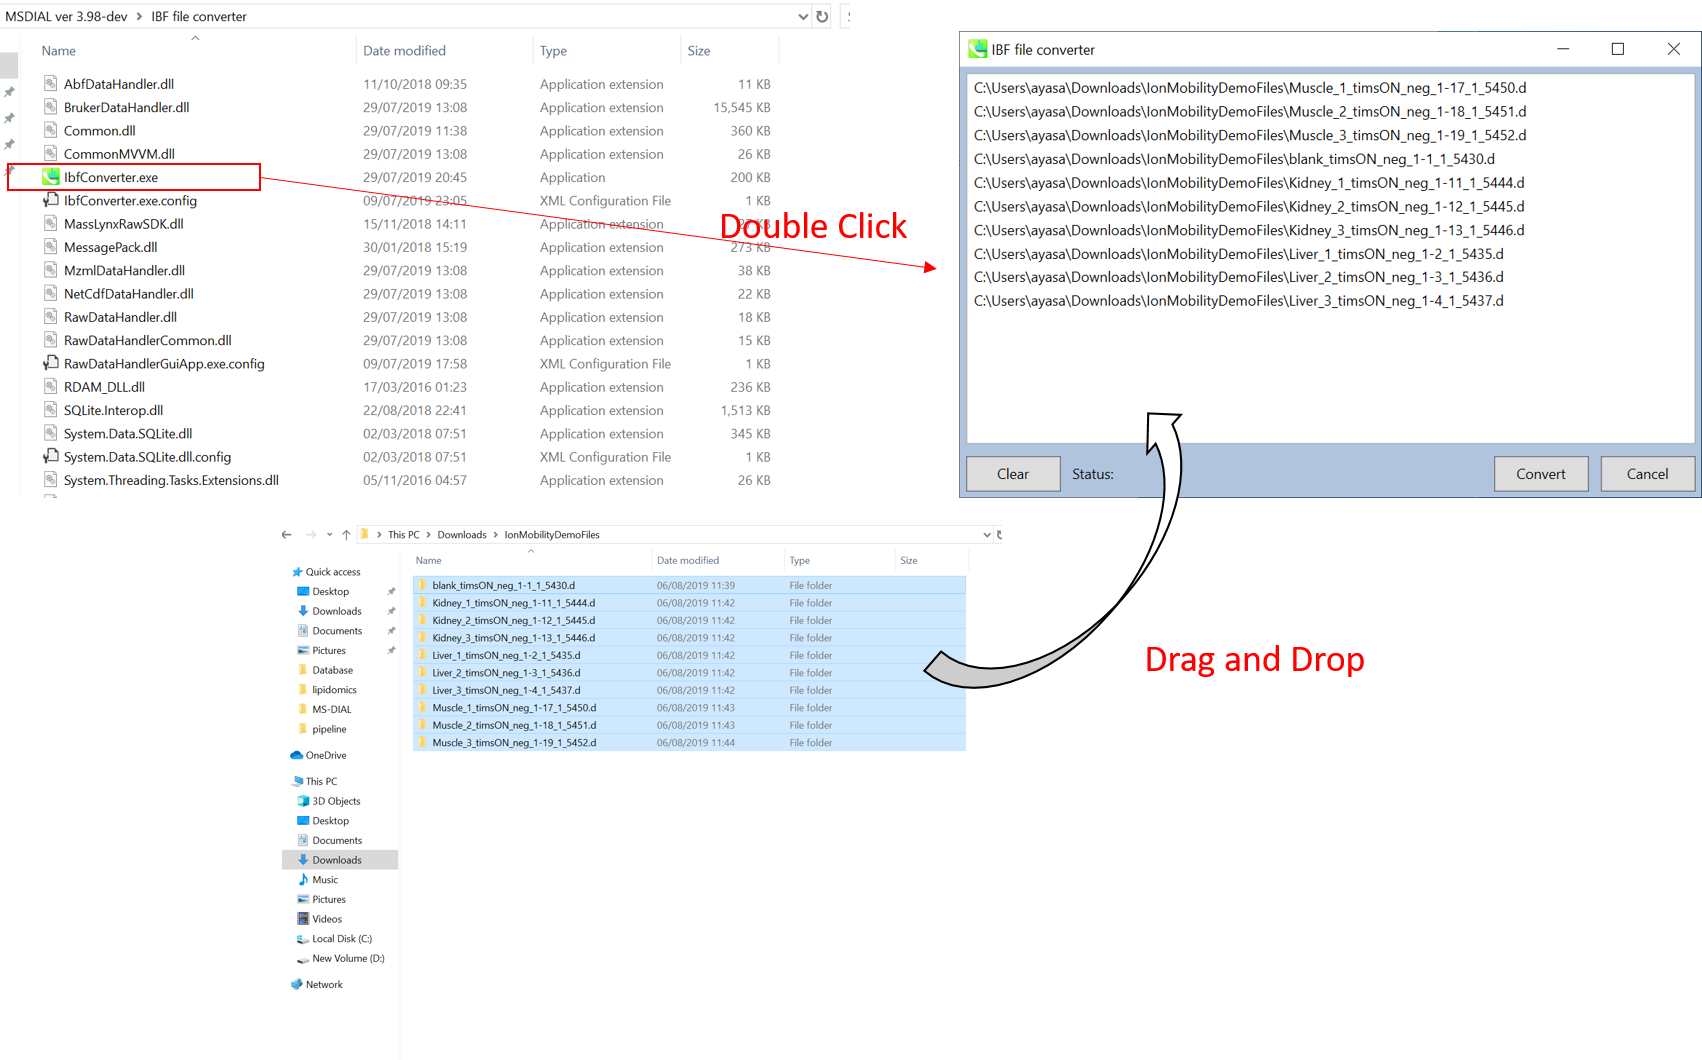
Section 10-2 第10-2节
Starting up your project
启动项目
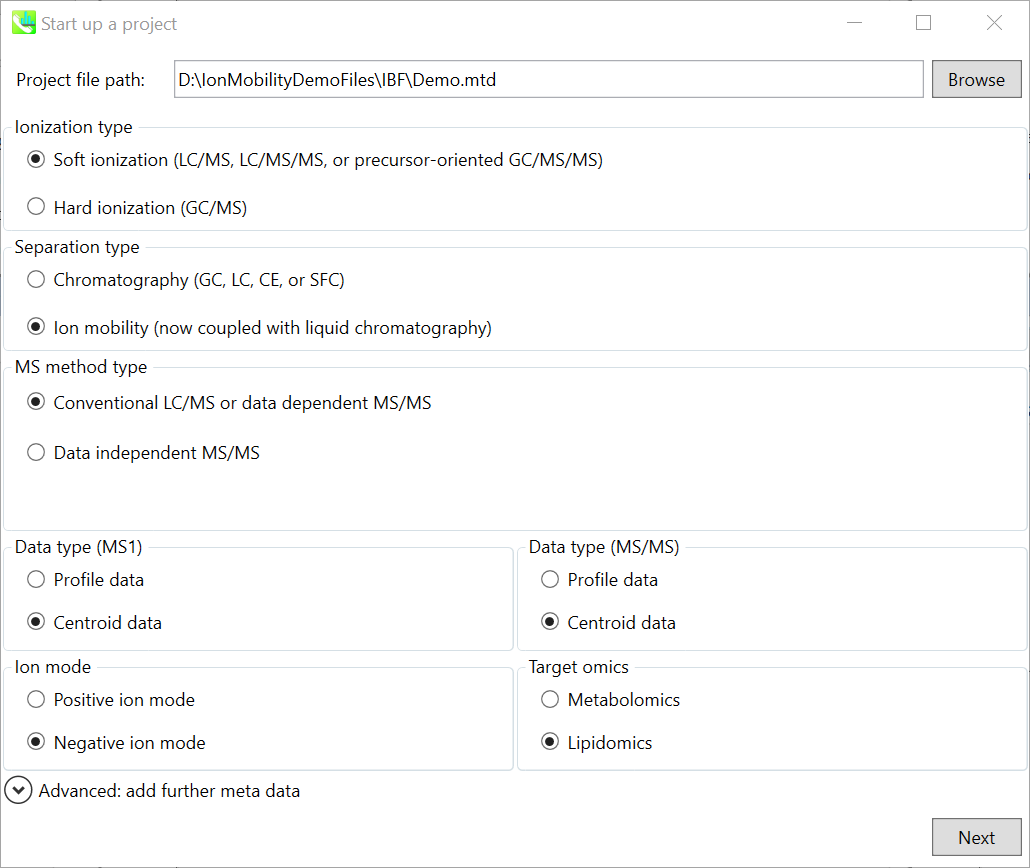
In this demo, we used files already converted to ibf format, which are in a folder named IBF.
在这个演示中,我们使用了已经转换为 ibf 格式的文件,这些文件位于名为 IBF 的文件夹中。
File -> new project
文件 -> 新项目
Set your project file path to the directory of your IBF files
将项目文件路径设置为 IBF 文件的目录
Choose the separation type “Ion mobility”
选择分离类型“离子淌度”
Choose data type ‘centroid data’ for both MS1 and MS/MS
为 MS1 和 MS/MS 选择数据类型“质心数据”
Choose negative ion mode
选择负离子模式
Choose target omics as lipidomics
选择目标组学作为脂质组学
Section 10-3 第10-3节
Importing IBF files 导入 IBF 文件
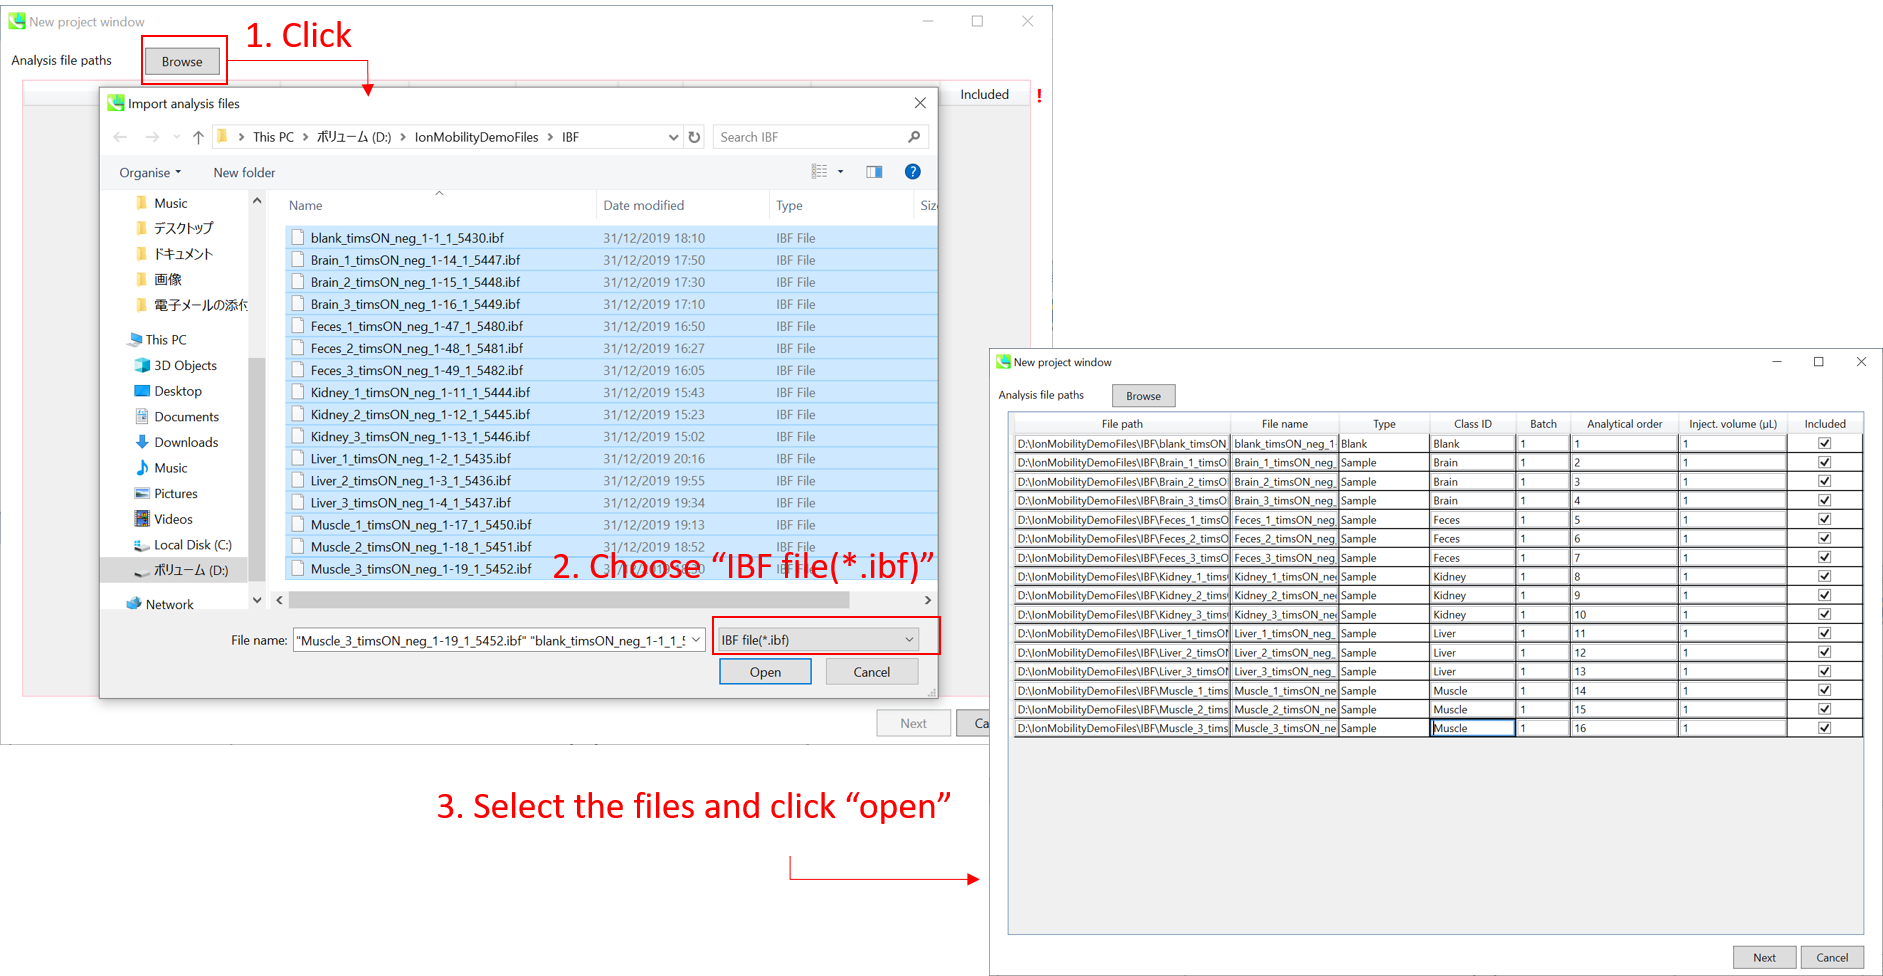
Select IBF files 选择 IBF 文件
If the file is a “blank” or “quality control” sample, then set the type as such. (in this example, you do not have any QC sample.)
如果文件是“空白”或“质量控制”样本,则按此方式设置类型。(在此示例中,您没有任何 QC 样品。
Note: Please finalize your file name here, because you cannot change it later.
注意:请在此处完成您的文件名,因为您以后无法更改它。
Section 10-4 第10-4节
Setting parameters 设置参数
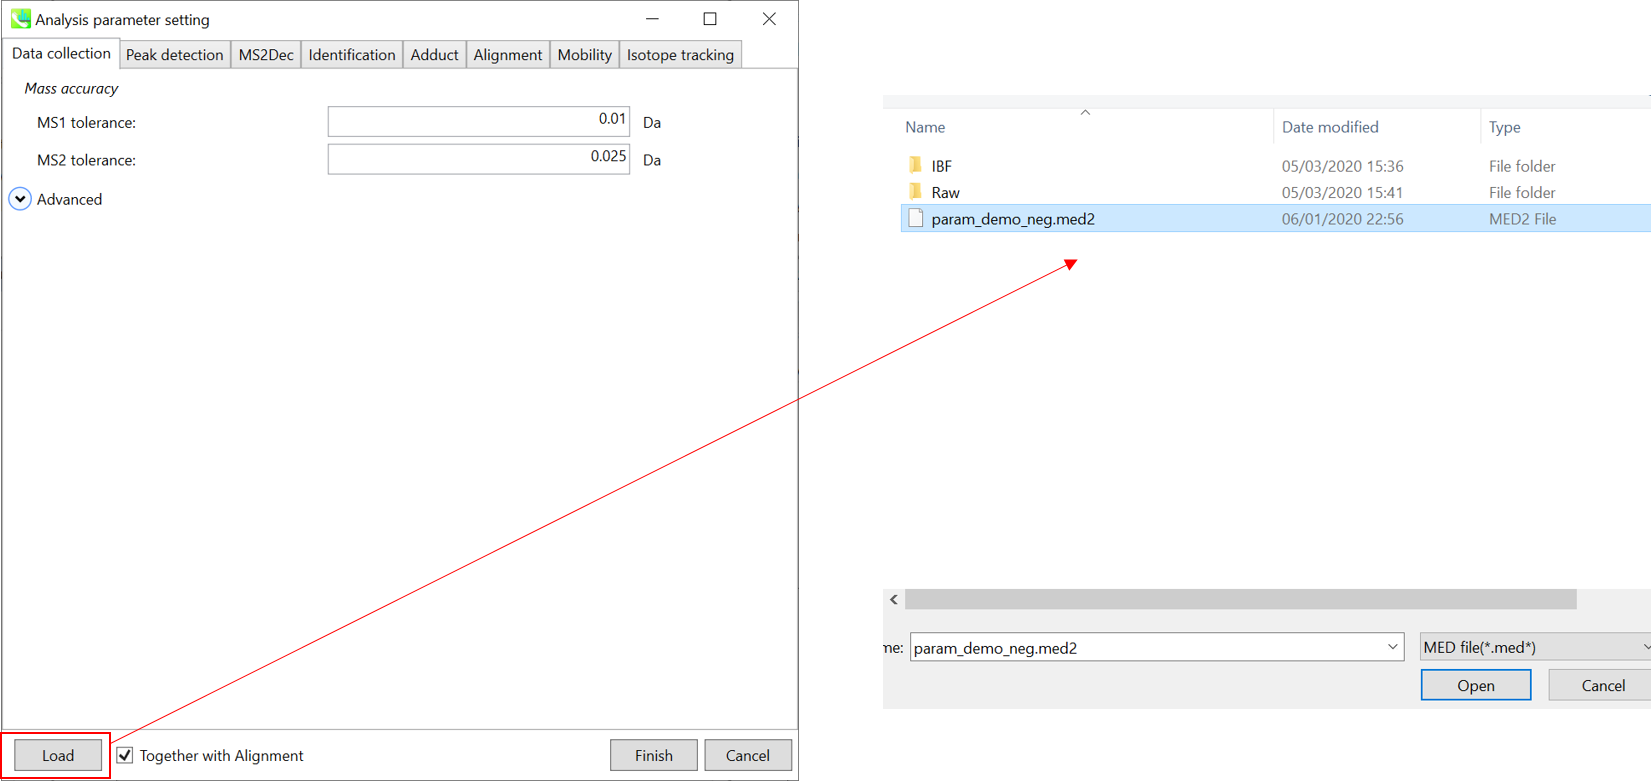
∗ For the quick start and its explanations, load ‘param_demo_neg.med2’ as shown above.
∗ 有关快速入门及其说明,请加载“param_demo_neg.med2”,如上所示。
Section 10-4-1 第 10-4-1 节
Data collection tab “数据收集”选项卡
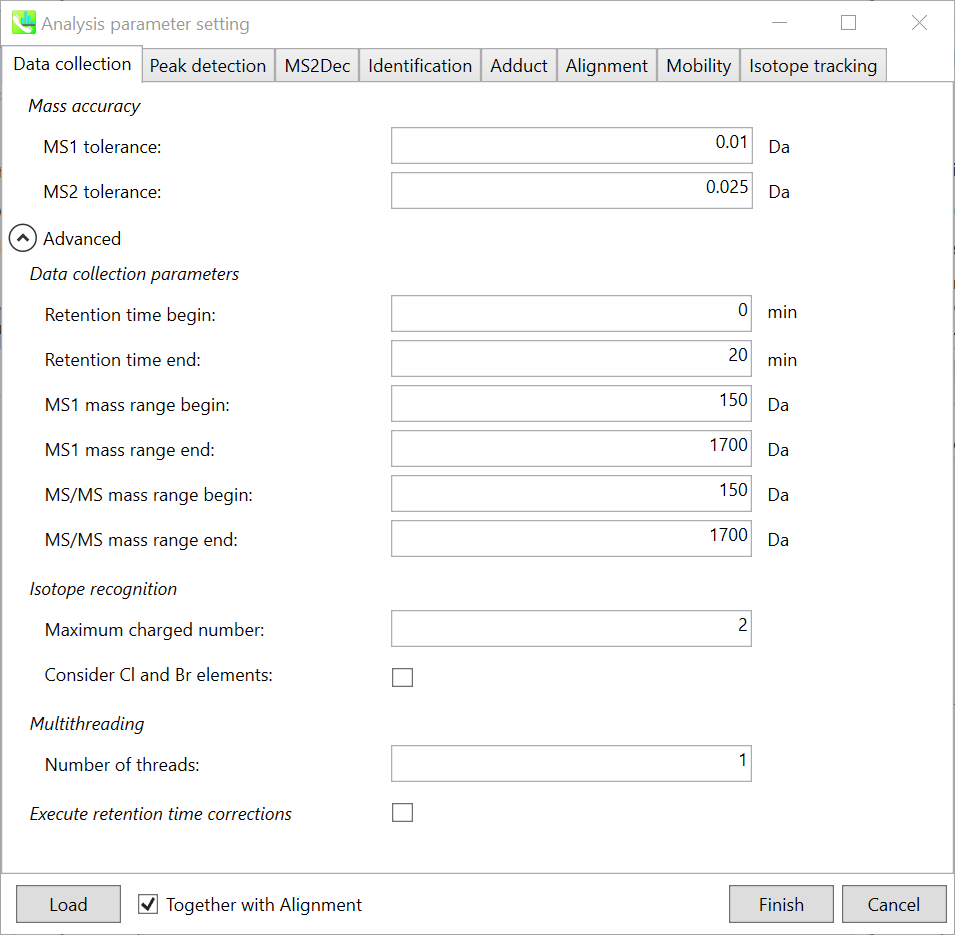
Mass accuracy: After the peak detection algorithm is applied along the MS axis with a very low threshold, MS-DIAL performs spectral centroiding. By default, mass spectrum of ±0.01 and ±0.01 Da range from each peak top is integrated in MS1 and MS2, respectively. Importantly, this MS2 tolerance value is also used to build the MS/MS chromatogram for a certain m/z trace. The MS/MS chromatograms are dedicated to the MS2Dec deconvolution program.
质量精度:在以非常低的阈值沿MS轴应用峰值检测算法后,MS-DIAL执行光谱质心。默认情况下,MS1 和 MS2 中分别积分了每个峰顶的 ±0.01 和 ±0.01 Da 范围的质谱图。重要的是,该MS2容差值还用于构建特定m/z迹线的MS/MS色谱图。MS/MS色谱图专用于MS2Dec反卷积程序。
Data collection parameters: You can set analysis ranges (RT, MS1 and MS/MS axis). In this demonstration, your expected data range is 0-20 min for 150-1700 Da.
数据采集参数:可设置分析范围(RT、MS1、MS/MS轴)。在此演示中,对于 150-1700 Da,您的预期数据范围为 0-20 分钟。
Isotope recognition: As long as you focus on small molecule researches (less than 2000 Da), Maximum charged number can be set to 2. On the other hand, the parameter can be changed to 8 or more to process proteome or snRNA research data.
同位素识别:只要专注于小分子研究(小于2000 Da),最大充电数可以设置为2。另一方面,可以将参数更改为 8 或更多以处理蛋白质组或 snRNA 研究数据。
Check Consider Cl and Br elements if you assume that your samples contain any halogen element as halogens have unique characteristic of isotope.
如果您假设您的样品含有任何卤素元素,请选中考虑 Cl 和 Br 元素,因为卤素具有同位素的独特特性。
Multithreading: Please set the count of threads that you want to use. You can check the maximum thread counts in resource monitor. (open task manager->open resource monitor)
多线程:请设置要使用的线程数。您可以在资源监视器中检查最大线程计数。(打开任务管理器->打开资源监视器)
Execute retention time corrections: For detail, visit ‘The tutorial and parameter files for MS-DIAL ALF dataprocessing and spectral library construction methodology’ in the website of MS-DIAL shown below(URL: http://prime.psc.riken.jp/Metabolomics_Software/MS-DIAL/).
执行保留时间校正:有关详细信息,请访问如下所示的MS-DIAL网站中的“MS-DIAL ALF数据处理和谱库构建方法的教程和参数文件”(URL:http://prime.psc.riken.jp/Metabolomics_Software/MS-DIAL/)。
Section 10-4-2 第 10-4-2 节
Peak detection tab and MS2Dec tab
峰值检测选项卡和 MS2Dec 选项卡
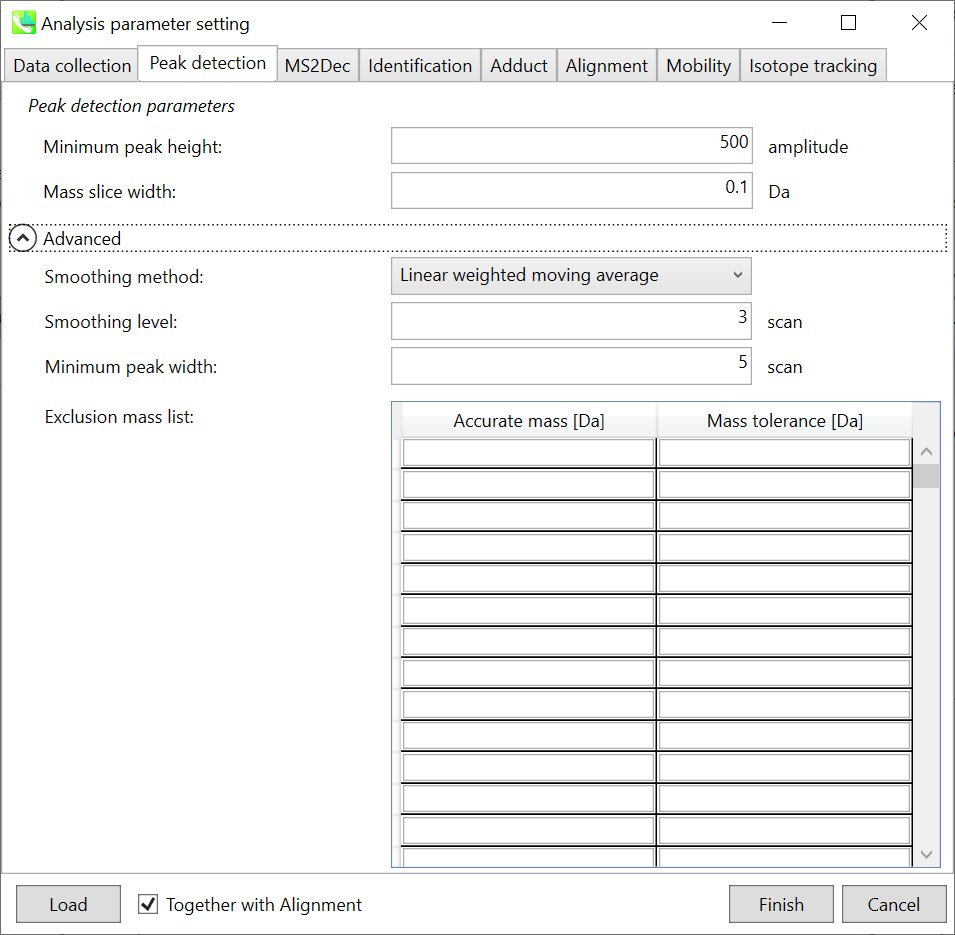
The details are described in Chapter 2&3. In Waters and Bruker QTOF, the minimum peak height can be set to 300-500 as long as I confirmed. Here, 500 is set for minimum peak height because the demonstration file was obtained by Waters Xevo QTOF.
详细信息在第 2 章和第 3 章中描述。在Waters和Bruker QTOF中,只要我确认,最小峰高可以设置为300-500。这里,最小峰高设置为500,因为演示文件是由Waters Xevo QTOF获得的。
MS2Dec tab is mainly for data independent MS/MS project. Please see Section 2-3-3 for details.
MS2Dec选项卡主要用于与数据无关的MS / MS项目。有关详细信息,请参阅第 2-3-3 节。
Section 10-4-3 第 10-4-3 节
Identification tab “标识”选项卡
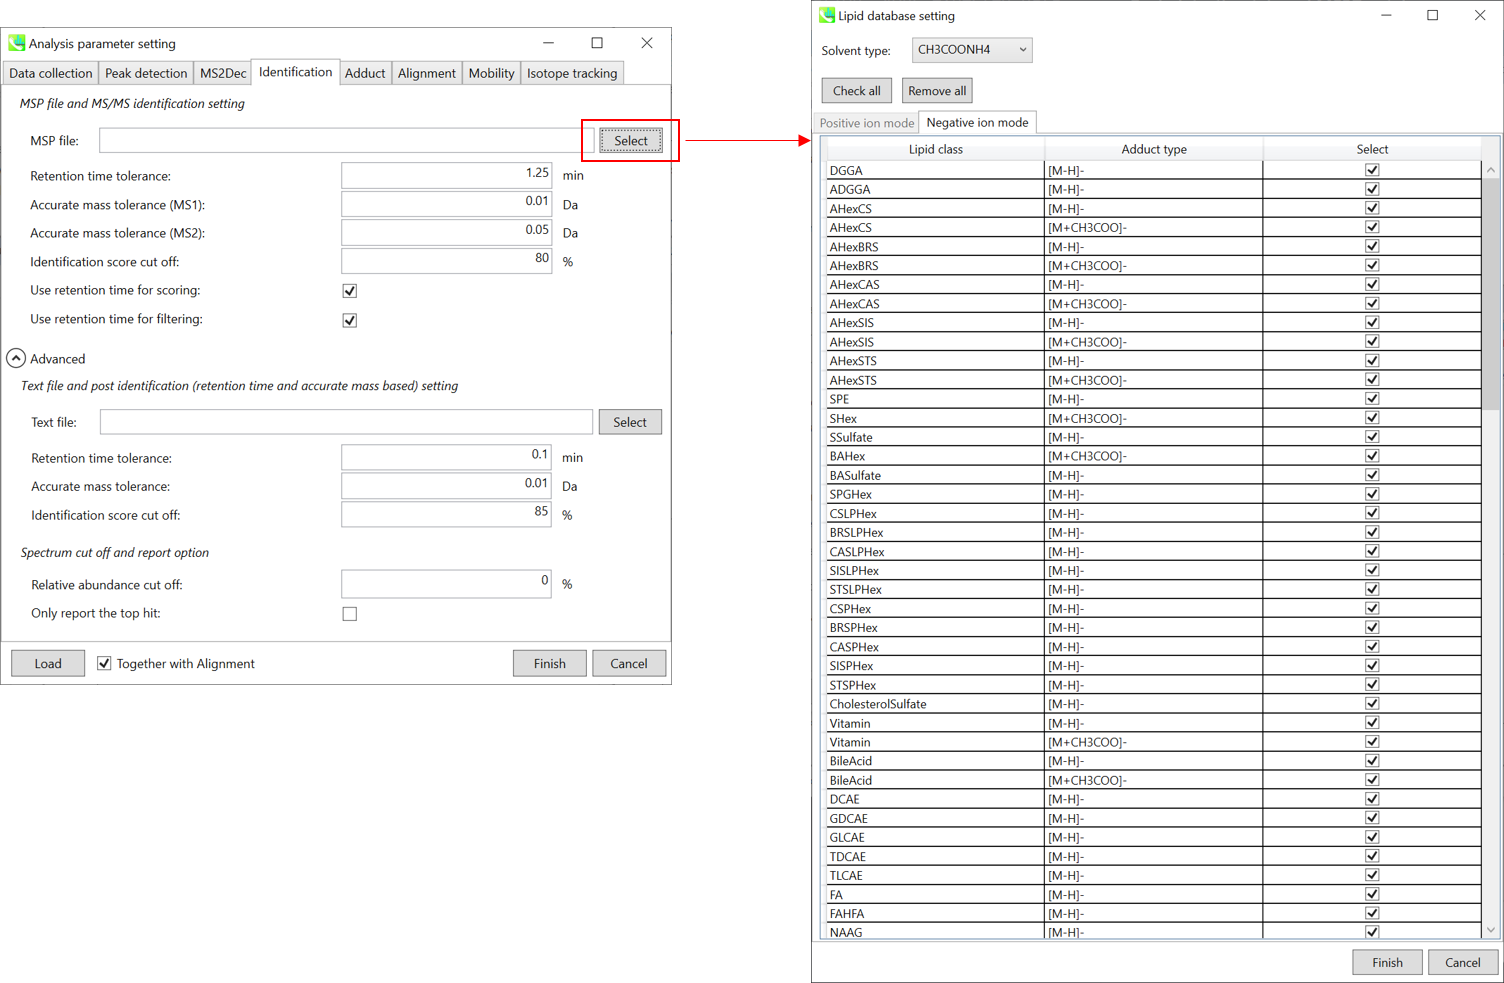
MSP file: In the case that you selected ‘lipidomics’ project, select what you want to find in your data sets for lipid profiling. Here, tick all lipids.
MSP 文件:如果您选择了“脂质组学”项目,请选择要在数据集中查找的内容以进行脂质分析。在这里,勾选所有脂质。
Parameters: If you put retention time (RT) information in your MSP file, set the RT tolerance value (default is 0.5). The two mass tolerances for MS1 and MS2 are required for the compound search and they are dependent on your instrument performance. The cutoff of the identification score should be greater than 0.7 or 0.8.
参数:如果将保留时间 (RT) 信息放入 MSP 文件中,请设置 RT 容差值(默认值为 0.5)。MS1 和 MS2 的两个质量允差是化合物搜索所必需的,它们取决于您的仪器性能。识别分数的临界值应大于 0.7 或 0.8。
If the checkbox of ‘Use retention information for scoring’ is checked, the scoring of retention time is used for the calculation of total score which is used for the identification cut off. If the checkbox of ‘Use retention information for filtering’ is checked, the program do not search beyond the RT tolerance value.
如果勾选“使用留存信息进行评分”复选框,则保留时间评分将用于计算总分,用于识别截止。如果选中“使用保留信息进行筛选”复选框,则程序不会搜索超出 RT 容差值的范围。
Text file: If you want to perform “post identification” processing, set your text file here.
文本文件:如果要执行“后识别”处理,请在此处设置文本文件。
Section 10-4-4 第 10-4-4 节
Adduct tab 加合物选项卡
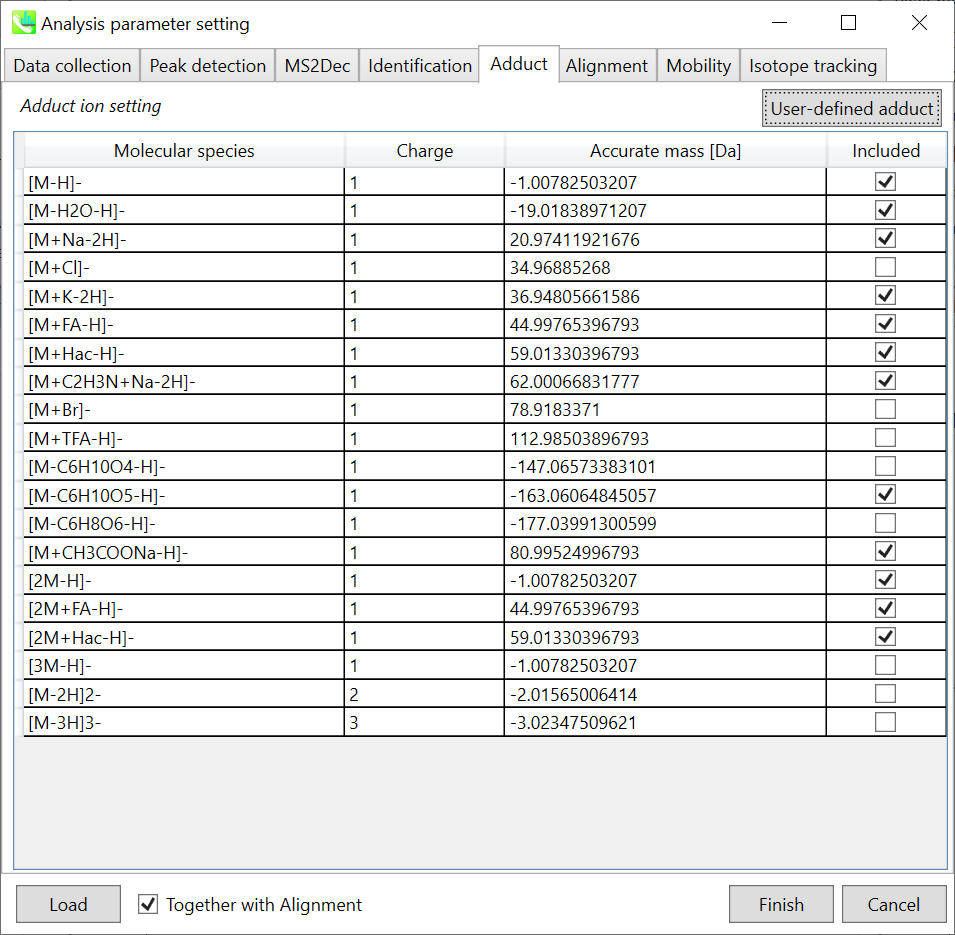
Adduct ion setting: You can tick the adduct ions and charge values to be considered.
加合离子设置:您可以勾选要考虑的加合离子和电荷值。
∗ see also the section 3-3-5 of Chapter 3 for the explanation of how to determine your own adduct ion.
∗另请参阅第 3 章的第 3-3-5 节,了解如何确定自己的加合物离子。
Section 10-4-5 第 10-4-5 节
Alignment tab “对齐方式”选项卡
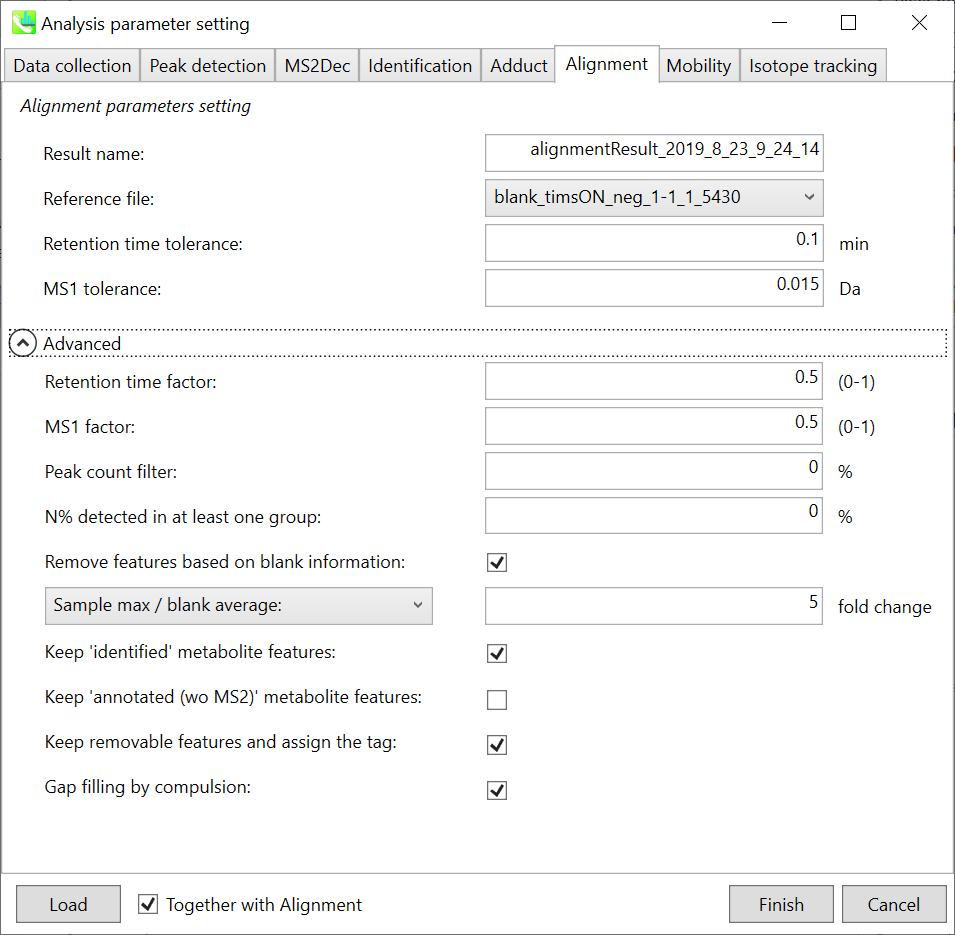
Parameters: If you already have a suitable quality control (QC) data, typically a mixed sample data, then specify the QC file in ‘Reference file’. All sample data will be aligned to this QC file. The RT and MS1 tolerances for peak alignment depend on your chromatographic conditions (see MS-DIAL mathematics for details). If you want to remove specific peaks that are not fully detected in the alignment, specify the peak count filter.
参数:如果您已经有合适的质量控制 (QC) 数据,通常是混合样品数据,则在“参考文件”中指定 QC 文件。所有样品数据都将与此 QC 文件对齐。峰比对的RT和MS1允差取决于您的色谱条件(有关详细信息,请参见MS-DIAL数学)。如果要删除在对齐中未完全检测到的特定峰,请指定峰计数过滤器。
Section 10-4-6 第 10-4-6 节
Mobility tab “移动性”选项卡
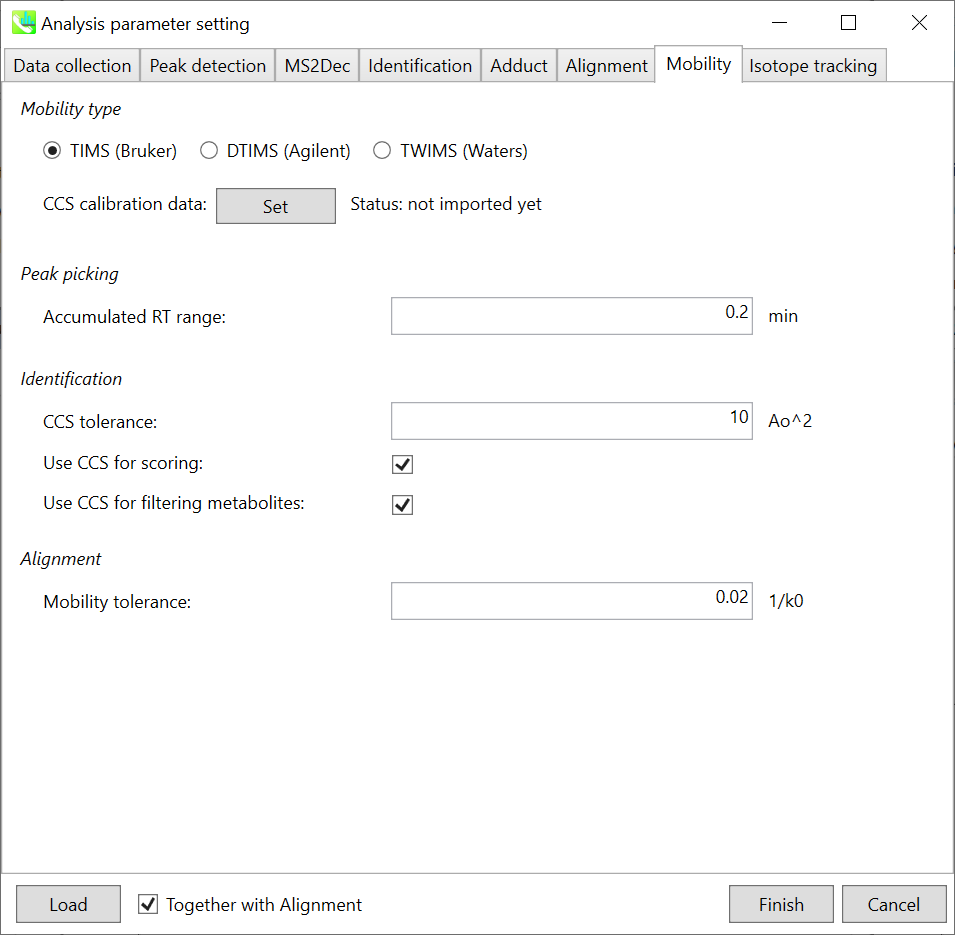
Mobility type: Choose your instrument type. The unit of mobility tolerance is different for each type.
移动类型:选择您的仪器类型。每种类型的移动容差单位都不同。
The calibrant information such as beta coefficient and intercept values (Tfix) for the Agilent single field method and t0, exponent, and coefficient values for the Waters collision cross section calculation are also stored in the IBF format (the status of CCS calibration data will be “imported”). If the status of CCS calibration data is “not imported yet”, please specify the values in Set. If there is no calibrant information, the collision cross-section (CCS) is calculated using the Mason–Schamp equation for Bruker trapped IM, the single field CCS method for Agilent drift tube IM, and the IM calibration function for Waters travelling wave IM.
校准信息,如安捷伦单场法的 beta 系数和截距值 (Tfix) 以及沃特世碰撞截面计算的 t0、指数和系数值,也以 IBF 格式存储(CCS 校准数据的状态将被“导入”)。如果 CCS 校准数据的状态为“尚未导入”,请在设置中指定值。如果没有校准信息,则使用布鲁克俘获 IM 的 Mason-Schamp 方程、安捷伦漂移管 IM 的单场 CCS 方法和 Waters 行波 IM 的 IM 校准函数计算碰撞截面 (CCS)。
Peak picking: The parameter of “Accumulated RT range” is used to accumulate the mobility axis spectra. After the peak picking is performed in the retention time axis, the program expands the ions to the mobility axis. If the peak top in retention time axis is 5.0 min and 0.2 min is set as “accumulated RT range”, the mobility scan data from 4.8 min to 5.2 min is accumulated. Then, the extracted ion mobilogram (EIM) is constructed by the accumulated mobility spectra followed by the peak picking in mobility axis.
峰值拾取:使用“累积RT范围”参数来累积迁移率轴谱。在保留时间轴上进行峰拾取后,程序将离子扩展至淌度轴。如果保留时间轴的峰值峰值为5.0 min,并且0.2 min设置为“累积RT范围”,则累积4.8 min至5.2 min的迁移率扫描数据。然后,通过累积淌度谱,然后在淌度轴上拾取峰来构建提取的离子迁移谱(EIM)。
Identification: If the checkbox of ‘Use CCS for scoring’ is checked, the scoring of CCS is used for the calculation of total score which is used for the identification cut off. If the checkbox of ‘Use CCS for filtering metabolites’ is checked, the program do not search beyond the CCS tolerance value.
识别:如果勾选“使用CCS进行评分”复选框,则CCS的评分将用于计算总分,用于识别截止。如果选中“使用 CCS 过滤代谢物”复选框,则程序不会搜索超出 CCS 容差值的范围。
Section 10-5 第10-5节
Result checking 结果检查
MS-DIAL can automatically identify metabolite peaks by the similarity calculation of retention time, precursor m/z, isotopic ratios, and MS/MS spectrum with the reference databases. You can easily check the result from alignment ion spot table.
MS-DIAL可以通过与参考数据库的保留时间、母离子m/z、同位素比值和MS/MS谱图的相似性计算来自动识别代谢物峰。您可以从对准离子光斑表中轻松查看结果。

Center window (Peak spot viewer): You can check the metabolite peaks in both retention time- and mobility dimensions. Here, the peak in retention time axis and mobility axis is termed as “RT peak” and “IM peak”, respectively. Please make sure that in the ion mobility data, the MS/MS spectrum is always assigned to the IM peak, and therefore the annotation is performed for the IM peak property. Namely, one RT peak has several IM peaks, and the annotation result of RT peak is defined by one representative IM peak result which has the highest score in annotation.
中心窗口(峰斑查看器):您可以在保留时间和淌度维度上检查代谢物峰。在这里,保留时间轴和迁移率轴的峰值分别称为“RT峰”和“IM峰”。请确保在离子淌度数据中,MS/MS谱图始终分配给IM峰,因此对IM峰属性进行注释。即,一个RT峰具有多个IM峰,RT峰的注释结果由一个在注释中得分最高的代表性IM峰结果定义。
Alignment table: the IM peak rows should have the information of mobility and CCS properties while the properties are described as “-1” for RT peak property.
对齐表:IM峰行应具有迁移率和CCS属性的信息,而RT峰属性的属性描述为“-1”。